
Excerpt from this week's: Technical Scoop: Hike Talk, Precious Divergence, Oil Slip
Gold and silver
Source: www.stockcharts.com
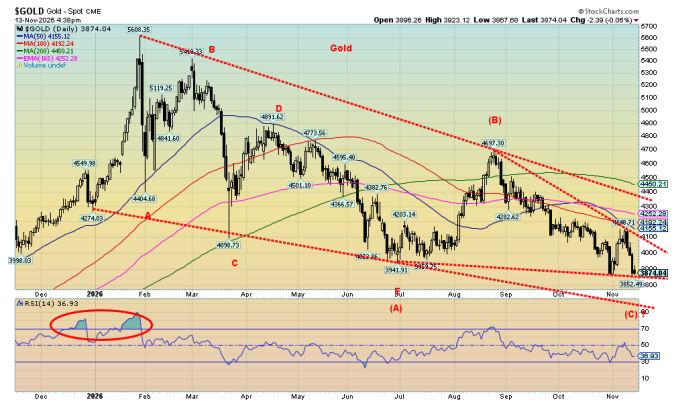
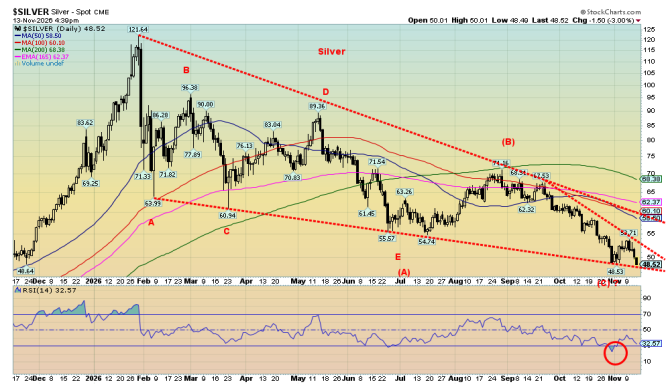
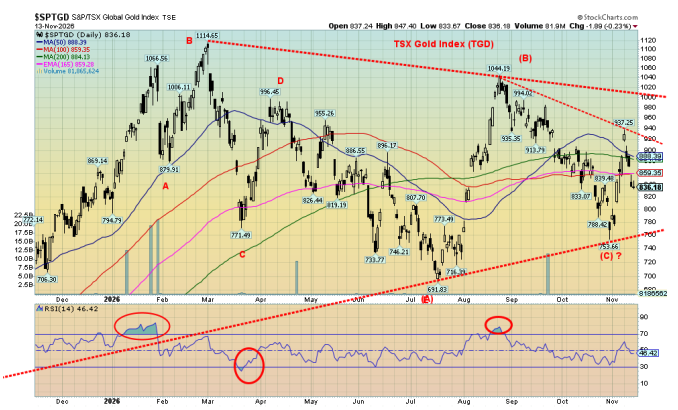
Ouch! Whither gold prices? While we continue to be a bull for gold, some believe that a bigger breakdown is coming before a new bull gets underway. Gold was atrocious again this past week, falling 4.7% and making new 52-week lows. Silver lost 6.1% and closed under $50. Platinum fell 2.7%, palladium dropped 2.1%, and copper was hit because of fears of lower demand due to ongoing protests on new data centers, funding issues in the AI industry, and the Jensen Huang sex scandal. Copper fell 3.0%, closing at $6.05. Naturally, the gold stocks were hit with the Gold Bugs Index (HUI) down 7.6% while the TSX Gold Index (TGD) fell 5.9%.
However, a funny thing happened. Yes, gold made fresh 52-week lows (barely), but silver and platinum did not.
More importantly, the HUI and the TGD remain above the October 30 low and well above the July 17 low. A significant divergence from both gold and silver. What is possible is that gold falls to that lower trend line, currently near 3,600 and possibly down to $3,500. But if silver and the gold stocks hold up making no new lows the divergence continues.
Gold stocks are suggesting that once this mini bear is over, gold will resume its bull market. As well, because of high gold prices and even despite the recent price pullback, gold mining companies are reporting a banner year. As well, drilling and exploration continues. The junior gold and metal mining stocks that reside on the TSX
Venture Exchange (CDNX) have been thoroughly beaten up, with some down over 50% from their recent highs. Many are quite oversold, and yet nothing has changed from when they were at higher prices. No wonder we are seeing buy signals in the junior gold and metal mining stocks. We can’t confirm any bottoms, but the technical signals are there. It’s a question of when, not if.
But for gold, the reality is that the US$ Index is making 52-week highs, interest rates have resumed their upward trend with the U.S. 10-year Treasury note leaping back over 5%, inflation continues on an upward path with this week’s release of the CPI and PPI, and the Fed continues to be forecasted to hike the key Fed rate at the December 8–9 FOMC. The wars continue, threatening to push oil prices higher again which in turn increases inflation. The stock market hangs in and the U.S. economy continues to be the best in the G7. All conspire against holding gold.
Source: www.stockcharts.com
Given that gold stopped at that lower trend line this past week, this gives us some hope that we are at or near a bottom. Silver, in particular, is at trend line support. The divergences with silver and the gold stocks are positive, but only if silver, the HUI, and TGD are not making new lows with gold. Silver maybe, but the gold stocks need to continue to hold up.
We remain bullish for gold, silver, and the gold stocks, but the current correction/bear may not be finished yet.
We continue to look at the December 8–9 FOMC as a possible final low for gold. We remember fondly the low gold made in December 2015 at the FOMC. The Fed actually hiked rates, but gold took off instead of falling. 2016 was a banner year for both gold, silver, and the gold stocks.
Source: www.stockcharts.com
We also like the forming bearish wedge triangles we’re seeing for both and silver. Gold begins to realize its breakout over $4,100. But we’d be far more comfortable over $4,500 where a low could be declared. The TGD is forming a symmetrical triangle with the current lower end near 700. That can’t be ruled out. Breakout is over 940, but we’d feel far better over 1,000 again. The July low for the TGD was at 691, so we definitely would want to see that hold. We’re not oversold here, so further down movements can’t be ruled out. Ultimately, the triangle patterns suggest eventually an upside breakout.
The US$ Index is at an interesting juncture. Yes, the index jumped nicely this past week, right up into an upper trendline from the June and October highs. The RSI is not overbought, but it is diverging with the earlier RSI highs, given a higher index but a lower RSI. The formation looks like a bearish wedge triangle. The odds favour a return down for the US$ Index. A close over 104 would, however, suggest higher levels. The US$ Index is important for the price of gold as the two generally move inversely to each other.
Read the FULL report here: Technical Scoop: Hike Talk, Precious Divergence, Oil Slip
Copyright David Chapman 2026
Disclaimer
David Chapman is not a registered advisory service and is not an exempt market dealer (EMD) nor a licensed financial advisor. He does not and cannot give individualised market advice. David Chapman has worked in the financial industry for over 40 years including large financial corporations, banks, and investment dealers. The information in this newsletter is intended only for informational and educational purposes. It should not be construed as an offer, a solicitation of an offer or sale of any security. Every effort is made to provide accurate and complete information. However, we cannot guarantee that there will be no errors. We make no claims, promises or guarantees about the accuracy, completeness, or adequacy of the contents of this commentary and expressly disclaim liability for errors and omissions in the contents of this commentary. David Chapman will always use his best efforts to ensure the accuracy and timeliness of all information. The reader assumes all risk when trading in securities and David Chapman advises consulting a licensed professional financial advisor or portfolio manager such as Enriched Investing Incorporated before proceeding with any trade or idea presented in this newsletter. David Chapman may own shares in companies mentioned in this newsletter. Before making an investment, prospective investors should review each security’s offering documents which summarize the objectives, fees, expenses and associated risks. Although Artificial Intelligence (AI) may be deployed from time to time, AI output is monitored and adjusted, if necessary, for accuracy. David Chapman shares his ideas and opinions for informational and educational purposes only and expects the reader to perform due diligence before considering a position in any security. That includes consulting with your own licensed professional financial advisor such as Enriched Investing Incorporated. Performance is not guaranteed, values change frequently, and past performance may not be repeated.
About the author


Website: https://www.enrichedinvesting.com
Disclaimer: David Chapman is not a registered advisory service and is not an exempt market dealer (EMD) nor a licensed financial advisor. We do not and cannot give individualised market advice. David Chapman has worked in the financial industry for over 40 years including large financial corporations, banks, and investment dealers. The information in this newsletter is intended only for informational and educational purposes. It should not be considered a solicitation of an offer or sale of any security. The reader assumes all risk when trading in securities and David Chapman advises consulting a licensed professional financial advisor before proceeding with any trade or idea presented in this newsletter. David Chapman may own shares in companies mentioned in this newsletter. We share our ideas and opinions for informational and educational purposes only and expect the reader to perform due diligence before considering a position in any security. That includes consulting with your own licensed professional financial advisor.