Excerpt from this week's: Technical Scoop: Inflation History, Precious Bull, Golden Caveat
CPI and M2 1959–2024 % Annual Change
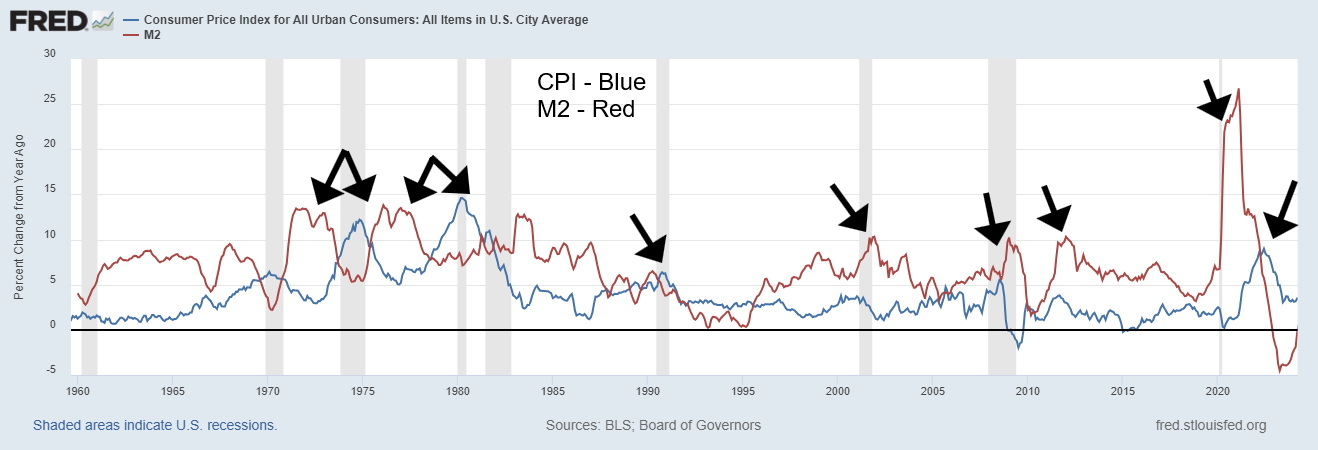
Source: www.stlouisfed.org
Rising inflation is eventually followed by rising interest rates as the monetary authorities try to dampen inflation. But fiscal spending is the responsibility of the treasury. The result is the two can actually work against each other, irrespective of how high the monetary authorities (Fed, BofC, ECB, etc.) hike interest rates to combat inflation. No wonder there are those that say Western economies are on an unsustainable path. In the event of another 2008 financial crisis, we might no longer have bail-outs, but instead bail-ins.
The authorities are trapped as any massive turn-off of the fiscal spigots could result in rising unemployment and falling GDP. It’s how a recession could turn into a depression. Add in the rise of sanctions and trade tariffs that are beginning to predominate, no matter who is in charge, and we could have a deadly combination that sparks a sharp downturn, resulting in falling currencies. Falling currencies of the fiat kind are often accompanied by increased inflation. Nor does it necessarily signal the end of inflation, although inflation did fall and turn negative during the Great Depression.
Gold and inflation are often linked. The correlation is supposed to be that as inflation rises gold rises as well. Gold, is therefore, known as an inflation hedge. Inflation also means a decline in the value of fiat currencies. Gold (and silver) are proven to be money throughout the centuries. But that positive correlation between gold and inflation works best when inflation is rising sharply. When inflation subsides, gold often falls as well. During the inflationary 1970s, as the CPI rose gold rose as well. But from around 1980 to 2001, inflation subsided and gold went through a long period of underperformance. That perked up in the 2000s as inflation picked up and gold once again soared. But once again, when inflation subsided through the 2010s, the price of gold also slumped.
Gold and Inflation 1968–2024
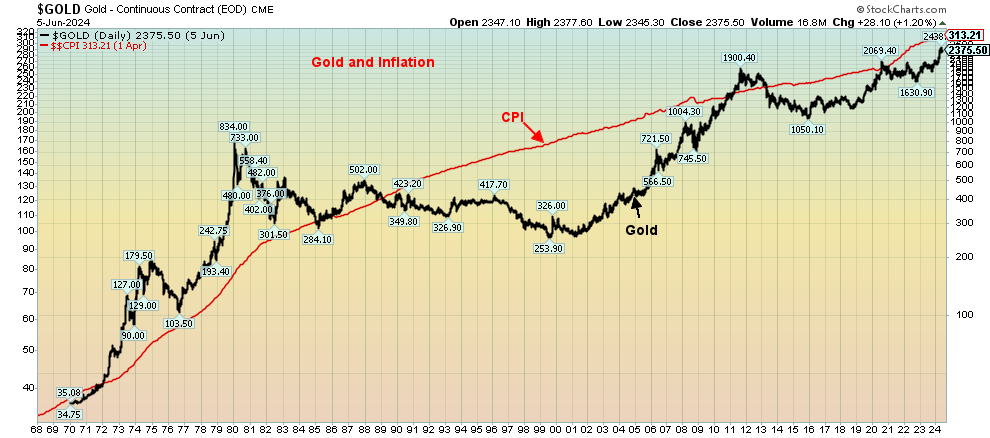
Source: www.stockcharts.com
Gold is also correlated to the debt and money supply. As debt increases and as the money supply increases (M1, M2), gold tends to rise as well. Despite the positive links for gold to inflation, money supply, and debt, the inflation-adjusted price of gold remains below its peak seen in 1980. Gold today would have to rise above $2,700 to equal the highs of 1980 on an inflation-adjusted basis. With silver, the spread is even more as silver would have to rise to $144–$150 to equal the 1980 high. Yet gold has helped maintain purchasing power, even as currencies fall, debt rises, money supply rises, and inflation rises.
It seems strange to note that gold in 1971, before the closing of the gold window, was trading at $42/ounce. Today that would be only $325. Gold today is trading around $2,325. Since 2000, gold has been the best-performing asset (setting aside Bitcoin and cryptos), with a gain of 720%. Closest is silver, up 451%. The S&P 500 is up only 265% and the TSX even less, up 163%. The same holds true from 1970 where gold is up 6,672% vs. the S&P 500 up 5,715%. The big winner, however, is the NASDAQ that has gained 16,426%. Today, gold is under-owned and unloved, except, of course, in Asia or by the central banks—both have been buying gold. For whatever reason, gold does not hold the same cachet in North America as it does in Asia, particularly India and China.
Gold CPI-Adjusted 1970–2024
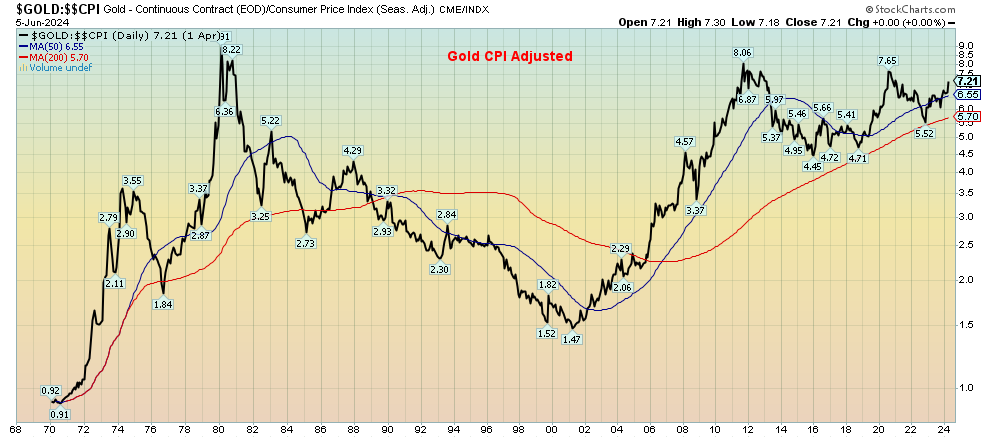
Source: www.stockcharts.com
Gold and Others’ Performance 2000–2024
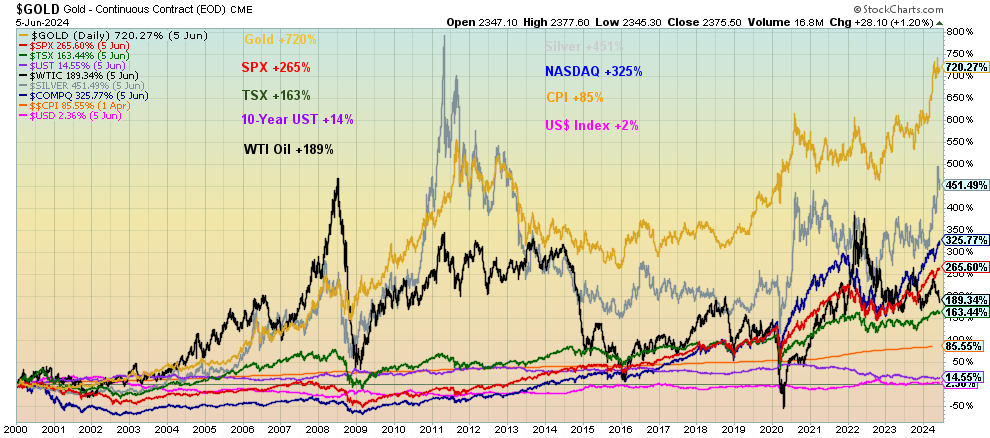
Source: www.stockcharts.com
Western economies have no history of hyperinflation, outside of the previously mentioned hyperinflation that occurred after World War I in Germany and France as well. It is amazing how the German mark went from one mark to purchase one gold mark in 1918 to needing one trillion marks in 1923. No wonder they needed barrels of money just to purchase a loaf of bread. But what was most interesting about the German hyperinflation is that purchasing an ounce of gold in 1918 would have been more than sufficient to maintain purchasing power. Gold is a hedge against inflation. But, as with anything, there is a time to own it and a time not to.
With gold, we are referring to bars, coins, etc. Gold stocks offer leverage, but like all stocks they have their own liability. Eventually the under-owned and more unloved junior resource exploration stocks will wake up. They offer the most leverage to the price of gold (and other commodities). With ongoing deterioration in geopolitics, domestic politics, money printing, debt accumulation, and climate disasters, gold will eventually prove its mettle. And, unlike cryptos, gold is real, not virtual.
Source: www.stockcharts.com
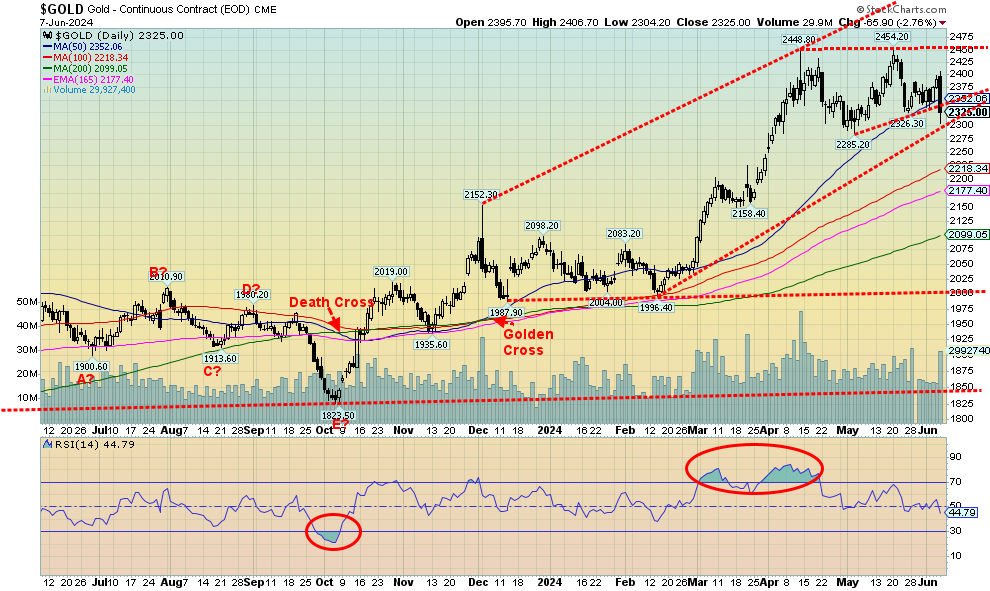
Friday, June 7 almost had the feel of Friday, April 12, 2013. On that day, gold plunged $80. On Monday, April 15, 2013 it got even worse as gold was slaughtered, falling $129. Two days that will live in gold infamy. Two days and gold fell $209. The gold crash of 2013 is etched in gold bugs’ minds. Percentage-wise, the plunge on April 12 was 5%. The two-day plunge was just over 13%. On Friday, June 7 gold fell $65 in the futures market. In the cash market that continued trading after futures closed, gold closed down $83. But the drop in the futures was only 2.8%. Still, it all came as a bit of a shock. In 2013, the market was already sliding and when key support at $1,500/$1,525 gave way it was turned into a rout.
Arguably, the conditions that were present in 2013 are not here today. Friday’s plunge was triggered by the stronger than expected nonfarm payrolls. As a result, bond yields rise and thoughts of a Fed rate cut this coming week went up in smoke. The headline nonfarm might have been have seemed rosy, but a closer examination, as we note in our commentary on the U.S. job numbers, was that the numbers actually revealed rot. The employment level fell by 408,000, making the nonfarm gain of 272,000 seem suspect. Full-time jobs plunged 625,000 while part-time jobs jumped 286,000. The unemployment rate rose. Bond yields did rise Friday, but on the week, they were actually lower. The US$ Index jumped, but ended the week rather flat.
Naturally, a breakdown under $2,300 might send us tumbling further to support near $2,200 or even $2,100. That would still leave gold up on the year, albeit damaged. The thought behind Friday’s plunge was that, given the strong job numbers, a Fed rate cut was off the table and the Fed would not be joining the BofC and the ECB in cutting rates. It’s misplaced, as elsewhere we are seeing signs of a slowing economy. Then there is the astronomical debt, the geopolitical concerns, domestic political dysfunction, and weakening fiat currencies. All are music to gold’s ears.
On the week, gold fell 0.9%, largely because of a strong two-day rally the two previous days to Friday. Silver was dumped under $30, losing 3.3%, while platinum was clobbered, down 6.8%. Of the near precious metals, palladium actually gained, up 1.2%, while copper, which is in increasingly short supply coupled with increased demand, fell 2.6%. The key gold stock indices that were seriously clobbered on Friday ended the week in the red with the Gold Bugs Index (HUI) down 5.8% and the TSX Gold Index (TGD) down 4.0%. The junior exploration stocks that are already under-owned and unloved remained in that sorry state.
We’ve continually noted that gold is typically weak in May/June. This year appears to be no exception. The question is, when will it bottom and how low will we go? A bottom could be formed as early as this coming week, but we suspect no later than the first week of July. Gold could still fall further to no worse than $2,100, but a test under $2,300 would not be surprising. Silver has plunged under $30, the previous breakout point, but as a worst case we believe $28 should hold. Gold needs to regain $2,400 to suggest a low is in and silver above $32.
Cycles remain positive. The last major low was October 2022 at $1,618. That low fit well with our 7.8-year cycle (+/- 8 months) that previously bottomed in December 2015. The cycle turned up when gold broke above $2,100 the previous high. If that is correct, then the next cycle low is not due until sometime in 2029–2031. A shorter 31-month cycle saw a low in August 2018 which was 32 months from the December 2015 low. The next low of significance was a possible double bottom low in March 2021 and August 2021 (31 months and 36 months from the 2018 low). Yes, the October 2022 low was even lower, but instead that may have been a half-cycle low. Using the 2021 lows, the next 31-month cycle low is due October 2023. Sure enough, there was a low that month. We may have already seen our 31-month cycle low. The next one isn’t due until around May 2026.
Gold closed under the 50-day MA on Friday. As noted, there is trendline support at $2,300, but the 100-day MA support is down closer to $2,200. If we break $2,300, then the odds increase that we could test $2,200. Silver confirmed a breakout when it closed over $30. So, this appears to be test of the breakout zone. But a test of the 50-day MA near $28.70 can’t be ruled out. The gold stock indices need to see the HUI break above 300 and the TGD above 340 to suggest we are headed higher. The HUI is showing support at 260, but next good support doesn’t come until 250. Similarly, the TGD is testing support at 310, but next good support doesn’t come in until 290. The miserable junior gold mining exploration stocks continue to overwhelmed by preferred speculation in cryptos as funds pour into the Bitcoin ETF. Yet many of these juniors are undervalued, given their potential and resources. Majors need new product and many of the juniors are potential takeover targets, but at much higher prices.
Oil continues to be somewhat oversupplied, despite continued cuts by OPEC+. Russia is finding ways of getting its oil to market. The ECB rate cut helped, but Friday’s nonfarm helped dampen thoughts of the Fed following until at least September. On the week, WTI oil fell 1.9% and Brent crude was down 2.7%. Natural gas
(NG) continues to be positive as we go into the summer with NG at the Henry Hub gaining 12.7% as the EU NG at the Dutch Hub fell 4.1%. The energy stocks had a poor week, with the ARCA Oil & Gas Index (XOI) down 4.0% and the TSX Energy Index (TEN) off 5.9%. Seasonally, oil tends to be weak as we move into summer.
Read the full report: Technical Scoop: Inflation History, Precious Bull, Golden Caveat
Disclaimer
David Chapman is not a registered advisory service and is not an exempt market dealer (EMD) nor a licensed financial advisor. He does not and cannot give individualised market advice. David Chapman has worked in the financial industry for over 40 years including large financial corporations, banks, and investment dealers. The information in this newsletter is intended only for informational and educational purposes. It should not be construed as an offer, a solicitation of an offer or sale of any security. Every effort is made to provide accurate and complete information. However, we cannot guarantee that there will be no errors. We make no claims, promises or guarantees about the accuracy, completeness, or adequacy of the contents of this commentary and expressly disclaim liability for errors and omissions in the contents of this commentary. David Chapman will always use his best efforts to ensure the accuracy and timeliness of all information. The reader assumes all risk when trading in securities and David Chapman advises consulting a licensed professional financial advisor or portfolio manager such as Enriched Investing Incorporated before proceeding with any trade or idea presented in this newsletter. David Chapman may own shares in companies mentioned in this newsletter. Before making an investment, prospective investors should review each security’s offering documents which summarize the objectives, fees, expenses and associated risks. David Chapman shares his ideas and opinions for informational and educational purposes only and expects the reader to perform due diligence before considering a position in any security. That includes consulting with your own licensed professional financial advisor such as Enriched Investing Incorporated. Performance is not guaranteed, values change frequently, and past performance may not be repeated.
About the author


Website: https://www.enrichedinvesting.com
Disclaimer: David Chapman is not a registered advisory service and is not an exempt market dealer (EMD) nor a licensed financial advisor. We do not and cannot give individualised market advice. David Chapman has worked in the financial industry for over 40 years including large financial corporations, banks, and investment dealers. The information in this newsletter is intended only for informational and educational purposes. It should not be considered a solicitation of an offer or sale of any security. The reader assumes all risk when trading in securities and David Chapman advises consulting a licensed professional financial advisor before proceeding with any trade or idea presented in this newsletter. David Chapman may own shares in companies mentioned in this newsletter. We share our ideas and opinions for informational and educational purposes only and expect the reader to perform due diligence before considering a position in any security. That includes consulting with your own licensed professional financial advisor.