Source: www.stockcharts.com
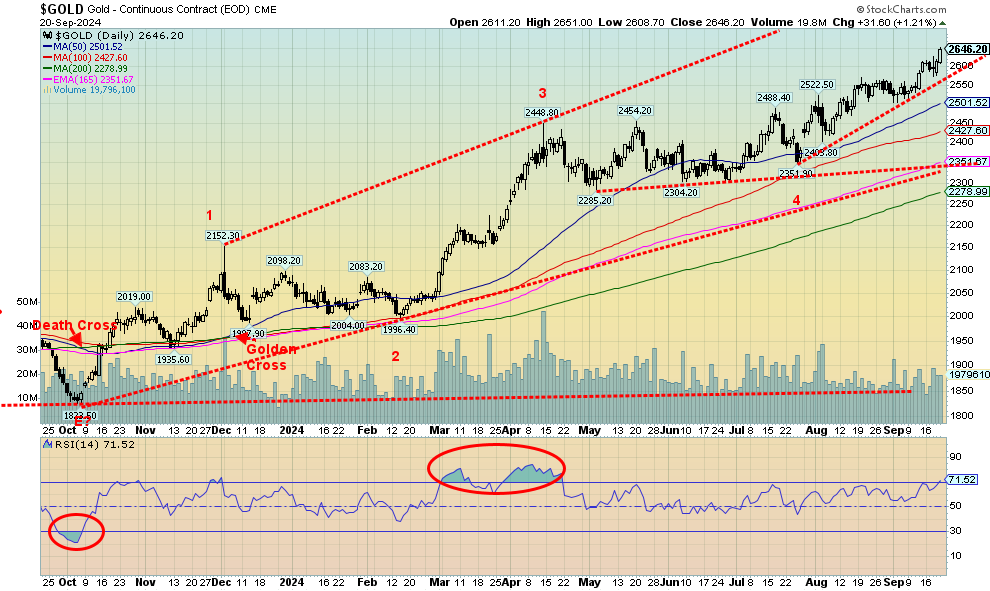
Gold has responded positively to the Fed rate cut. The cut helped lower the US$ Index, which is positive for gold. The result was gold soared to another new all-time high, closing at $2,646. $2,700 is on the radar. Nothing like an aggressive rate cut by the Fed to get things going. But the gain on the week was only about 1.4%. Silver also rose about 1.4%. However, platinum continues its woes, losing 2.5%, and is down 4.0% on the year compared to gold, up 27.7%, and silver, up 30.8%. Copper gained 2.5% and appears to once again be breaking out. We saw up moves on a number of copper-based stocks this past week.
Other reasons gold is pushing higher are the escalation of the wars between Russia/Ukraine and Israel/Hamas/Hezbollah, Houthis and, indirectly, Iran and Syria. Economist Martin Armstrong (www.armstrongeconomics.com) reported on his private blog that a munitions dump north of Moscow was hit using British-made, long-range missiles that may have contained nuclear components because of the huge hole they left. This is not verified, but does highlight the potential for a major escalation in that war. In the Middle East there is very little sign that the sides are even talking. Peace is further away than ever, given the attacks against Hezbollah this past week. Gold is a geopolitical safe haven.
Domestically, it is the same, as violence is rising as we get closer to the election, an election sure to be challenged if Trump loses and possibly as well if Harris loses. Neither side has even the remotest of will to talk to each other. Talk of clashes between the sides is also dominating the discussion. The assassination attempts against Trump also highlight the gravity of the situation. Gold is a safe haven from domestic politics as well.
Finally, as we have noted before, central bank buying of gold continues as they try to exit U.S. treasuries. The U.S.’s thoughts of moving $300 billion of seized Russian assets to Ukraine has made numerous countries nervous, prompting the purchase of gold. Russia is also doing business in gold rather than in U.S. dollars since they have been removed from SWIFT. That allows Russia to continue trade and avoid sanctions.
The gain this year for gold is the largest since 2010, yet we see few signs, if any, that gold has topped. The RSI has risen into overbought territory, but we’ve seen in the past that this condition can remain longer than the shorts can stay solvent in a strong market. Forecasts are for gold to hit $2,700 by January 2025, possibly sooner. The massive cup and handle pattern that formed between 2011 and earlier this year projects up to at $3,100–$3,200. If that level was taken out, the next stop could be $3,800.
Downside under $2,450 could suggest further losses, but under $2,300 would suggest that the rally is over. The reasons for holding gold continue to pile up. Yet gold today remains very under-owned, especially in North America. The biggest fear is governments putting controls on gold, as gold moving higher shows a lack of confidence in governments. We continue to see higher prices ahead accompanied by periodic sharp pullbacks.
Source: www.stockcharts.com
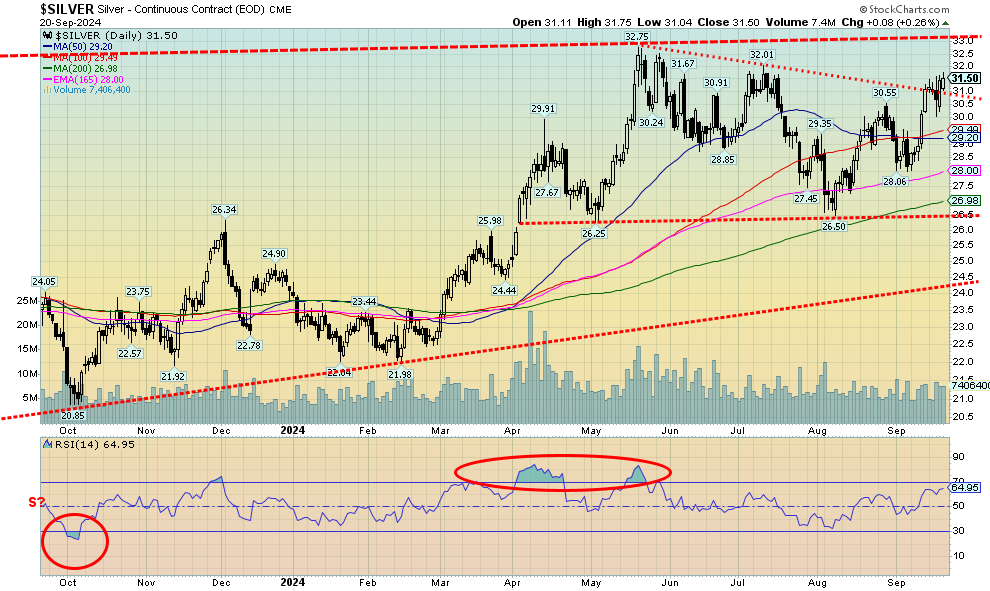
When bullion rises, who leads? It should be silver. But silver also leads to the downside. The much-despised gold/silver ratio is still extremely high, at a too-high level that is currently 84. It peaked at 127 during the height of the pandemic. In 2011, at the top of the market for gold and silver, the ratio was about 31. The all-time low was 15.6, but that was way back in 1980. Today, silver would need to be at $169 to reach that level. We have a long way to go. Even the most recent lows of 64 in 2021 and 73 in July 2024 are a way away. Silver did not lead this past week, but at least it tied gold’s gains of about 1.4%. We appear to be breaking that downtrend line from the May top. The close at $31.50 does suggest we should take out the July top with potential targets up to at least $37 and possibly up to $40. Support is now at $30, but a breakdown under $26.50 would be highly negative with the first warning sign at $28.
Source: www.stockcharts.com
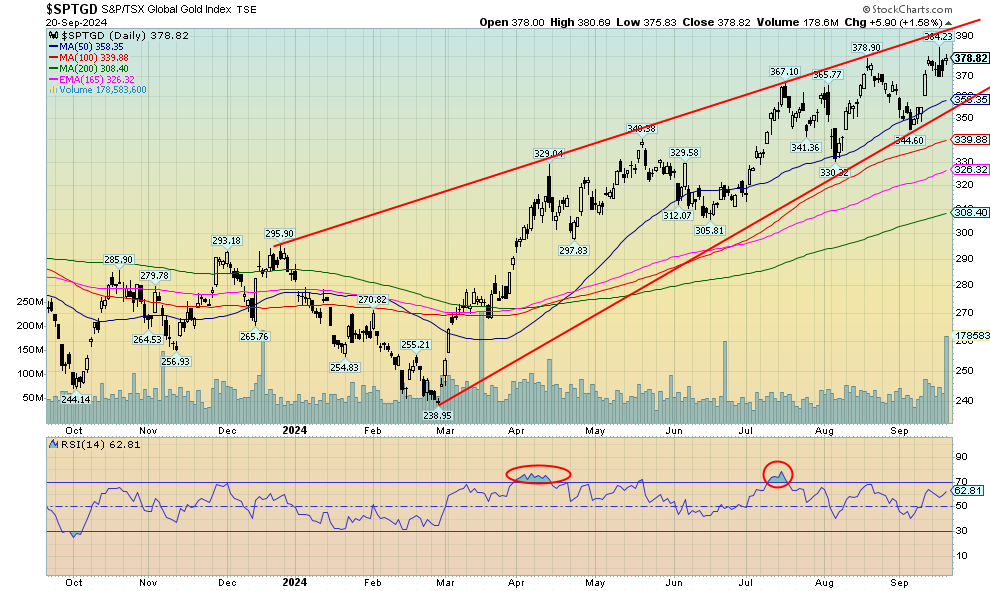
Gold stocks continue to climb, although the pace this past week was no doubt painfully slow for many gold bugs. Still, we once again made 52-week highs so there were some positives. On the week, the TSX Gold Index (TGD) rose just under 0.3% while the Gold Bugs Index (HUI) was up a feeble 0.05% or generously rounded to 0.1%. We remain well between the rising channel that looks a bit like an ascending wedge (bearish) triangle. The top of the channel is up around 390/400. The breakout from a huge symmetrical triangle in July 2024 with the start of the triangle dating back to 2015 is projected to send the TGD to new record highs at 600–650. The high of the past few years is at 416, set in July 2020, but we are getting close to that one. The all-time high was 455, set back in 2011. We are already through the point that suggests to us that we should see new all-time highs over 455. The TGD currently is down almost 17% from its all-time highs. That’s much better than the HUI, which remains down 49% from its all-time high. Different components account for the difference. The RSI is only at 63, so it has considerable room to move higher before becoming overbought. We expect to see the July 2020 high taken out on this move. Below 350 is a support zone, but under that the correction could be deeper.
Read the FULL report here: Technical Scoop: Positive Curve, Low Inflation, Precious Safety
Disclaimer
David Chapman is not a registered advisory service and is not an exempt market dealer (EMD) nor a licensed financial advisor. He does not and cannot give individualised market advice. David Chapman has worked in the financial industry for over 40 years including large financial corporations, banks, and investment dealers. The information in this newsletter is intended only for informational and educational purposes. It should not be construed as an offer, a solicitation of an offer or sale of any security. Every effort is made to provide accurate and complete information. However, we cannot guarantee that there will be no errors. We make no claims, promises or guarantees about the accuracy, completeness, or adequacy of the contents of this commentary and expressly disclaim liability for errors and omissions in the contents of this commentary. David Chapman will always use his best efforts to ensure the accuracy and timeliness of all information. The reader assumes all risk when trading in securities and David Chapman advises consulting a licensed professional financial advisor or portfolio manager such as Enriched Investing Incorporated before proceeding with any trade or idea presented in this newsletter. David Chapman may own shares in companies mentioned in this newsletter. Before making an investment, prospective investors should review each security’s offering documents which summarize the objectives, fees, expenses and associated risks. David Chapman shares his ideas and opinions for informational and educational purposes only and expects the reader to perform due diligence before considering a position in any security. That includes consulting with your own licensed professional financial advisor such as Enriched Investing Incorporated. Performance is not guaranteed, values change frequently, and past performance may not be repeated.
About the author


Website: https://www.enrichedinvesting.com
Disclaimer: David Chapman is not a registered advisory service and is not an exempt market dealer (EMD) nor a licensed financial advisor. We do not and cannot give individualised market advice. David Chapman has worked in the financial industry for over 40 years including large financial corporations, banks, and investment dealers. The information in this newsletter is intended only for informational and educational purposes. It should not be considered a solicitation of an offer or sale of any security. The reader assumes all risk when trading in securities and David Chapman advises consulting a licensed professional financial advisor before proceeding with any trade or idea presented in this newsletter. David Chapman may own shares in companies mentioned in this newsletter. We share our ideas and opinions for informational and educational purposes only and expect the reader to perform due diligence before considering a position in any security. That includes consulting with your own licensed professional financial advisor.