Excerpt from this week's: Technical Scoop: Possible Trap, Gold Falter, Oil Fall
Source: www.stockcharts.com
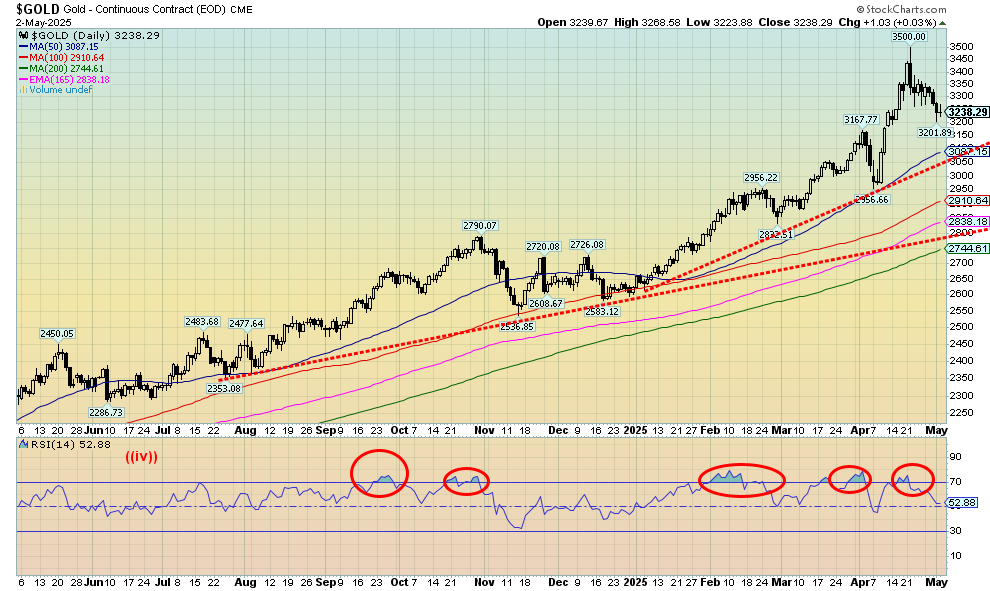
Is gold topping? Hardly. Despite the recent pullback, there was no sign of a potential major top at the recent at $3,500. This is a setback only. We’d need to see a steeper decline of at least up to 20% to suggest to us that we may have made a significant top. The decline so far is about 7.5%. The pause in the tariff wars helped propel the stock market higher and gold lower. However, the need for a safe haven remains because geopolitical tensions, economic uncertainty, and loss of faith in government have not gone away. Strong buying is still being seen by central banks. And—dare we mention it—there has been strong buying from Costco, of all places. We could interpret that two ways: bullish because they are buying, or bearish because retail is buying and retail is always wrong at the top.
For now, we’ll take the bullish. The stronger than expected job numbers oddly helped gold recover this past week. Nonetheless, a somewhat strong US$ Index helped push gold prices lower. Strong job numbers suggest that interest rates should remain at least at current levels. While consumer sentiment is sinking, consumer expectations of rising inflation are also present.
On the week, gold fell 2.0%. It was the second consecutive weekly decline and gold is now down 7.5% from the recent high. Corrections in a bull market are not unusal. Silver didn’t fare as well, falling 3.0%. Platinum did better, off 0.6%. The near precious metals, along with other commodities, fared better as palladium rose 3.2% although copper fell 3.9%. The gold stocks fell as the Gold Bugs Index (HUI) was off 3.2% and the TSX Gold Index (TGD) fell 3.8%.
Near term, we remain cautious about gold. We are in a typically weak season for gold with bottoms seen anywhere from May to July, even August, before another upleg gets underway. We don’t want to put any levels where or when we might bottom. Right now we have support down to around $3,100, but below that we could fall to $2,800. However, there is no sign that could happen. We didn’t like that outside day reversal that happened on April 22. Technically, it was a key reversal with a higher, record high, a lower low, and a close below the previous day. For this reason, we suspect the gold correction could play out over the next month or two before a new upleg gets underway. Silver and the gold stock indices did not have a potential key reversal days as did gold. As we noted, we believe all this tariff pause, strong job numbers, and strong US$ Index will eventually dissipate and a new upleg for gold could get underway.
Source: www.stockcharts.com
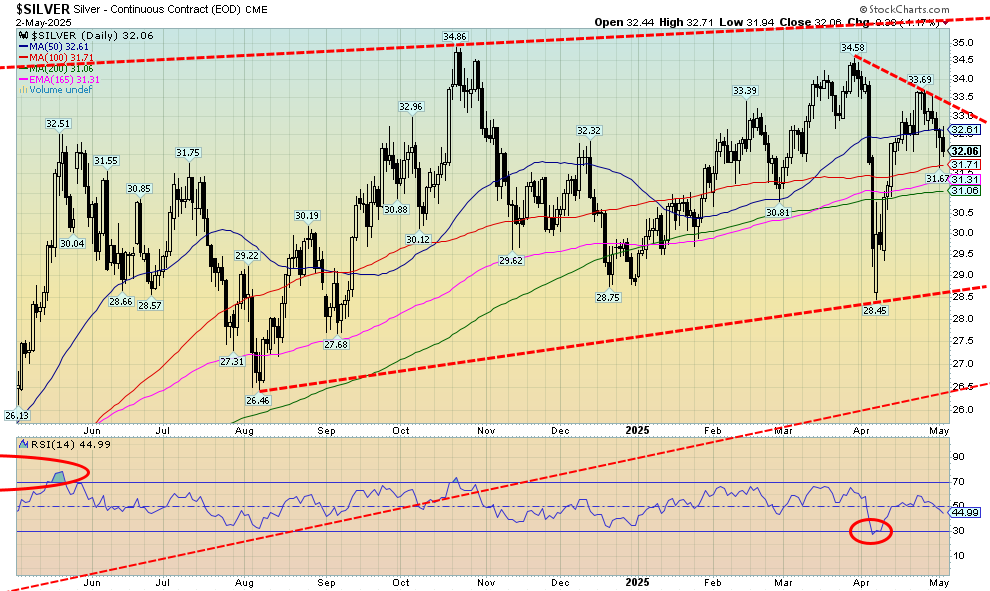
Silver’s action continues to frustrate. Just as we thought silver might get something going, this past week once again put a damper on things. We failed to make new highs even as gold did. We don’t like divergences. We couldn’t even get over the recent high at $34.58, let alone the October high of $34.86. Breaking over $35 remains elusive. Given the slope of the resistance line, we need to break out over $36 now. New highs are not enough. We need firm new highs. Silver fell this past week by 3.0% vs. gold’s 2.0%. Silver bugs are ready to throw in the towel. But that may be the catalyst to help silver reach new levels. There is a noted shortage of silver. But it doesn’t seem to be impacting the price which remains somewhat depressed.
Support for silver is down to around $31. We’d prefer the zone to hold. Otherwise, we could be looking at a drop to better support at $29. Below that level we’d declare any silver bull move over. The current bull market had its start in February 2022 and since then we are up about 83%. That’s good, but when compared to gold it’s not so good. Gold is up 104% in the same time period. Nonetheless, we’d have to break under $21.60 to suggest new lows below that 2022 level.
On a positive note, the action over the past year appears to be an upward-sloping triangular pattern. If that’s correct, it is an ascending triangle, which is bullish. We just need to break free, preferably now over $36. If that is correct, then potential targets are up to $44. Ascending triangles have rising lows and a relatively flat top.
Source: www.stockcharts.com
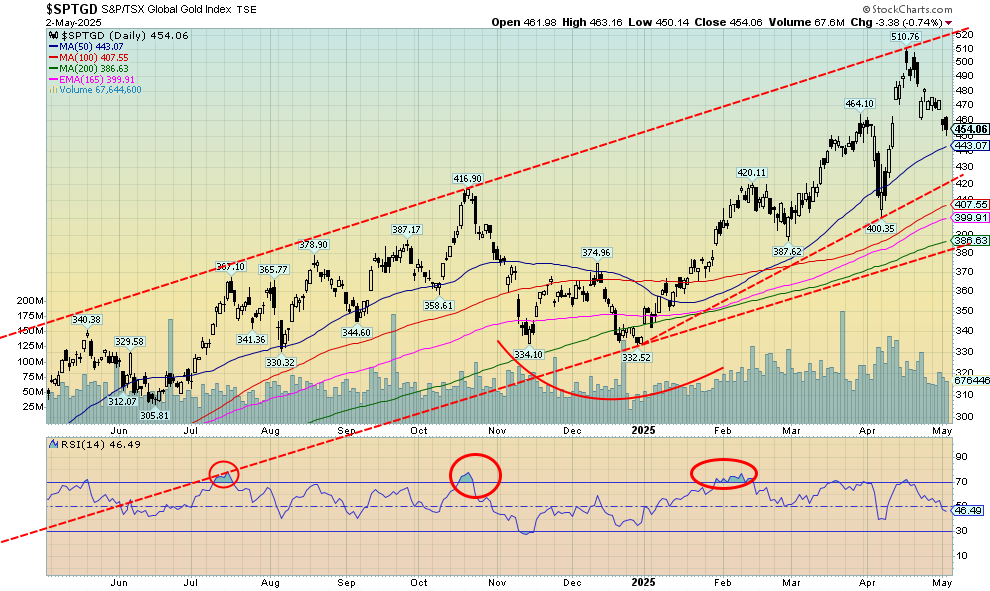
The gold stocks have fallen into correction territory with this week’s action. The Toronto Gold Index (TGD) was down 3.8% on the week and is now down 11.1% from the recent high. The Gold Bugs Index (HUI) fell 3.2% and is down 9.4% from its high, technically just shy of correction territory. That’s the bad news. The good news is that the TGD remains up 34.9% on the year and the HUI up 36.7%. Gold stocks have been the best performer so far in 2025.
For the TGD, we are approaching support near 440/443 and below that support is seen at 430. Major support is way down at 380/390. We could in theory test that level and, even if we did, the bull market would still be
intact. During the 2008–2011 run-up for gold and gold stocks, there were four corrections of 10% or more on their way to an overall gain of over 200%. Gold stocks can be volatile, mostly because they are thinner, so ups and downs can be exagerated; hence, periods of quite overbought or oversold. Note earlier in October/December the TGD fell 20.3% but still held an uptrend. Given our bullish stance on gold, we expect that this pullback could present another buying opportunity.
Note: we are up 90% from a low in February 2024, highlighting the strong performance from the sector
Read the FULL report here: Technical Scoop: Possible Trap, Gold Falter, Oil Fall
Disclaimer
David Chapman is not a registered advisory service and is not an exempt market dealer (EMD) nor a licensed financial advisor. He does not and cannot give individualised market advice. David Chapman has worked in the financial industry for over 40 years including large financial corporations, banks, and investment dealers. The information in this newsletter is intended only for informational and educational purposes. It should not be construed as an offer, a solicitation of an offer or sale of any security. Every effort is made to provide accurate and complete information. However, we cannot guarantee that there will be no errors. We make no claims, promises or guarantees about the accuracy, completeness, or adequacy of the contents of this commentary and expressly disclaim liability for errors and omissions in the contents of this commentary. David Chapman will always use his best efforts to ensure the accuracy and timeliness of all information. The reader assumes all risk when trading in securities and David Chapman advises consulting a licensed professional financial advisor or portfolio manager such as Enriched Investing Incorporated before proceeding with any trade or idea presented in this newsletter. David Chapman may own shares in companies mentioned in this newsletter. Before making an investment, prospective investors should review each security’s offering documents which summarize the objectives, fees, expenses and associated risks. David Chapman shares his ideas and opinions for informational and educational purposes only and expects the reader to perform due diligence before considering a position in any security. That includes consulting with your own licensed professional financial advisor such as Enriched Investing Incorporated. Performance is not guaranteed, values change frequently, and past performance may not be repeated.
About the author


Website: https://www.enrichedinvesting.com
Disclaimer: David Chapman is not a registered advisory service and is not an exempt market dealer (EMD) nor a licensed financial advisor. We do not and cannot give individualised market advice. David Chapman has worked in the financial industry for over 40 years including large financial corporations, banks, and investment dealers. The information in this newsletter is intended only for informational and educational purposes. It should not be considered a solicitation of an offer or sale of any security. The reader assumes all risk when trading in securities and David Chapman advises consulting a licensed professional financial advisor before proceeding with any trade or idea presented in this newsletter. David Chapman may own shares in companies mentioned in this newsletter. We share our ideas and opinions for informational and educational purposes only and expect the reader to perform due diligence before considering a position in any security. That includes consulting with your own licensed professional financial advisor.