Excerpt from this week's: Technical Scoop: Precious Cheapness, Cut Expectation, Oil Rest

Source: www.stockcharts.com
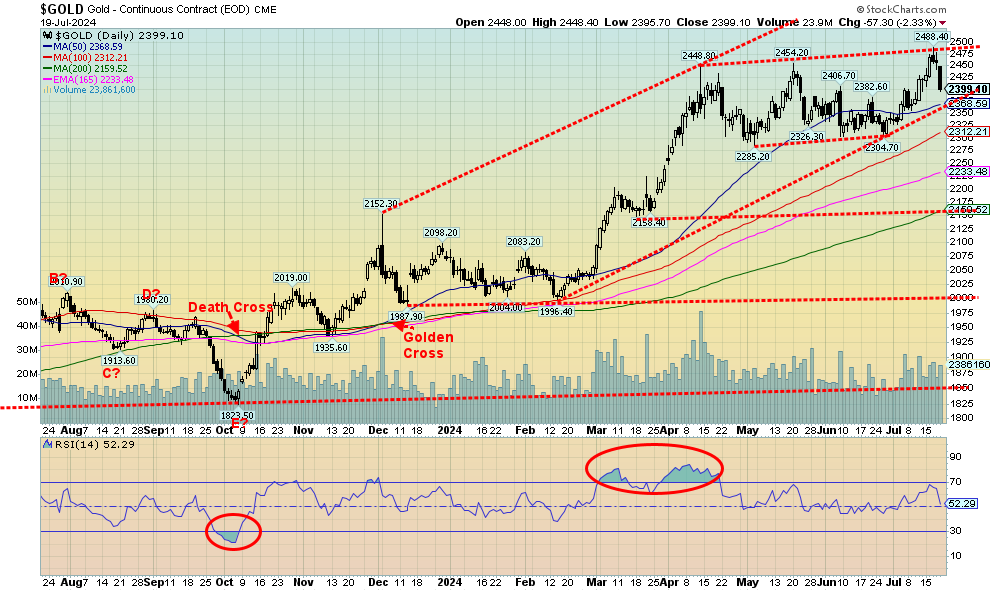
It was not a very good week for gold. However, the other precious metals fared even worse. Gold fell 0.9% after once again making new all-time highs to $2,488. But that was the good news. Silver fell 6.0% and platinum was down 3.9%, while the near precious metals saw palladium drop 7.2% and copper get killed, down 7.6%. But, surprisingly, the gold stocks held in (a positive sign) as the ARCA Gold Bugs Index (HUI) fell 1.5% while the TSX Gold Index (TGD) dropped 0.8%. The drop for the precious metals was not friendly, but the fact the gold stocks generally held in is encouraging, suggesting that this may be nothing more than a needed correction to end overbought levels. Gold never really was overbought as the RSI hovered near 70. Now it is a neutral 52.
The news was not all bad. We learned hedge funds are making larger wagers that gold prices could rise. Given what they see as political and economic uncertainty, they have their highest holdings in gold in four years. Many are expecting a September Fed cut. The Hedgies cited both domestic and geopolitical risk as a reason to hold gold. On the geopolitical side, they cited sanctions and the conflicts with both China and Russia, two very large gold producers. China is the world’s largest producer but Australia has the largest reserves. However, both China’s central bank and Russia’s central bank have been steady buyers of gold to shore up their currency while dumping U.S. treasury securities. Russia has none now and China’s keeps falling. They, along with the BRICS, are challenging the U.S. dollar as the world’s reserve currency and U.S. dollar global hegemony.
What’s concerning is that gold made new all-time highs, then reversed and closed lower on the week. But it appears to us as a normal reversal week and not a key one. For that we’d have to have taken out the previous week’s low and close under that level. We have decent support down to $2,350, then to $2,300 levels which we can’t rule out. We wouldn’t want to see a breakdown under $2,300 as that could imply even lower prices with potential targets down to $2,150. The 200-day MA is currently around $2,160. We doubt that would happen, but it’s something to keep in mind. New highs would set us on the upward track once again and potential targets are now up to $2,600. After making that high in April at $2,488, gold has been correcting. It’s possible it is a five-wave structure as in ABCDE. If so, then this should be the E wave. Since the D wave made new highs again, it suggests the E wave could be short and we hold $2,300. Hence, that’s why we don’t want to see a breakdown under $2,300.
The commercial COT is an uninspiring 22%, but when we add options traders, it jumps to 29%. It seems the options traders are more positive than futures dealers. We remain long-term bullish on gold but await completion of the current correction.

Source: www.stockcharts.com
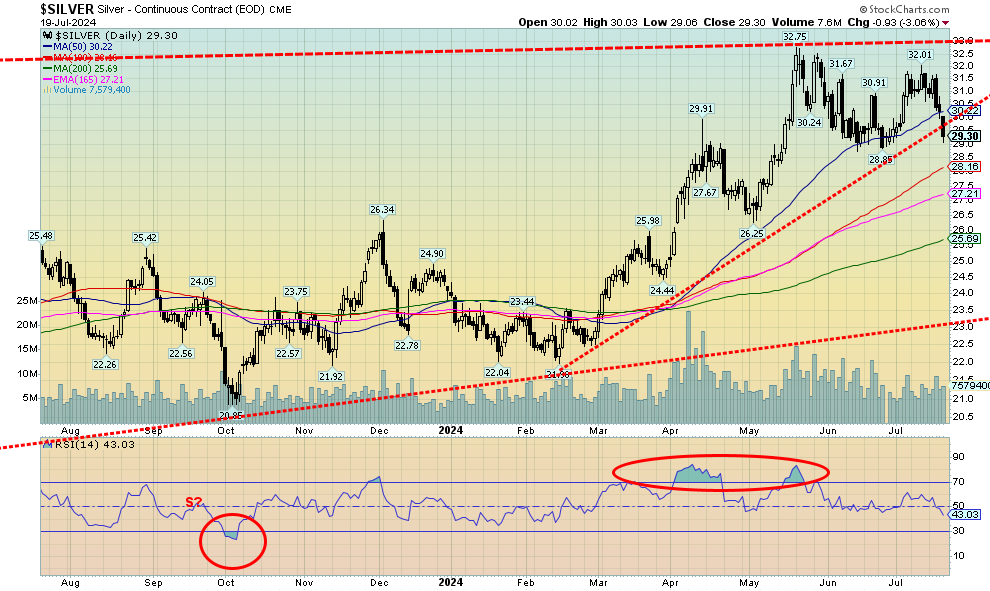
Silver had a bad week. It plunged, down almost 6% and dropping below $30 once again. That’s the bad news. The good news is it held for the moment above $29. We had noted that while gold was going up, making new all-time highs, silver wasn’t even making new 52-week highs. Yes, gold sold off this past week but silver sold off more. That’s odd when there are silver shortages. Silver tends to lead in both up and down markets. Is silver signaling that we are about to have a steeper drop?
That’s hard to say when the signals are mixed. As noted next, the gold stocks held in well this past week despite the big drop in silver. A check of silver stocks showed that while down they weren’t killed. Pan American Silver (PAAS/TSX), a large silver mining company, fell 4.3%, less than what silver itself fell. We prefer to view that positively. However, we do need to heed silver’s performance this past week. It broke an uptrend. It’s near $29 and below $29 good support comes in at $28.50. But if we broke under $28, then we could fall all the way back to $26 and test under that level. Note the 200-day MA is currently at $25.69. Could it be a target. Very long-term support is down at $23, a level we are not expecting to see on this pullback. A potential swing-down target, however, could be seen. That’s based on the recent high and low, and a break under the recent low of $28.89 could suggest a fall to $25.77. And that is roughly where the 200-day MA is. New highs above $32 would reset us higher. But we now need to break over $33 to suggest we are on our way to targets up around $39/$40. The silver commercial COT remains a concern at 22%. Add in options and the commercial COT is 27%. Not high.

Source: www.stockcharts.com
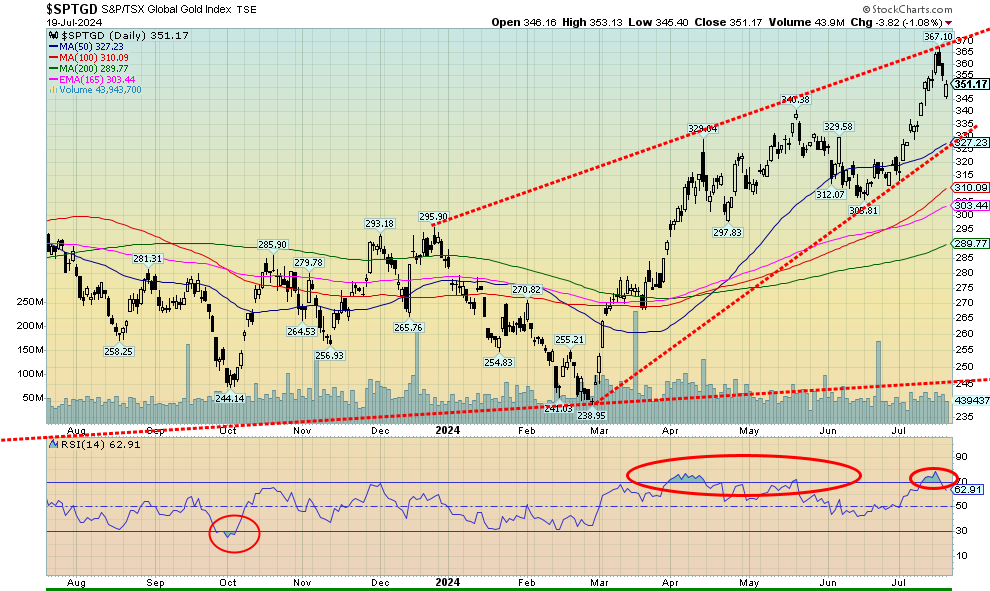
A bad week for gold and silver means a bad week for the gold stocks. Okay, they were down, but they didn’t get killed. Indeed, Friday started out quite weak for the gold stock indices, given the $40+ drop in gold prices, but by the end of the day they had recouped. On the week, the TSX Gold Index (TGD) fell 0.8% while the Gold Bugs Index (HUI) dropped 1.5%. The overbought conditions that were prevalent have eased and the RSI for the TGD is down at 63 from highs over 70. To us, this pullback appears normal and the fact that the gold stocks were not hit too hard on Friday suggests to us strength. If that’s correct, we should regroup and move to higher highs. Indeed, the TGD and the HUI made 52-week highs this past week, the second week in a row. But, of course, after making new highs they reversed and closed lower. However, so far it appears as a normal reversal and did not give us any sell signals. We have good support down to 330 for the TGD, with interim support near 340. A breakdown under 330 would be of bigger concern and could suggest a fall to 290/300. We may have a pattern that appears as an ascending wedge; however, there also appears to be sufficient room to rise further into the wedge. Expect some further consolidation but heed the warning on a break under 330. We prefer to hold that level.
Read the full report here: Technical Scoop: Precious Cheapness, Cut Expectation, Oil Rest
Disclaimer
David Chapman is not a registered advisory service and is not an exempt market dealer (EMD) nor a licensed financial advisor. He does not and cannot give individualised market advice. David Chapman has worked in the financial industry for over 40 years including large financial corporations, banks, and investment dealers. The information in this newsletter is intended only for informational and educational purposes. It should not be construed as an offer, a solicitation of an offer or sale of any security. Every effort is made to provide accurate and complete information. However, we cannot guarantee that there will be no errors. We make no claims, promises or guarantees about the accuracy, completeness, or adequacy of the contents of this commentary and expressly disclaim liability for errors and omissions in the contents of this commentary. David Chapman will always use his best efforts to ensure the accuracy and timeliness of all information. The reader assumes all risk when trading in securities and David Chapman advises consulting a licensed professional financial advisor or portfolio manager such as Enriched Investing Incorporated before proceeding with any trade or idea presented in this newsletter. David Chapman may own shares in companies mentioned in this newsletter. Before making an investment, prospective investors should review each security’s offering documents which summarize the objectives, fees, expenses and associated risks. David Chapman shares his ideas and opinions for informational and educational purposes only and expects the reader to perform due diligence before considering a position in any security. That includes consulting with your own licensed professional financial advisor such as Enriched Investing Incorporated. Performance is not guaranteed, values change frequently, and past performance may not be repeated.


