Source: www.stockcharts.com
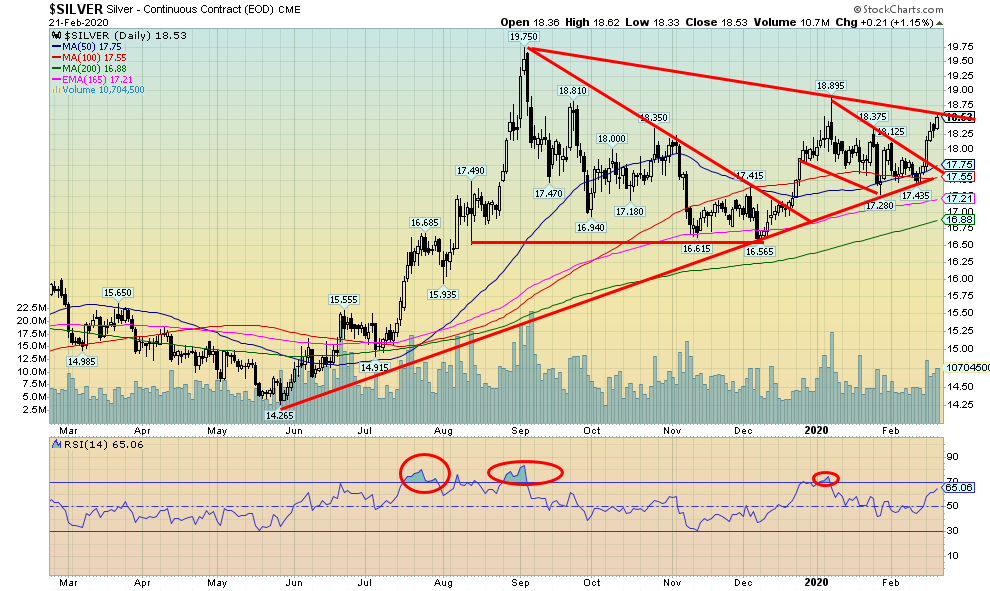
Silver finally showed some spark with a solid 4.5% gain this past week. With an RSI still under overbought levels at 70 silver could have further to run. Our only concern, as we note below, is that while gold is making new 52-week highs silver is not. Silver is still suggesting that it could hit potential targets up to $20.30/$20.50 based on the triangle that formed August to December 2019. The flag formation that formed in January/February 2020 suggests targets of $19.40/$19.50. Once silver breaks over $18.60 we could also have potential targets up to $21.80. Some words of caution are that besides silver lagging gold the commercial COT for silver is sliding further as well. Nonetheless, the action was positive this past week for silver and we should see higher prices this coming week. There is some resistance at $18.90 and again up to the August 2019 high of $19.75.
Source: www.cotpricecharts.com
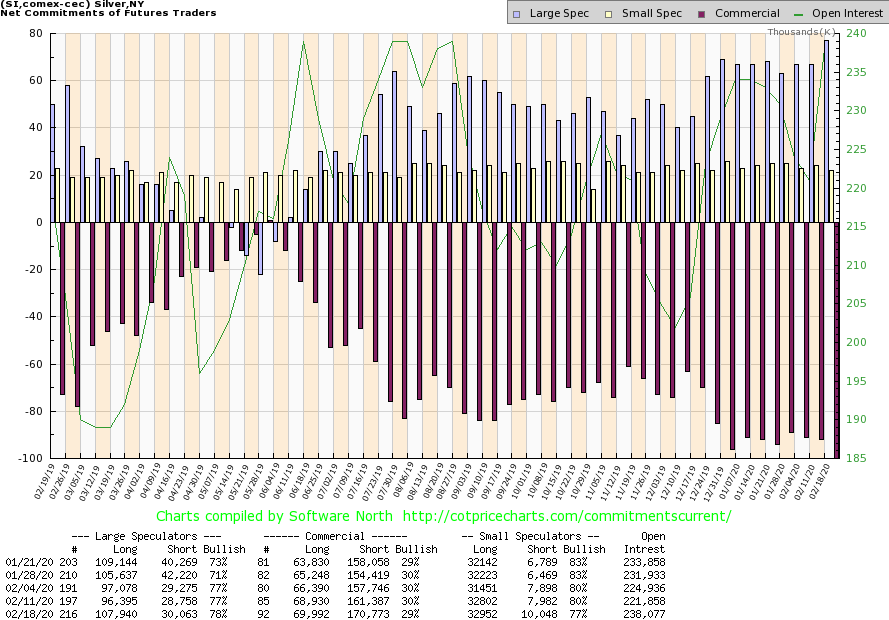
Just as the gold commercial COT fell, so did the silver commercial COT, falling to 29% from 30%. Long open interest rose about 1,000 contracts while short open interest jumped just over 9,000 contracts. The large speculators COT rose to 78% from 77%. Like the gold COT, the silver COT is also bearish. So we have to keep this in mind as gold and silver rise in price.
Source: www.stockcharts.com
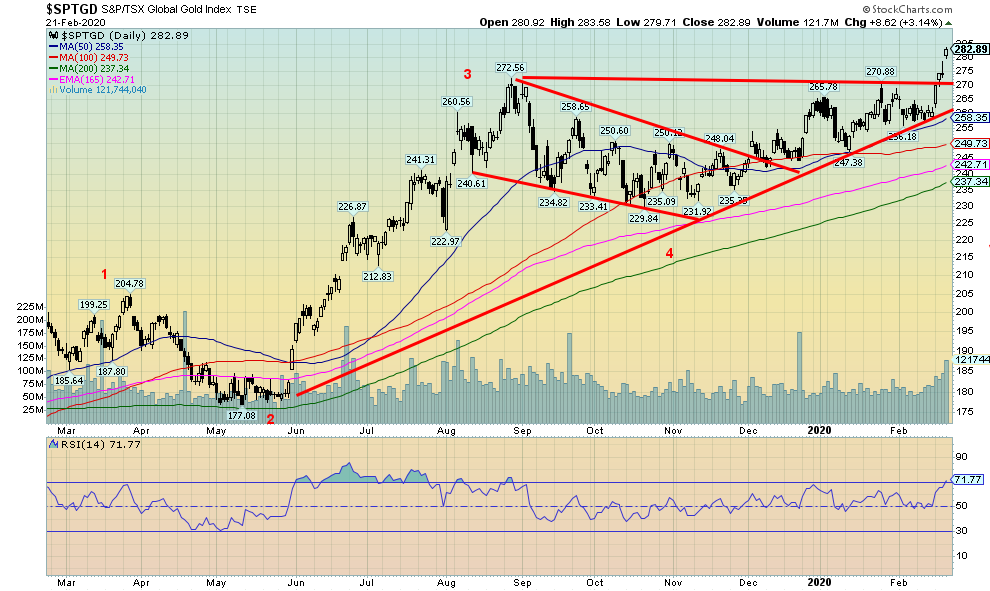
Gold stocks went gangbusters this past week with both the TSX Gold Index (TGD) and the Gold Bugs Index (HUI) showing substantial gains and both hitting new 52-week highs. The TGD gained 8.7% on the week and is now up 8.3% on the year while the HUI jumped 10.8% on the week and finally is in the black for the year, up 3.2%. The rising triangular pattern that formed on the TGD suggests potential targets up to 312/315, another 10% gain from current levels. As we noted with gold, some prudent profit-taking is suggested. The RSI on the TGD is just over 70 but it can, as it has in the past, get much higher before profit-taking kicks in. The breakout this past week over 270 came on increased volume, suggesting that this move should have some legs. But stops are prudent. For the TGD the reversal point would come with a break back under 258.
Source: www.stockcharts.com
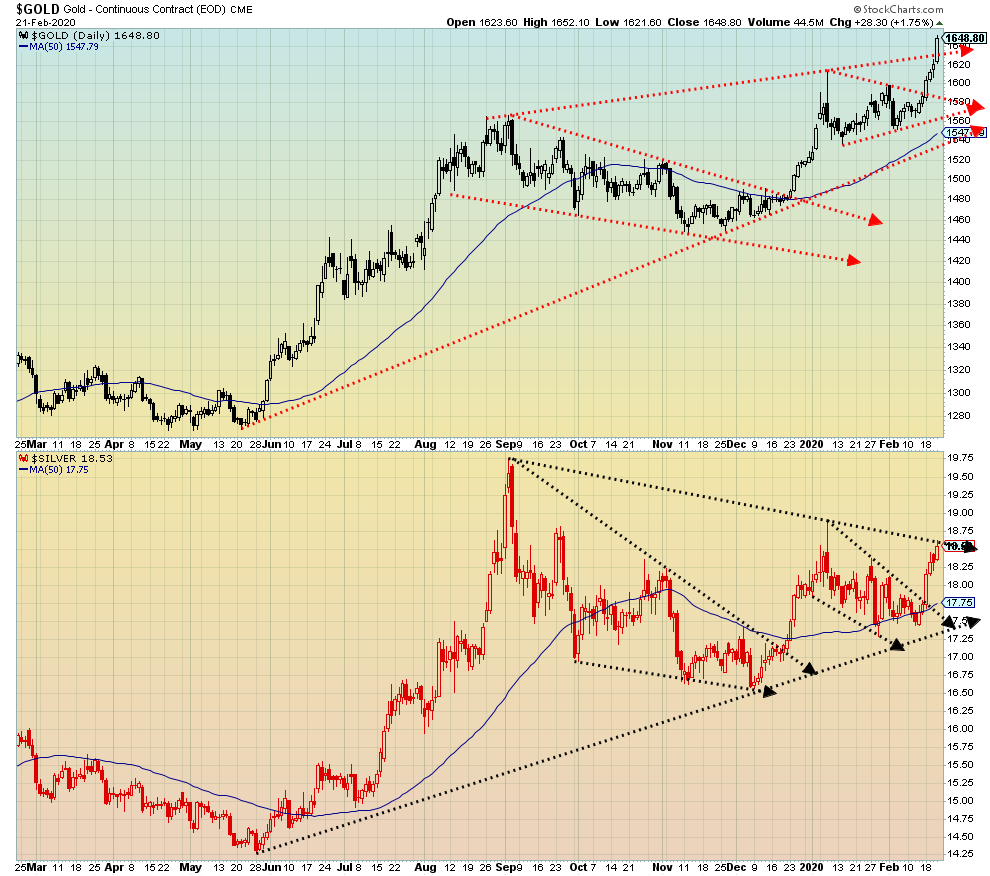
While we were pleased that both gold and silver enjoyed a good up week with gold breaking out of the top of the channel, silver stopped Friday at the top of the channel. We still expect silver to take it out, but what is of concern is that gold is making new highs while silver is not. As long as this divergence persists, it sounds a note of caution as gold and silver rise.
THIS IS JUST AN EXCEPRT ON SILVER -- Please click READ THE FULL REPORT
Technical Scoop: Irrational exuberance, COVID-19 surprise, negative spread, gold target, divergences abound, stimulus fuel
By: David Chapman
Is “irrational exuberance” back? Records keep falling. Maybe this time it is different. But Friday steadied the market with a downdraft as some economic numbers came in on the low side. And COVID-19 cases are jumping outside China catching many by surprise. Now in 33 countries. Our recession indicator spread (page 18) is sliding again and the 3m-10 spread has turned negative. Capital flight has been driving the market pushing the U.S. dollar up and money flowing into U.S. bonds and the U.S. stock market. But money flowing into gold as well despite the jump in the U.S. dollar. Then on Friday the U.S. dollar dropped sharply and gold soared. Gold fast approaching our targets and could hit $1,700 this week. Too fast of a move has our fingers on the “take profits” button.
Our Chart of the Week (page 6) looks at a rather interesting case of possible symmetry in the markets. We look at the NASDAQ of 1998-2000 and compare it with the NASDAQ of 2018-present.
Could a top be in the markets given the sharp sell-off on Friday? Still needs confirmation but negative divergences abound as we note in a few charts. In addition to being designed to allocate to cash in the event of a sustained market decline, the Canadian Dividend Strategy provides downside protection with income-paying investments such as Granite Real Estate Investment Trust yielding a dividend of 3.89%.*
Oh and dare we mention President Trump wants another round of tax cuts and other stimulus with stock markets at record highs and unemployment at 50 year lows. Fuel for the fire.
TECHNICAL SCOOP Charts and commentary by David Chapman Chief Strategist, Enriched Investing Inc. Phone: 416-523-5454 Email: david@davidchapman.com dchapman@enrichedinvesting.com Twitter: @Davcha12 February 24, 2020 |
Copyright David Chapman, 2020
David Chapman is not a registered advisory service and is not an exempt market dealer (EMD). We do not and cannot give individualised market advice. The information in this newsletter is intended only for informational and educational purposes. It should not be considered a solicitation of an offer or sale of any security. The reader assumes all risk when trading in securities and David Chapman advises consulting a licensed professional financial advisor before proceeding with any trade or idea presented in this newsletter. We share our ideas and opinions for informational and educational purposes only and expect the reader to perform due diligence before considering a position in any security. That includes consulting with your own licensed professional financial advisor.
GLOSSARY
Trends
Daily – Short-term trend (For swing traders)
Weekly – Intermediate-term trend (For long-term trend followers)
Monthly – Long-term secular trend (For long-term trend followers)
Up – The trend is up.
Down – The trend is down
Neutral – Indicators are mostly neutral. A trend change might be in the offing.
Weak – The trend is still up or down but it is weakening. It is also a sign that the trend might change.
Topping – Indicators are suggesting that while the trend remains up there are considerable signs that suggest that the market is topping.
Bottoming – Indicators are suggesting that while the trend is down there are considerable signs that suggest that the market is bottoming.
About the author