Excerpt from this week's: Technical Scoop: Silvery Nano-second, Golden Divergence, Sluggish Rates
Gold and Silver
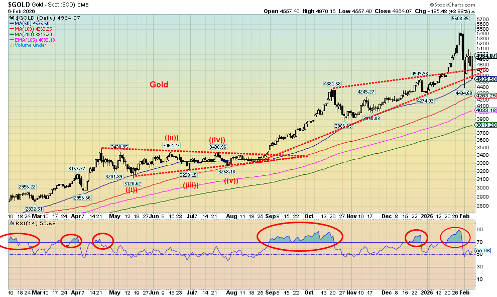
Much has been written about the silver slaughter of January 30, 2026. That day, silver fell a mind-boggling 27%. Altogether, the decline from top to bottom (to date) was 41.4%. In a nanosecond, silver went from a bull market to a bear market with nothing in-between. Gold was hit as well but to date its decline is only 21.5%. That’s also a bear market. The change from bull to bear was as dramatic as anything we’ve ever seen.
There were the triggers. The Chicago Mercantile Exchange (CME) changed margin requirements again, catching many offside and facing margin calls. Forced selling, stop-loss selling, and evidence that the bullion banks piled on as they were short exacerbated the decline. Bond yields were sticky to the upside, especially in Japan, the U.S. dollar strengthened off recent lows, and trading was thin with buyers quickly dropping bids. This was, as many noted, a technical crash, not a fundamental one. Physical tightness remains: mine supply remains down while demand is high, particularly for industrial use. Silver is being named as a critical metal. Spreads between paper silver and physical silver widened. Paper silver outnumbers physical silver by an estimated margin of 350:1. Some say it’s even higher.
Nonetheless, crashes like this are not finished in a day or two. Typically, they could last for days, weeks, or even months before we begin the next leg up. It could also be a corrective wave up. That high of $121.64 could be it for some time. Not until we make new highs could we call this bear market truly over. At this time, we’d have to take out $110 just to suggest possible new highs ahead. Silver hit new lows. Gold did not. A divergence? We consider $70 support for silver. If that breaks, the next good support doesn’t come in until around $55. A test of the major $50 breakout? Yes, that is possible.
Given the big drop for gold and silver, one would expect the gold stocks to have been slaughtered. The TSX Gold Index (TGD) fell 17%, the Gold Bugs Index (HUI) dropped 18.7%, the Van Eck Gold Miners ETF (GDX) fell about 19%, the Van Eck Junior Gold Miners ETF (GDXJ) fell 20.6%, and the Global X Silver Miners ETF (SIL) fell 23.4%.
What gives? Silver gets slaughtered 41% but the Silver Gold Miners (SIL) falls only 23.4%? Aren’t the stocks (paper) supposed to outperform to both the upside and downside? Maybe the gold and silver stocks didn’t believe the drop in the metals. Granted, on the other side, silver had gained 390% from 2024 to the recent peak vs. a gain for SIL of only 318%. But gold gained 163% while the GDX was up 269% and GDXJ was up 316%. Spectacular gains for all. But it was only silver that outperformed everyone, primarily because of shortages and demand for physical silver.
An interesting way to look at this is a ratio chart. In this chart we show the Silver Miners (SIL) to the Silver Trust (SLV) ratio going back to 2011.
Global Silver Miners (SIL)/iShares Silver Trust (SLV) Ratio 2011–2026
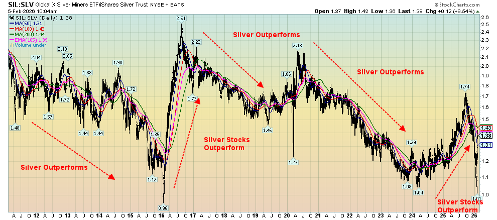
Source: www.stockcharts.com
During this period, silver outperformed in bear or down markets while the silver stocks outperformed in bull up markets. The ratio peaked in September 2025 at 1.74 and from September to January 29, 2026, silver was outperforming the silver stocks. But the crash on January 30, 2026, changed everything. Since then, the ratio has climbed back up to 1.38, indicating that since the crash the stocks have been outperforming.
We view the silver stocks hanging in this well against the silver price as positive going forward. But as indicated, this corrective period could last days, weeks, or longer. The fundamentals remain the same as they were when we rose from $21.91 low in early 2024 to the $121.63 peak.
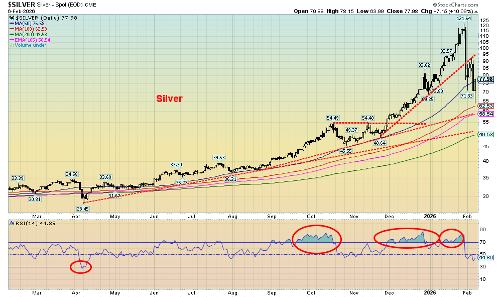
Source: www.stockcharts.com
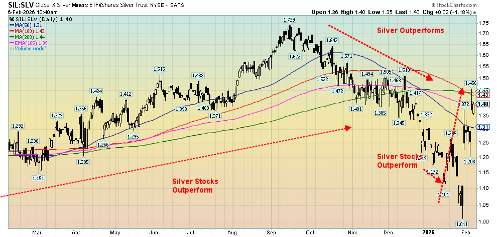
Silver has good support down to $58/$62 if the recent low at $71.33 fails. What really caught our eye is that since that high on January 29 (low for the SIL/SLV ratio), the silver stocks caught a bid even as silver itself was plunging. We took the same SIL/SLV chart and shortened the time frame to show how silver stocks outperformed from January 30. A positive divergence indicates that maybe this massive sell-off won’t last too long. Needless to say, the sell-off isn’t over until gold, silver, gold, and silver stocks are making new highs together. Anything else should be viewed with some suspicion.
The bull market for gold, silver, the gold/silver stocks, many other precious metals, and even near precious metals this past year or so has been nothing short of spectacular. As we’ve so often noted, they are rising because of geopolitical concerns, domestic (U.S.) political concerns, massive amounts of debt everywhere that are threatening a sovereign debt crisis, and sticky interest rates, particularly at the long end of the yield curve that remains above what we had become accustomed to. The Fed can cut rates all they want, but it’s the bond market that rules.
We live in dangerous times.
Source: www.stockcharts.com
Source: www.stockcharts.com
Read the full excerpt here: Technical Scoop: Silvery Nano-second, Golden Divergence, Sluggish Rates
Disclaimer
David Chapman is not a registered advisory service and is not an exempt market dealer (EMD) nor a licensed financial advisor. He does not and cannot give individualised market advice. David Chapman has worked in the financial industry for over 40 years including large financial corporations, banks, and investment dealers. The information in this newsletter is intended only for informational and educational purposes. It should not be construed as an offer, a solicitation of an offer or sale of any security. Every effort is made to provide accurate and complete information. However, we cannot guarantee that there will be no errors. We make no claims, promises or guarantees about the accuracy, completeness, or adequacy of the contents of this commentary and expressly disclaim liability for errors and omissions in the contents of this commentary. David Chapman will always use his best efforts to ensure the accuracy and timeliness of all information. The reader assumes all risk when trading in securities and David Chapman advises consulting a licensed professional financial advisor or portfolio manager such as Enriched Investing Incorporated before proceeding with any trade or idea presented in this newsletter. David Chapman may own shares in companies mentioned in this newsletter. Before making an investment, prospective investors should review each security’s offering documents which summarize the objectives, fees, expenses and associated risks. David Chapman shares his ideas and opinions for informational and educational purposes only and expects the reader to perform due diligence before considering a position in any security. That includes consulting with your own licensed professional financial advisor such as Enriched Investing Incorporated. Performance is not guaranteed, values change frequently, and past performance may not be repeated.
About the author


Website: https://www.enrichedinvesting.com
Disclaimer: David Chapman is not a registered advisory service and is not an exempt market dealer (EMD) nor a licensed financial advisor. We do not and cannot give individualised market advice. David Chapman has worked in the financial industry for over 40 years including large financial corporations, banks, and investment dealers. The information in this newsletter is intended only for informational and educational purposes. It should not be considered a solicitation of an offer or sale of any security. The reader assumes all risk when trading in securities and David Chapman advises consulting a licensed professional financial advisor before proceeding with any trade or idea presented in this newsletter. David Chapman may own shares in companies mentioned in this newsletter. We share our ideas and opinions for informational and educational purposes only and expect the reader to perform due diligence before considering a position in any security. That includes consulting with your own licensed professional financial advisor.