Excerpt from this week's: Technical Scoop: Surprise Entrance, Supply Questions, Uncertain Globe
Source: www.stockcharts.com
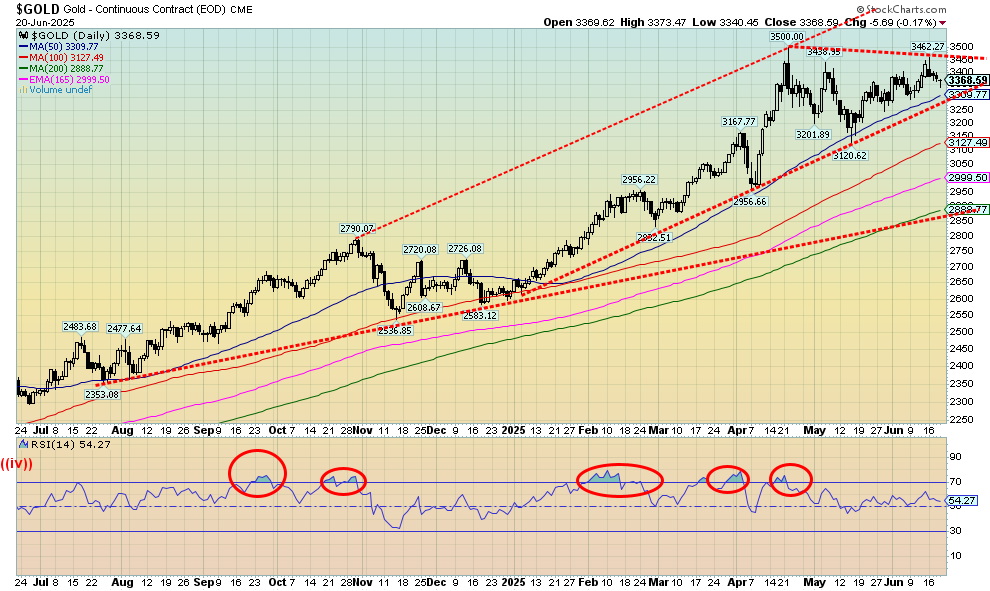
Due to confusion on what may or may not happen in the Israel/Iran war, gold faltered this past week. On the week, we ended down 1.8%. The Fed didn’t help with talk of inflation and no rate cuts, at least until the fall. Silver fared only somewhat better, down 0.7%. However, platinum gained 4.5%, palladium was up 1.6%, and copper rose 1.9%. Copper’s rising is a positive development as often gold follows copper’s lead. Also, silver’s not losing as much as gold we view positively. Nonetheless, a failure to make new highs while silver did is a bit of an unresolved negative divergence. The goings-on in the Middle East could make or break gold’s near-term performance. For gold bugs, it has been a banner year. Gold is up 27.6%, silver is up 23.2%, and platinum is up 38.7%. Palladium is also up 14.5% and copper up 19.9%. However, it has been the gold stocks that have been on fire, as at week’s end, despite losses for both the TSX Gold Index (TGD) and the Gold Bugs Index (HUI), they are up in 2025 49.5% and 52.9% respectively. Again, while silver made a new 52-week highs, we note that both the TGD and the HUI failed to make new highs this past week. Divergences.
As a follower of cycles, we have often talked about gold’s 7.8-year cycle (range 83–104 months). The low in December 2015 was a major 7.8-year cycle low. The next 7.8-year cycle low occurred in November 2022. So, we are on a new up cycle in the 7.8-year cycle. Typically, that cycle breaks down into two 3.9-year cycles (47 months) or three 2.6-year cycles (31 months). The first 2.6-year cycle low could be due in June 2025 +/- 3-months. So here we are, but a low hasn’t been seen yet. It is possible the low was made in May at $3,120. However, to confirm that low we need to see new highs above $3,500. So far, we have not. Add in the divergence with silver and it remains possible we could have another down thrust to complete the cycle. That could place a potential low for gold somewhere around mid-July 2025. It would also suggest the pattern that developed from the $3,500 top to be unfolding as an ABCDE-type pattern with ABCD complete and E wave down to come. A break under $3,300 would confirm we are on the E wave down. The drop could take us to $3,100. But if things went off the rails with the end of the Israel/Iran conflict, then we could fall in a worst case to $2,900 and major long-term support. Remember that this would only be the first 31-month cycle low with two more cycles to come. If on the other hand we break to new highs then we are also probably having an expansion of the Israel/Iran war. If there is a down cycle to the 7.8-year cycle, it is the third 31-month cycle. However, the crest of the current 7.8-year may not come until into that third cycle. Since the 7.8-year cycle could break into two 47-month cycles, it remains possible that we have more to go in the current up cycle. New highs over $3,500 with no new lows could confirm that we are still rising with the 47-month still to crest.
We are short-term cautious on gold right now but long-term bullish. The bull pattern kicks back in with new highs over $3,500 and both gold and silver (and the gold stocks) making new highs. However, if the short-term caution does show, we should bottom sometime next month.
Coincidently, there appears to be a divergence of views on gold’s moves between two of the biggest players, Goldman Sachs and Citibank. Goldman is calling for gold $4,000 in 2026 while Citi is calling for gold to fall below $3,000 in 2026. Could they both be right? It is possible.
Source: www.stockcharts.com
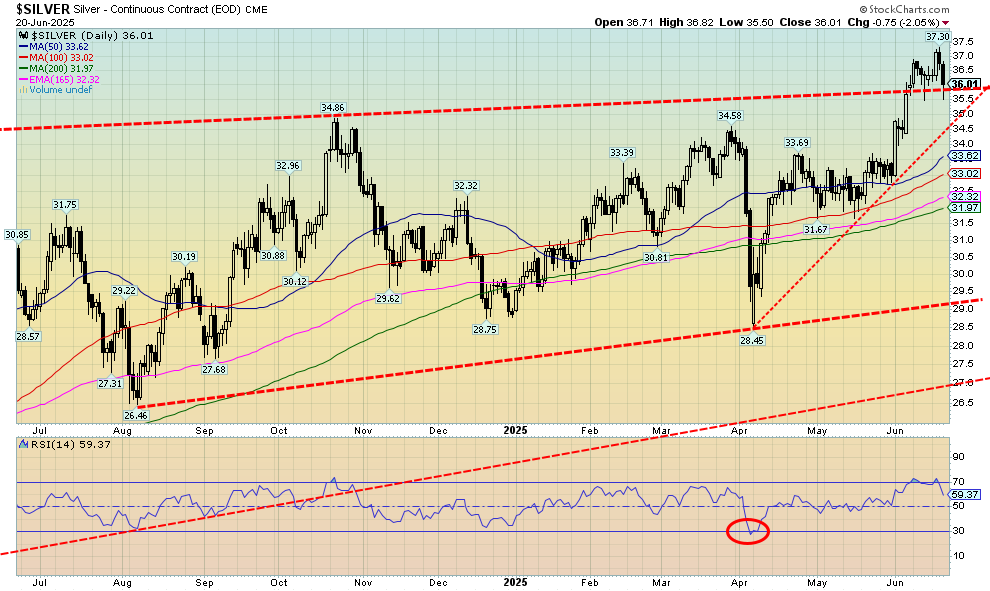
Silver finally broke out and made new 52-week highs. However, we don’t like the way it broke out. Platinum is doing something similar. Both made new 52-week highs this past week, then turned down. Silver ended the week down 0.7%; however, platinum held on to a 4.5% gain. A break now of $35 could suggest a top is in. Under $34.50 a top is in. There is considerable support down to $32 to $34, but a break under $32 would be negative and we could fall to $29. New highs could end the down discussion. No negative divergences were seen at the top. If the breakout is correct, our target is up to $44. But false breakouts are all a part of the market as they bring in a lot of new players, setting them up for a fall. The bottom line is, a break of $34.50 is negative and could set us on the path towards $32/$34.
Source: www.stockcharts.com
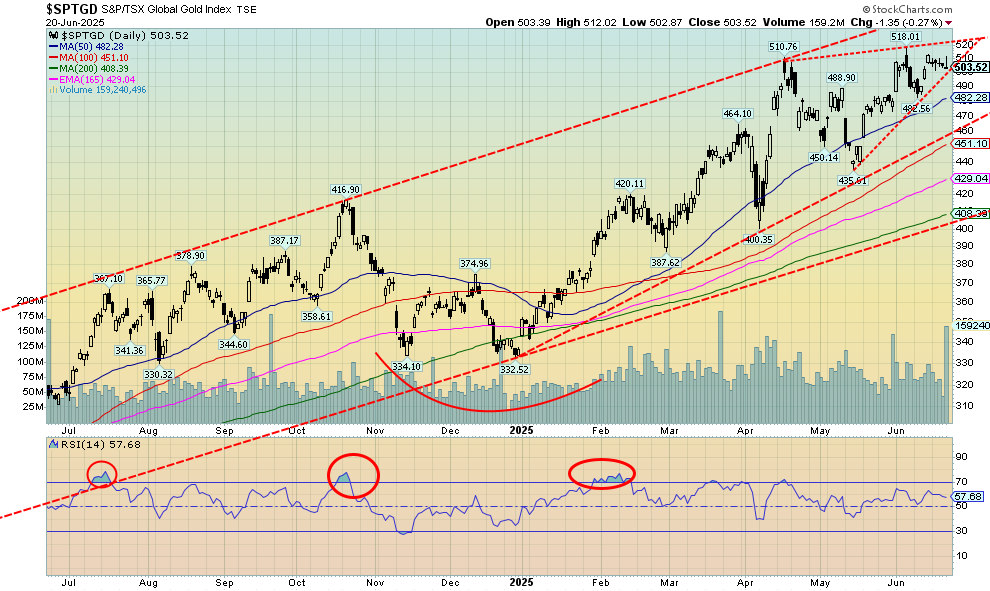
Have the gold stocks made a temporary top? Could be. We topped on the TSX Gold Index (TGD) on April 16 at 510.76. Another higher high top was made on June 5 at 518.01. On both days the high was made, then the market turned down. While the TGD made a higher high on June 5, the indicators did not confirm as all were making lower highs. Now we appear to be turning down from the June 5 top without making another high. All of these are negative divergences. On the week, the TGD fell 1.7% while the Gold Bugs Index (HUI) fell 2.4% as it made the same pattern as the TGD.
A break now of 500 would start to confirm the top and project a fall, most likely to that uptrend line that currently comes in at 460. If we were to take out the recent low at 435, the odds then favour a decline to around 400. Only firm new highs could break this pattern. Another new high that doesn’t firmly take out the June 5 high sets up a pattern we call three thrusts to a high. Once that happens, a larger decline could get underway. It’s a warning.
Read the FULL report: Technical Scoop: Surprise Entrance, Supply Questions, Uncertain Globe
Disclaimer
David Chapman is not a registered advisory service and is not an exempt market dealer (EMD) nor a licensed financial advisor. He does not and cannot give individualised market advice. David Chapman has worked in the financial industry for over 40 years including large financial corporations, banks, and investment dealers. The information in this newsletter is intended only for informational and educational purposes. It should not be construed as an offer, a solicitation of an offer or sale of any security. Every effort is made to provide accurate and complete information. However, we cannot guarantee that there will be no errors. We make no claims, promises or guarantees about the accuracy, completeness, or adequacy of the contents of this commentary and expressly disclaim liability for errors and omissions in the contents of this commentary. David Chapman will always use his best efforts to ensure the accuracy and timeliness of all information. The reader assumes all risk when trading in securities and David Chapman advises consulting a licensed professional financial advisor or portfolio manager such as Enriched Investing Incorporated before proceeding with any trade or idea presented in this newsletter. David Chapman may own shares in companies mentioned in this newsletter. Before making an investment, prospective investors should review each security’s offering documents which summarize the objectives, fees, expenses and associated risks. David Chapman shares his ideas and opinions for informational and educational purposes only and expects the reader to perform due diligence before considering a position in any security. That includes consulting with your own licensed professional financial advisor such as Enriched Investing Incorporated. Performance is not guaranteed, values change frequently, and past performance may not be repeated.
About the author


Website: https://www.enrichedinvesting.com
Disclaimer: David Chapman is not a registered advisory service and is not an exempt market dealer (EMD) nor a licensed financial advisor. We do not and cannot give individualised market advice. David Chapman has worked in the financial industry for over 40 years including large financial corporations, banks, and investment dealers. The information in this newsletter is intended only for informational and educational purposes. It should not be considered a solicitation of an offer or sale of any security. The reader assumes all risk when trading in securities and David Chapman advises consulting a licensed professional financial advisor before proceeding with any trade or idea presented in this newsletter. David Chapman may own shares in companies mentioned in this newsletter. We share our ideas and opinions for informational and educational purposes only and expect the reader to perform due diligence before considering a position in any security. That includes consulting with your own licensed professional financial advisor.