Excerpt from this week's: Technical Scoop: Sweet Harvest, Soft Unlikely, Bright Gold

Source: www.stockcharts.com
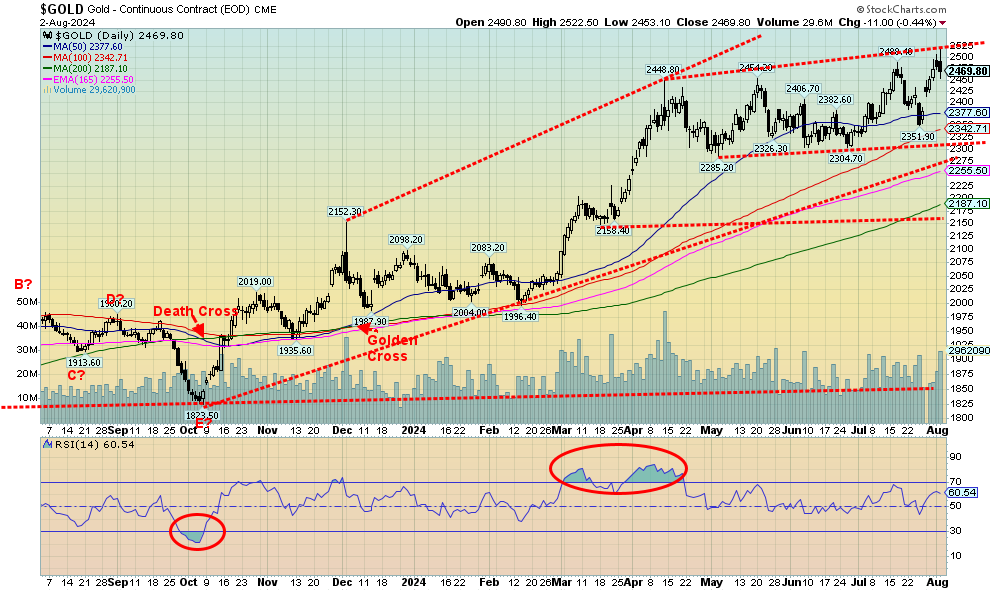
Gold once again made new all-time highs and, for the first time ever, hit $2,500. But these round numbers also bring out a tendency to sell once they hit them. Gold peaked out at $2,522, then promptly reversed and closed lower on Friday. The job numbers seemed to act as a catalyst even if we did find it odd, given the big drop in the US$ Index. We were also buoyed by what we believed was an ABCDE-type pattern that appeared to form following that initial high back in April at $2,448. We thought the pattern might be finished with the E drop to $2,351 last week. Then came the ceiling at $2,500. So now we need to break and close above $2,525 to tell us we are indeed headed higher.
Friday’s job report should have been music to gold’s ears. Initially it was. Then it wasn’t. It could just be a knee-jerk reaction to the sell-off in the stock market that prompted a wave of some profit-taking to set in for gold that prompted the reversal. On the week, gold was golden, gaining 3.7% to new all-time highs over $2,500. Silver would have been delighted to have followed suit, but it lagged, gaining only 1.3%. Platinum gained 2.5% but remains down 5.4% in 2024. Palladium is miserable, falling 0.5% this past week, and is down 22.6% in 2024. Copper, which had earlier made all-time highs remains in a funk, losing 0.5% but remaining up 5.4% in 2024. The gold stocks were higher but came off with the stock market sell-off. Still, the Gold Bugs Index (HUI) held on for a 0.2% gain and the TSX Gold Index (TGD) was up 1.3%. But Friday’s sell-off did them no favours.
Certainly, the catalysts are there for gold, which is why we believe this is just another temporary setback. A weakening economy and the Fed poised to cut rates in September (some think they’ll act even earlier) and not only cut but make it a big one of 50 bp. Then there is the almost ensured expansion of the Middle East war into Lebanon and even Iran, following that assassination in Tehran. The U.S. may want to put an end to it, but then they move more war ships into the area. As well, Iranian proxies are most likely poised to hit U.S. bases in Iraq. The Iraqi government has long asked the U.S. to leave. None of this appears to be conducive to peace. And that in turn should be positive for gold as a safe haven.
If this is a new leg to the upside, we need to hold support at $2,425. If that breaks, then this upswing is in question. A break under $2,400 could send us tumbling to $2,325 and send us scrambling trying to figure out this new unfolding pattern. Meanwhile, we now need to regain and take out $2,525 to tell us we are headed higher. Despite gold’s volatility this past week, the stock market is even more volatile—which highlights that when the stock markets crash, gold goes down but a lot less than the stock markets. Hence, its safe haven appeal.

Source: www.stockcharts.com
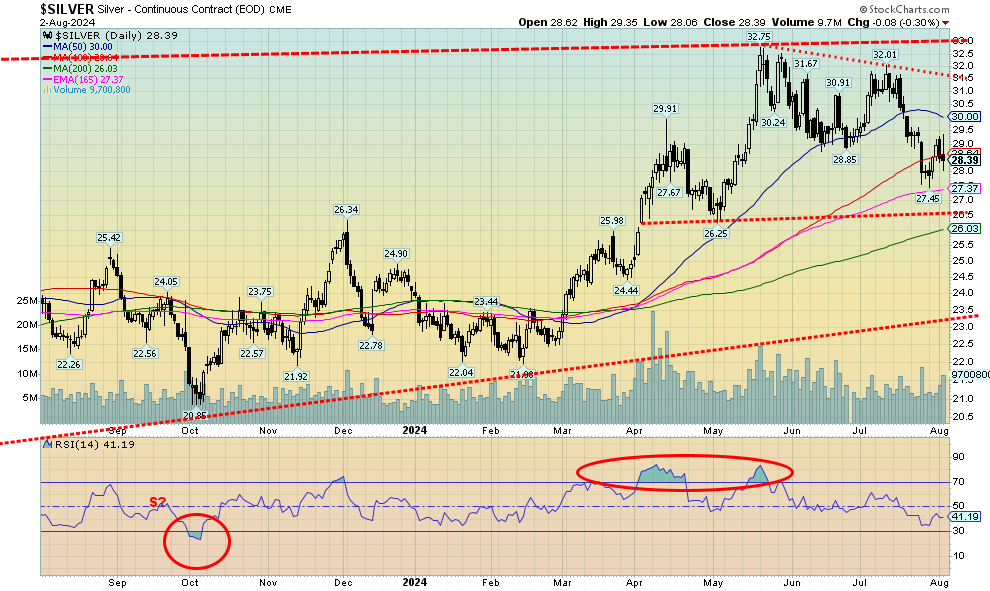
While gold prices once again made new all-time highs and finished the week to the upside, silver was up but it was a struggle and once again it underperformed. We’ve constantly noted this ongoing divergence between the two precious metals and we continue to hold that we can’t make serious headway unless both are at least making new highs. This past week, silver finished nowhere near its most recent high of $32.75, let alone all-time highs. Silver did gain 1.3% on the week, but that was underwhelming compared to gold’s 3.7% gain and new all-time highs. Until silver starts being the leader we need it to be, we remain bullish but cautious on the precious metals market. Despite it all, silver remains up 17.9% in 2024 but that is underwhelming to gold’s 19.2% gain. We do see support down to $27.50 and better support at $26.50, but we wouldn’t want to see a breakdown under $26.50. Longer term support at $23.50 is a way off. Meanwhile, to the upside, we need to regain above $31.50 to suggest new highs above $32.75. If there is any consolation, we could be completing an ABC correction of silver in its rise from $21 to $32.75. If that is correct, then we could be nearing the end of the correction. But that doesn’t change our need to regain above $31.50 to tell us this correction is over.

Source: www.stockcharts.com
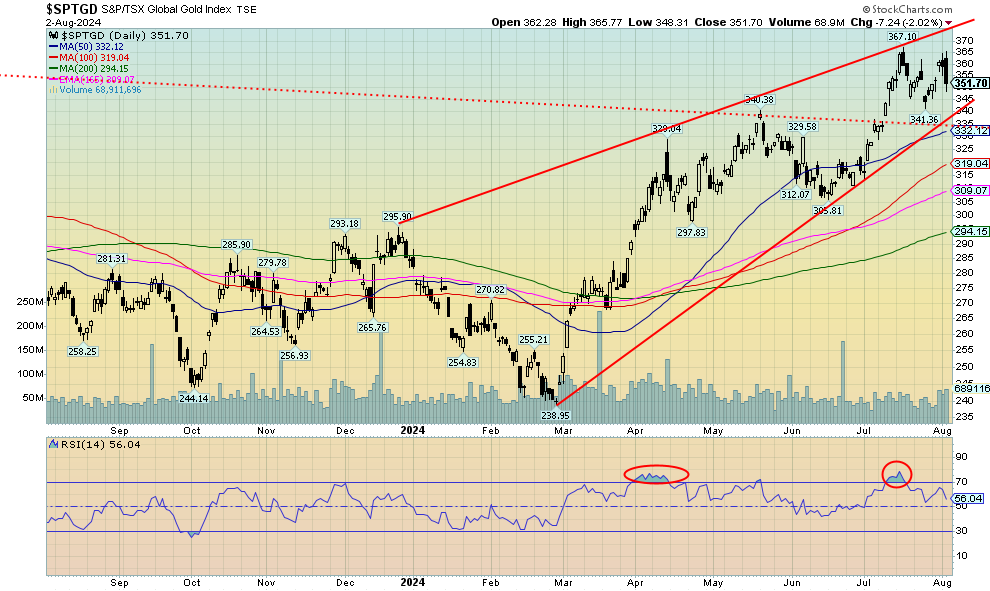
The gold stocks were on their way to recovering the earlier highs—then came Friday and the U.S. job numbers and everything was hit. It seems to happen all the time that when the stock market falls, gold stocks usually get hit as well. At least they are starting from a higher level. We reversed on Friday to the downside, suggesting we may have made a temporary top. If we are making an ABC-type correction, then this could be the start of the C wave. The gold stock indices ended mixed this past week with the TSX Gold Index (TGD) gaining 1.3% while the Gold Bugs Index (HUI) clung to a 0.2% gain on the week. It could have been worse. Our key support line lies near 335. A break under that level and especially under 332 suggests lower prices ahead. Support comes in around 320 and again around 310. There are some divergences but not any major ones so we suspect this is a correction to the recent uptrend but not the end of the uptrend. That might change if we were to break under 305 and especially under 295. Initially, however, we can’t say whether 335 will hold. We have the makings of an ascending wedge triangle but it is not totally clear. Initially at least, we’ll see if 335 holds. A swing down target could be around 315 if 335 were to break
READ the full report here: Technical Scoop: Sweet Harvest, Soft Unlikely, Bright Gold
Disclaimer
David Chapman is not a registered advisory service and is not an exempt market dealer (EMD) nor a licensed financial advisor. He does not and cannot give individualised market advice. David Chapman has worked in the financial industry for over 40 years including large financial corporations, banks, and investment dealers. The information in this newsletter is intended only for informational and educational purposes. It should not be construed as an offer, a solicitation of an offer or sale of any security. Every effort is made to provide accurate and complete information. However, we cannot guarantee that there will be no errors. We make no claims, promises or guarantees about the accuracy, completeness, or adequacy of the contents of this commentary and expressly disclaim liability for errors and omissions in the contents of this commentary. David Chapman will always use his best efforts to ensure the accuracy and timeliness of all information. The reader assumes all risk when trading in securities and David Chapman advises consulting a licensed professional financial advisor or portfolio manager such as Enriched Investing Incorporated before proceeding with any trade or idea presented in this newsletter. David Chapman may own shares in companies mentioned in this newsletter. Before making an investment, prospective investors should review each security’s offering documents which summarize the objectives, fees, expenses and associated risks. David Chapman shares his ideas and opinions for informational and educational purposes only and expects the reader to perform due diligence before considering a position in any security. That includes consulting with your own licensed professional financial advisor such as Enriched Investing Incorporated. Performance is not guaranteed, values change frequently, and past performance may not be repeated.


