Excerpt from this week's: Technical Scoop: Tariff Furor, Overvaluation Problem, Precious Seasonality

Source: www.stockcharts.com
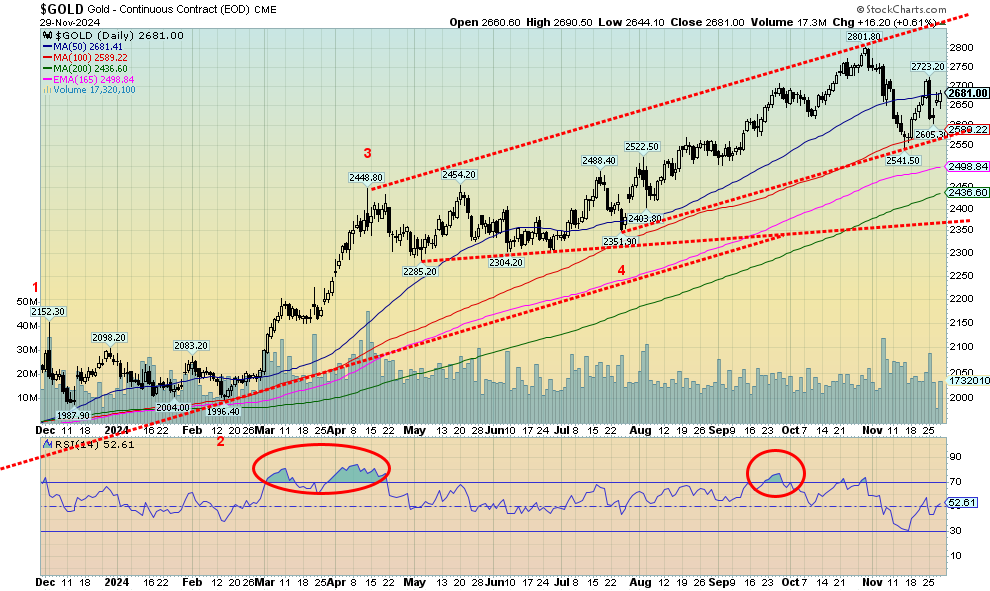
Gold took a nasty hit last Monday, November 25 as gold (and silver) had a mini-heart attack over stronger PCE prices and the ongoing resilient U.S. economy. Gold fell 3.5%. Gold then spent the rest of week recovering, down only about 1.2% at close. Silver fell 0.7%, a positive sign that it is outperforming gold, while platinum was off 2.2%. Of the near precious metals, palladium dropped 2.3% but copper gained 1.2%, a positive move as copper often leads gold. The gold stocks fared badly as well with the Gold Bugs Index (HUI) off 2.3% and the TSX Gold Index (TGD) down 2.1%. On the year, only platinum and palladium are down, off 6.8% and 12.7%. Gold, silver, and copper remain up on the year: 29.4%, 29.1%, and 6.4%. The HUI and TGD are also up on the year at 23.8% and 25.9%. We’d prefer to see the gold stocks outpacing gold itself. That would be a positive development.
Following the November 25 debacle, gold spent the rest of the week recovering as a falling U.S. dollar and the upping of tensions between Russia/Ukraine took hold. The peace agreement between Israel/Hezbollah was announced but, in no time, breaches were seen on both sides. Gold acts as a safe haven from geopolitical tensions and even domestic political tensions. A loss of confidence in government would spur gold sales. Despite gold’s recent debacle, demand for it has been strong, particularly with central banks (the latest being the Eastern European central banks) loading up and strong demand in Asia.
October/December is often a weak period for gold following strength in August/September. We saw important lows for gold in December 2015, 2016 and in November 2022. Once a low is found, we often rally into January/February. The question is identifying the bottom and when. We are looking at the FOMC meeting on December 17–18 as a potential period for a potential low. Of course, that is over two weeks away so, as we always say about the gold market, it is going higher but patience is required through these pullbacks. Above $2,725 would be positive and above $2,740 new highs become probable. The strong US$ Index helped propel gold higher in other currencies, but they pulled back a little as the US$ Index weakened this past week. To the downside, a break of $2,550 would be quite unfriendly but good support below that is at $2,450/$2,500. We don’t believe we’ll fall that far, but we have to be prepared if we do. Irrespective of this, a low sometime this month should occur.

Source: www.stockcharts.com
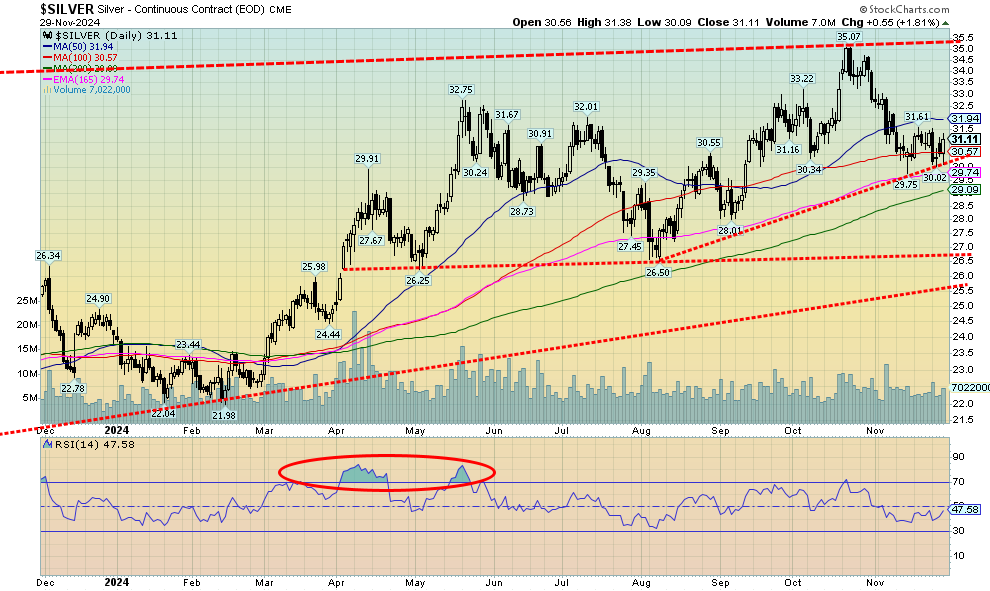
It was a pretty quiet week for silver. The best part was that, given that both gold and silver fell, silver actually outperformed, down 0.7% vs. gold down about 1.2%. The bad day was last November 25 when silver fell, along with gold, down 3.5%. However, after that silver just range traded and ended the week down only 0.7%. Like gold, silver attracts safe-haven funds, given the ongoing conflicts in Russia/Ukraine and Israel/Gaza/Hezbollah/Iran. So far, it looks like silver is holding that uptrend line currently near $30. Below $30 we could fall back to $29 and the 200-day MA. We need to first break above $32 and especially above $34. Above $34 (even above $33.80), new highs above $35 become probable. We maintain our targets of $39/$40. It has just been a struggle to get there. And with a gold/silver ratio of 86, silver remains ridiculously cheap compared to gold. It has been in this range for so long that people think it’s normal. As we’ve noted many times, silver tends to lead in both up and down markets. This past week, with silver outperforming gold, we view that as potentially positive.
Read the FULL report: Technical Scoop: Tariff Furor, Overvaluation Problem, Precious Seasonality
Disclaimer
David Chapman is not a registered advisory service and is not an exempt market dealer (EMD) nor a licensed financial advisor. He does not and cannot give individualised market advice. David Chapman has worked in the financial industry for over 40 years including large financial corporations, banks, and investment dealers. The information in this newsletter is intended only for informational and educational purposes. It should not be construed as an offer, a solicitation of an offer or sale of any security. Every effort is made to provide accurate and complete information. However, we cannot guarantee that there will be no errors. We make no claims, promises or guarantees about the accuracy, completeness, or adequacy of the contents of this commentary and expressly disclaim liability for errors and omissions in the contents of this commentary. David Chapman will always use his best efforts to ensure the accuracy and timeliness of all information. The reader assumes all risk when trading in securities and David Chapman advises consulting a licensed professional financial advisor or portfolio manager such as Enriched Investing Incorporated before proceeding with any trade or idea presented in this newsletter. David Chapman may own shares in companies mentioned in this newsletter. Before making an investment, prospective investors should review each security’s offering documents which summarize the objectives, fees, expenses and associated risks. David Chapman shares his ideas and opinions for informational and educational purposes only and expects the reader to perform due diligence before considering a position in any security. That includes consulting with your own licensed professional financial advisor such as Enriched Investing Incorporated. Performance is not guaranteed, values change frequently, and past performance may not be repeated.

Source: www.stockcharts.com
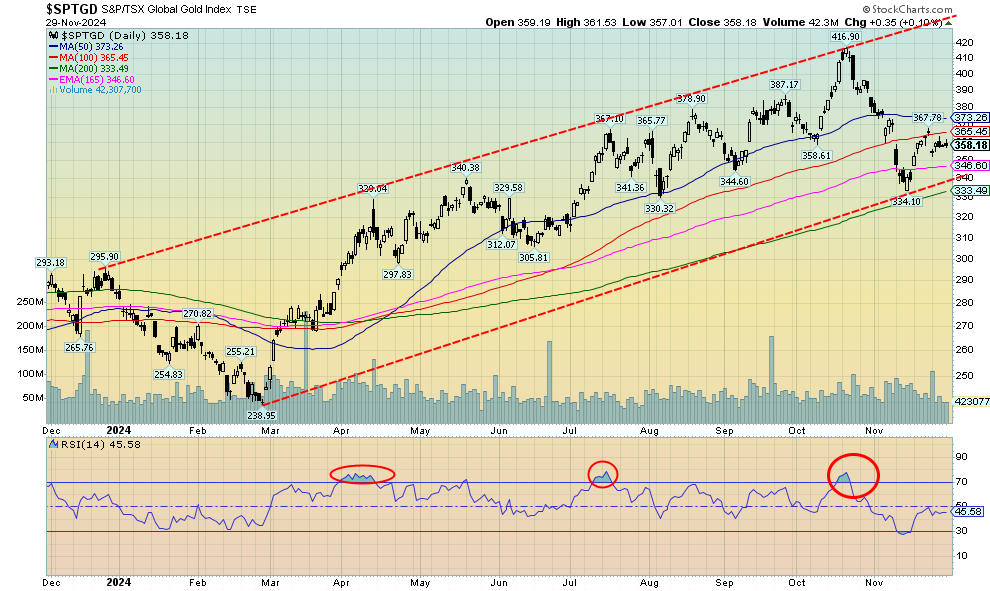
Following a strong up week the previous week, this week saw what appears to be a corrective pullback. The TSX Gold Index (TGD) fell 2.1% while the Gold Bugs Index (HUI) was off 2.3%. Nothing much changed. With gold and silver both off on the week, it was no surprise the gold stocks fell as well. Technically, the rebound stopped just short of the 50-day MA. That sets in motion a move back above 370 that could take us to the next level near 400. Overall, the drop since the October peak was about 20%. As we have noted, this is not unusual as the big run-up in 2009–2011 saw more than a few drops of at least around 15 drops on their way to record highs. Such is the thin and volatile nature of the gold market which, compared to the broader stock market and the bond market, is small. There continues to be good support down to 340, but a drop under that level and especially under 330 could propel us even lower. Nonetheless, we are working off the overbought levels hit in October and are currently neutral. However, a move above 375 and especially above 400 would be positive. Above 400 new highs are probable.


