Source: www.stockcharts.com
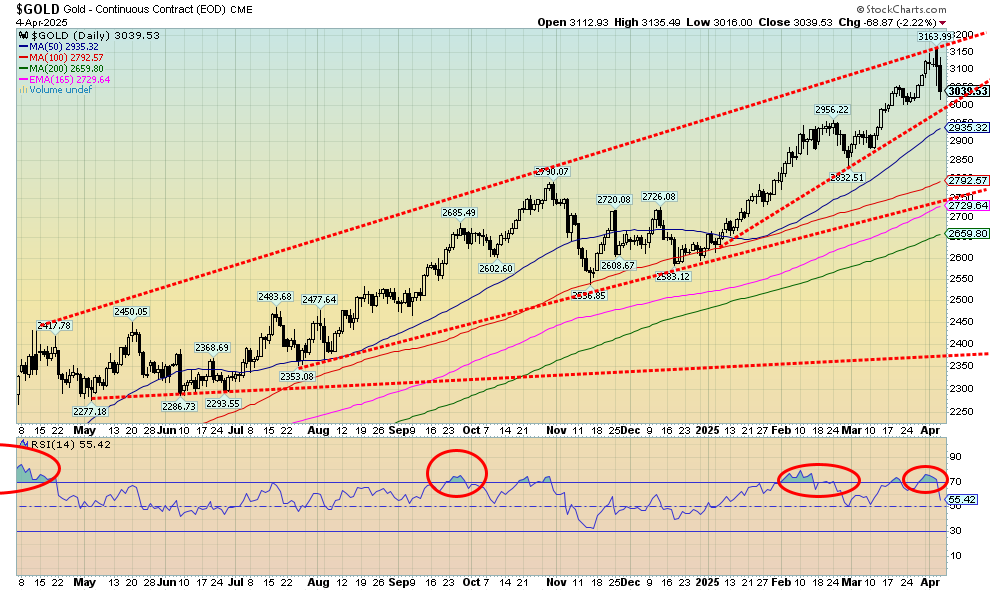
We’ve seen it in the past. The stock market gets beat up and gold follows. This week proved to be no exception, although the background remains very positive for gold going forward. We wish it were more like the 1987 stock market crash when the DJI fell 23% and gold rose 2.5%. That said, gold did pull back afterwards. However, what usually happens is when the stock market gets hit hard gold also gets hit but nowhere near as badly. As to silver and the gold stocks, well they are not gold and were hit just like the broader market. Gold lost only 1.4% this past week after making new all-time highs once again. A reversal week? Yes, and April 3 saw what looked a key reversal day, meaning a new all-time high, a reversal, and lower close below the previous day’s low. We also fell from overbought levels, so arguably a pullback was no doubt already going to happen. The most galling part was that on Friday, while gold was falling 2.2%, Bitcoin rose (up 0.4%). Bitcoin more valuable than gold? Hardly.
The prime reasons for holding gold haven’t changed: geopolitical tensions (that are rising further given the tariffs), economic uncertainty (thanks to tariffs), and loss of faith in government (again, the tariffs and how they are happening along with growing protests against the Trump administration). Gold is still regarded as a safe haven. Gold also protects against currency devaluation. Gold remains up 15.1% on the year. The S&P 500 is down 13.7%. On the week, gold fell 1.4%, silver was walloped, down 13.0%, and platinum dropped 7.8%. Of the near precious metals, palladium fell 7.2% and copper dropped 14.7%, as many predicted with an impending recession copper demand would fall. The gold stocks fell too, with the Gold Bugs Index (HUI) down 9.3% and the TSX Gold Index (TGD) off 8.5%. Both remain up on the year, a far cry from the broader stock market.
Nonetheless, we can’t argue against a potential corrective period for gold that could at minimum take us into May. If we fall through $3,000, a drop to $2,900 can’t be ruled out. Longer term support appears to be down to $2,700. A normal Fibonnaci 38.2% correction of the move from that November 2024 low would take us to near $2,900.
Source: www.stockcharts.com
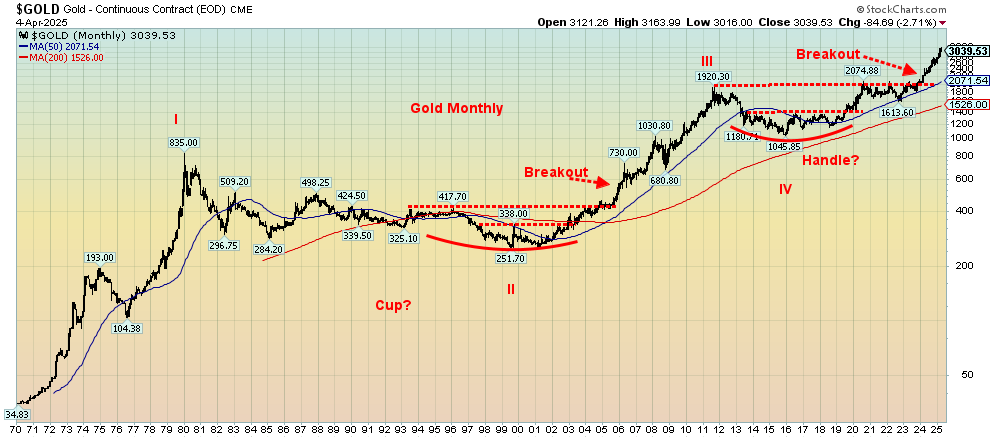
Our long-term chart of gold shows the breakouts that occurred in 2004–2005 from a huge base and as well the
breakout from what appears as a possible cup and handle pattern. The pattern, which is not a classic cup and handle, projects up to at least $3,000, which we have already hit. Potential further targets are up to $3,700. We appear to be working on what may be a fifth wave to the upside that started back in the 1970s. So far, this wave appears to have completed two waves with the first ending at $2,075 in 2020 that started at $1,045 in 2015. The correction into 2022–2023 was wave 2. So this should be wave 3 up with a wave 4 (corrective) and 5 to come. The question is, have we topped for wave 3? Any corrective wave must hold above $2,100 to be valid. On the other hand, this could just be a pullback within the context of wave 3 up. A miniumum correction could take us back to around $2,600. That’s why the points at $3,000 and $2,900 are important. We prefer to hold above these points or the correction could be steeper. We should be in the up cycle of the current 7.8 year cycle that last bottomed in October 2022. A normal cycle correction would target 2025 for a low. Hence, watch the key points. Irrespective of this, a correction that takes us into May and even into July appears to be underway. But gold might respond to the unknowns that lie ahead.
Source: www.stockcharts.com
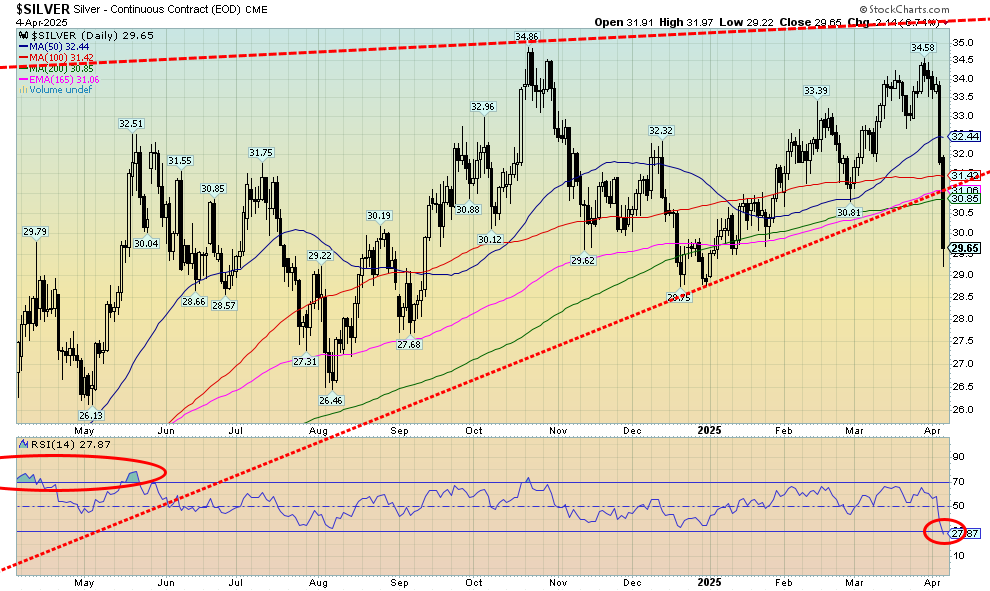
Ugly, thy name is silver. It seems rather perverse that silver could be so beat up, despite being in shortage. But alas, the paper market, which is estimated to be 200–300 times larger than the physical market, rules. Given its industrial use, the desire is to keep prices low. The paper silver market does its job. Short squeeze? More like a long panic. Silver plunged 13% this past week, one of its worst wipeouts ever. Maybe the clue was gold making new all-time highs but silver failing its October high. Tellingly, silver was hit harder during the 2008 financial crisis and the pandemic than was gold. Silver tends to lead to the upside and to the downside. This week it proved the downside in spades. We suppose it is good news that the RSI has plunged under 30, meaning we are now oversold. But that is merely a state and does not tell us we can’t fall even further. We have broken that uptrend line and only that December 2024 low near $28.75 stands in the way of even lower prices. Arguably, we could say we made a double top and targets could be down to around $25. Regaining $32 would be positive, but only new highs and a breakout over now $36 tell us this is over.
Source: www.stockcharts.com
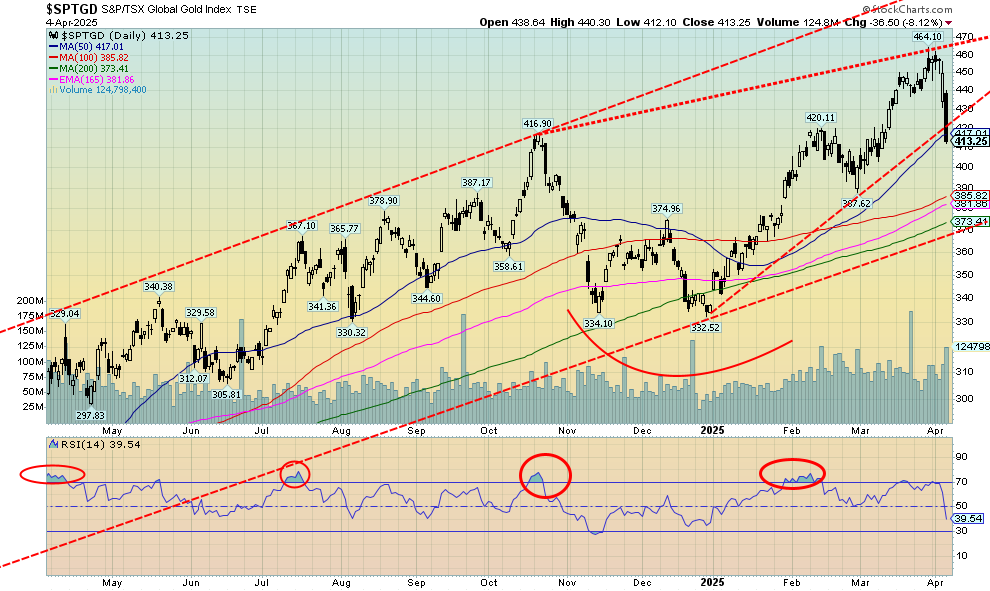
Ugly is the only word we can use to describe the fall in the gold stocks on Friday after Thursday’s less than expected drop. Still, the gold stock indices wiped out a chunk of their gains’ year to date with this past week’s fall. That’s the bad news. The good news is they are still positive on the year. The broader stock market can’t say that. This past week the TSX Gold Index (TGD) dropped 8.5% while the Gold Bugs Index (HUI) fell 9.3%. Both fell into the vicinity of the 50-day MA. But the TGD could be breaking down from an ascending wedge triangle with targets down to 288. Still, there are good support levels before getting to that low and that may be an extreme. A solid close under 400 could send us to 370–385 support. The record high at 464 was made on March 28. On April 1 it attempted to take that level out but failed. Then came the deluge with few prepared for what happened. The RSI tingled with overbought at 70, but we never became seriously overbought. With an RSI at 39 on Friday, we have room to move lower before becoming oversold. The action this week came unexpectedly but was predictable, given what happened elsewhere. During the 2008 financial crisis and the pandemic, gold stocks were hit hard, even worse than the broader stock market but recovered quickly once they found their bottom. It's a rather thin market so moves either way can be exaggerated. That was even as the rise from that December 2024 low to the high was orderly. The drop this week has all the earmarks of a shakedown and not the start of something bigger.
Read the FULL report here: Technical Scoop: Tariff History, Index Lows, Gold Holds
Disclaimer
David Chapman is not a registered advisory service and is not an exempt market dealer (EMD) nor a licensed financial advisor. He does not and cannot give individualised market advice. David Chapman has worked in the financial industry for over 40 years including large financial corporations, banks, and investment dealers. The information in this newsletter is intended only for informational and educational purposes. It should not be construed as an offer, a solicitation of an offer or sale of any security. Every effort is made to provide accurate and complete information. However, we cannot guarantee that there will be no errors. We make no claims, promises or guarantees about the accuracy, completeness, or adequacy of the contents of this commentary and expressly disclaim liability for errors and omissions in the contents of this commentary. David Chapman will always use his best efforts to ensure the accuracy and timeliness of all information. The reader assumes all risk when trading in securities and David Chapman advises consulting a licensed professional financial advisor or portfolio manager such as Enriched Investing Incorporated before proceeding with any trade or idea presented in this newsletter. David Chapman may own shares in companies mentioned in this newsletter. Before making an investment, prospective investors should review each security’s offering documents which summarize the objectives, fees, expenses and associated risks. David Chapman shares his ideas and opinions for informational and educational purposes only and expects the reader to perform due diligence before considering a position in any security. That includes consulting with your own licensed professional financial advisor such as Enriched Investing Incorporated. Performance is not guaranteed, values change frequently, and past performance may not be repeated.
About the author


Website: https://www.enrichedinvesting.com
Disclaimer: David Chapman is not a registered advisory service and is not an exempt market dealer (EMD) nor a licensed financial advisor. We do not and cannot give individualised market advice. David Chapman has worked in the financial industry for over 40 years including large financial corporations, banks, and investment dealers. The information in this newsletter is intended only for informational and educational purposes. It should not be considered a solicitation of an offer or sale of any security. The reader assumes all risk when trading in securities and David Chapman advises consulting a licensed professional financial advisor before proceeding with any trade or idea presented in this newsletter. David Chapman may own shares in companies mentioned in this newsletter. We share our ideas and opinions for informational and educational purposes only and expect the reader to perform due diligence before considering a position in any security. That includes consulting with your own licensed professional financial advisor.