Excerpt from this week's: Technical Scoop: Tariff Spook, Precious Performance, Consumer Depth
Source: www.stockcharts.com
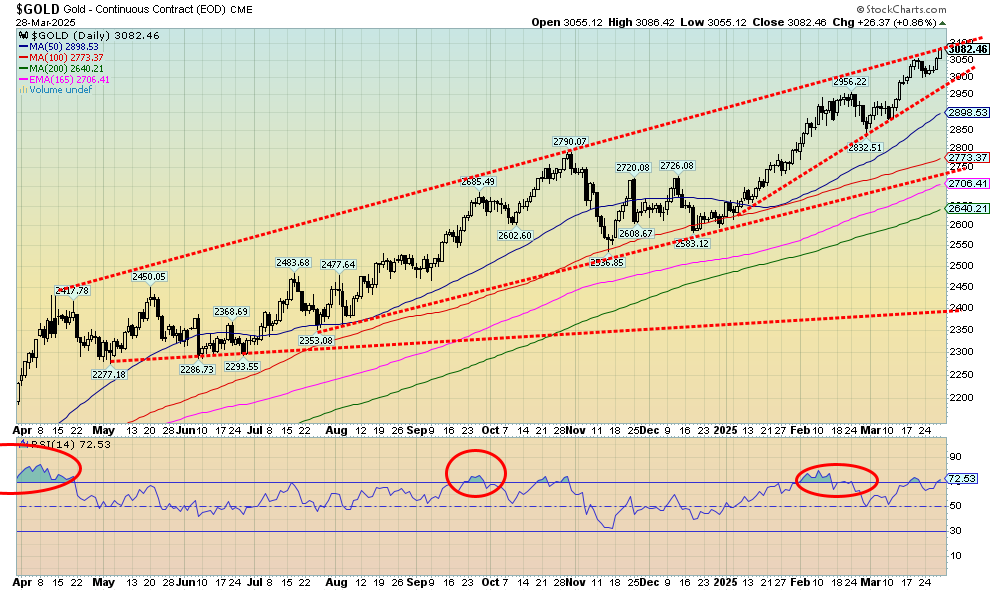
You have to love it. The talking heads at CNBC, BNN, etc. are finally starting to take notice of gold. As the stock market tanks and the MAG7 are imitating themselves only to the downside, gold has been rising. Even if gold had just stood still, it would be easily beating the stock market. But instead, gold is up 16.7% on the year, silver up 16.5%, and the gold stocks are double that. Once again, gold hit new all-time highs but fell short of the next magic number at $3,100. Nonetheless, as we keep saying, gold is the go-to asset in times of geopolitical tensions, economic uncertainty, and loss of faith in government. Right now, we are getting that in spades. But nobody seems to notice. Well, yes, they do but they are in Asia, especially China and India. And to a lesser extent in Europe that has had its share of geopolitical tensions and government issues numerous times in the past century. North Americans may be waking up. Gold as a percentage of global assets was a mere 0.5% and silver even less at 0.01% of global assets. But that was back in 2015. Is it any better today? Possibly, but not by much.
When we talk of gold (and silver), we are always referring to the metal. Gold stocks are separate and have different issues than the metals themselves. Gold is responding to the expanding trade war. Chaos reigns in the world’s largest economy and that in turn is music to gold’s ears. Trump and trade wars trump everything else. On the week, gold rose 2.0%, silver was up 3.2%, and the badly lagging platinum rose 0.4%. Of the near precious metals, palladium was up 1.8% while copper hit all-time highs but then sold off, finishing up a small 0.2%. That probably signals a short-term top for copper.
But gold also may be at/near a short-term top. Our chart shows gold hitting the top of that bull channel. Lurking below is a disturbing-looking ascending wedge triangle which is normally bearish. Firmly busting through $3,100 would help ease things, but a breakdown under $3,000 now could prove to be the start of a bigger correction. Gold yearly cycles suggest weakness into the May/June/July period before a rebound gets underway. With an RSI that keeps poking its head above 70, taking some short-term profits on gold stocks might not be a bad idea. Just remember it’s a small market, so moves up and down can quickly become exaggerated. Two silver stocks of note were hit hard on Friday: Mag Silver (MAG/TO) and Aya Silver & Gold (AYA/TO). In theory, a break of that ascending wedge triangle could target down to $2,700.
Nonetheless, tariffs, trade wars, geopolitical tensions, and more should keep upward pressure on gold prices. And add in the signs of stagflation. A reminder that in the 1970s it was stagflation and Iran (geopolitical tensions) that helped send gold soaring over $800. Stagflation was giving way to economic uncertainty and loss of faith in the government to solve anything. Only Paul Volcker sending the Fed rate to 21% brought about the collapse of gold prices and the 1981–1982 severe recession.
Source: www.stockcharts.com
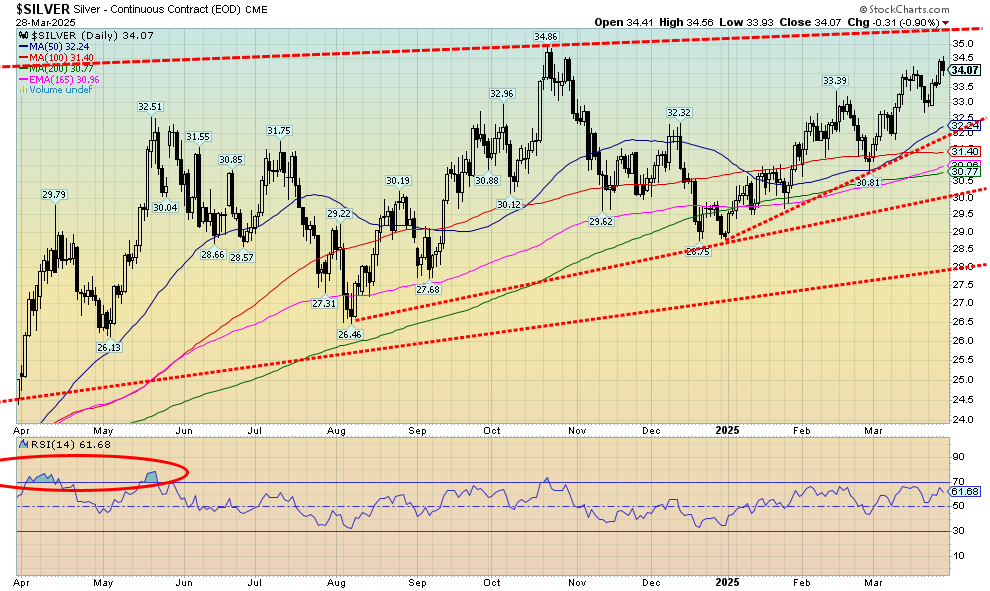
Silver bulls have to be the most masochistic bulls in the world. They have to sit around and watch gold make all-time highs while they remain $16 under their all-time high seen in 1980 and 2011. And that’s just on a nominal basis. Once again as gold made all-time highs this past week, silver fell short of even making fresh 52-week highs. It suggests we should, but we’re still waiting.
The paper silver market is 200 to 300 times the size of the physical market. That suggests for every ounce of physical silver there are 200 to 300 ounces of paper silver. Paper rules. There is supposedly a shortage of physical silver and demand is good, especially for the electrification in the green world, but paper suppresses the price. Possibly because of the high demand and need, it pays to keep the price down. But the bulls talk incessantly of a short squeeze. We’re still waiting. But if it happened, yes, silver could explode to the upside. It might even make Eric Sprott’s prediction of $300 silver a reality.
Silver rose 3.2% this past week and is up 16.5% on the year, but about all it is doing is keeping pace with gold when it should be leading. Nobody talks much about silver. However, it is an important element in our industrial world.
Breakout is still taking out $35, but the reality is we need a move above $35.50 to fully convince us. Targets then could be $40/$41. That’s still short of the 1980/2011 high. To the downside, we would not want a move under $32.50. Under $29, it’s all over and a bear market might ensue.
Source: www.stockcharts.com
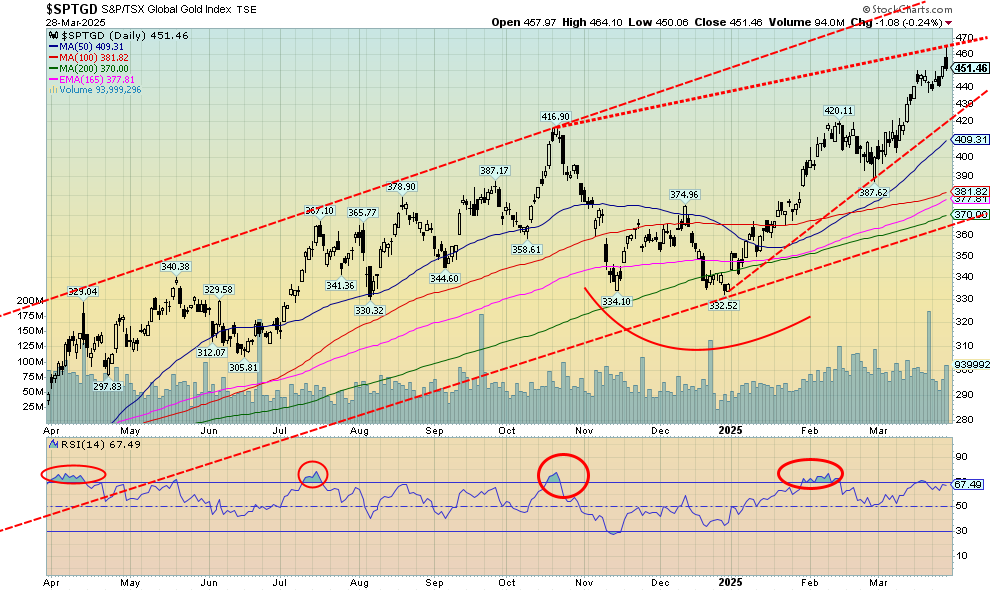
Yes, it finally did it. After 14 years, the TSX Gold Index (TGD) finally took out the 2011 high. Not by much, really. The high on the week was 464 vs. 455 in 2011. Of course, that’s nominal. On an inflation-adjusted basis we still have a way to go. That’s way up at 628, some 39% from current levels. Taking 14 years to get back to break even is not unusual. The DJI took 25 years to regain its 1929 high while the Tokyo Nikkei Dow took 34 years. Gold peaked in 1980 but it then took 28 years to equal that high. All that is on a nominal basis, not inflation- adjusted. Fourteen years is rather quick by comparison. As for the Gold Bugs Index (HUI)? Well, we are still waiting. The HUI is still down 44% from that 2011 high.
Take your victories where you can get them. This past week the TGD rose 2.1% and the HUI was up 2.0%. On the year, they are the big winners with the TGD up 34.1% and the HUI up 30.4%. The HUI at least made 52-week highs this past week. However, both sold off on Friday after initially going up to make those highs. A 700+ drop in the DJI probably leaned on the gold stocks as well. Margin calls? Could be. Or just lousy sentiment towards stocks.
That reversal on Friday may portend another correction in the precious metals. However, we have no expectation of a larger drop or the end of the current bull. We do seem to be forming a potential ascending wedge triangle, so we do have to be mindful of the potential for a steeper drop. For the TGD, the 420 area appears to be support. So, a drop through there would not be welcome. A move above 470 would end discussions of an imminent drop.
Read the FULL report here: Technical Scoop: Tariff Spook, Precious Performance, Consumer Depth
Disclaimer
David Chapman is not a registered advisory service and is not an exempt market dealer (EMD) nor a licensed financial advisor. He does not and cannot give individualised market advice. David Chapman has worked in the financial industry for over 40 years including large financial corporations, banks, and investment dealers. The information in this newsletter is intended only for informational and educational purposes. It should not be construed as an offer, a solicitation of an offer or sale of any security. Every effort is made to provide accurate and complete information. However, we cannot guarantee that there will be no errors. We make no claims, promises or guarantees about the accuracy, completeness, or adequacy of the contents of this commentary and expressly disclaim liability for errors and omissions in the contents of this commentary. David Chapman will always use his best efforts to ensure the accuracy and timeliness of all information. The reader assumes all risk when trading in securities and David Chapman advises consulting a licensed professional financial advisor or portfolio manager such as Enriched Investing Incorporated before proceeding with any trade or idea presented in this newsletter. David Chapman may own shares in companies mentioned in this newsletter. Before making an investment, prospective investors should review each security’s offering documents which summarize the objectives, fees, expenses and associated risks. David Chapman shares his ideas and opinions for informational and educational purposes only and expects the reader to perform due diligence before considering a position in any security. That includes consulting with your own licensed professional financial advisor such as Enriched Investing Incorporated. Performance is not guaranteed, values change frequently, and past performance may not be repeated.
About the author


Website: https://www.enrichedinvesting.com
Disclaimer: David Chapman is not a registered advisory service and is not an exempt market dealer (EMD) nor a licensed financial advisor. We do not and cannot give individualised market advice. David Chapman has worked in the financial industry for over 40 years including large financial corporations, banks, and investment dealers. The information in this newsletter is intended only for informational and educational purposes. It should not be considered a solicitation of an offer or sale of any security. The reader assumes all risk when trading in securities and David Chapman advises consulting a licensed professional financial advisor before proceeding with any trade or idea presented in this newsletter. David Chapman may own shares in companies mentioned in this newsletter. We share our ideas and opinions for informational and educational purposes only and expect the reader to perform due diligence before considering a position in any security. That includes consulting with your own licensed professional financial advisor.