Excerpt from this week's: Technical Scoop: Trump Indicators, Market High, Metals Sell

Source: www.stockcharts.com
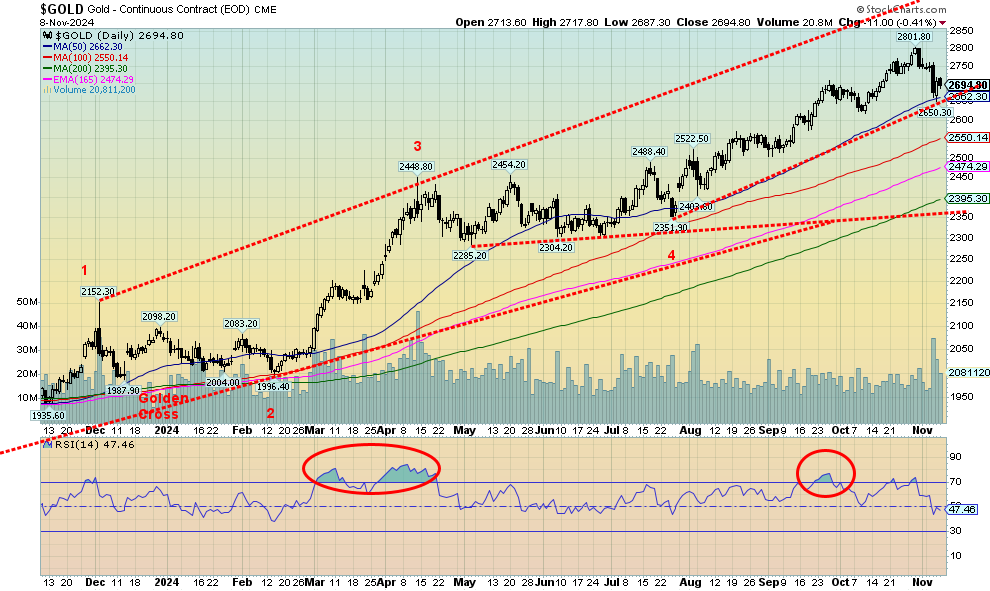
For the second week in a row gold fell, losing this time 2.0%. Silver was worse, down 3.8%. However, both remain up 30%+ on the year. The trend remains solidly to the upside. Platinum, whose performance is sluggish at best, fell 2.4% and is down 4.4% in 2024. Of the near precious metals, palladium lost 10.5% while copper was down 1.4%. The Gold Bugs Index (HUI) was off 1.7% while the TSX Gold Index (TGD) fell 1.9%. That generally the gold stocks held in on the week is one of the positives we gleaned from this week’s sell-off because normally the stocks get hit harder.
The culprit for the fall of gold? Continued strength in the U.S. economy and a soaring US$ Index, celebrating Trump’s victory. Trump’s promises on the surface are good for the U.S. dollar, but trade wars and more could end the celebration. Lower taxes and deregulation would also be bad for the U.S. dollar as the deficit is poised to rise, possibly substantially. All could unleash a new round of inflation, putting pressure on the Fed to hike rates even as Trump wants the Fed to them. Fed Chair Jerome Powell’s declaration that he can’t be fired (he’s right) is small comfort to a president who would have no hesitation in opening a brawl with him. BTW, Trump appointed Powell. But it’s based on recommendations and a vote from the Fed Board of Governors who wield the power. A massive increase in debt would be music to gold’s ears. Even in Trump’s first term, gold gained over 60% but then so did the SPX. Gold also responds positively to geopolitical risks. A reminder that, just because Trump was elected, that doesn’t end the culture wars and the huge political divide in the U.S. today.
We are a bit concerned that, because gold closed under $2,700 this past week, we could have more downside before we return to the upside. A break now of $2,650 the week’s low could trigger further selling to $2,600 or even down to $2,550 and the 100-day MA. It can’t be ruled out unless we regain back above $2,750 first. With move above $2,770 a new high is probable.
The strong U.S. dollar this week was bad news for gold as gold usually moves inversely to the U.S. dollar. But gold gains against other currencies that lose value to the U.S. dollar. Didn’t work this week, however, as gold in Cdn$ fell 2.3% while gold in euros was off 0.7%.
For the short term, we are a little negative towards gold, but long term we remain quite bullish. As we’ve noted many times, pullbacks like this are healthy in a bull market. You just don’t want it to break under key points. And right now, that point is $2,550 that could trigger a sharper decline to $2,400. Under $2,350, the decline could get worse.

Source: www.stockcharts.com
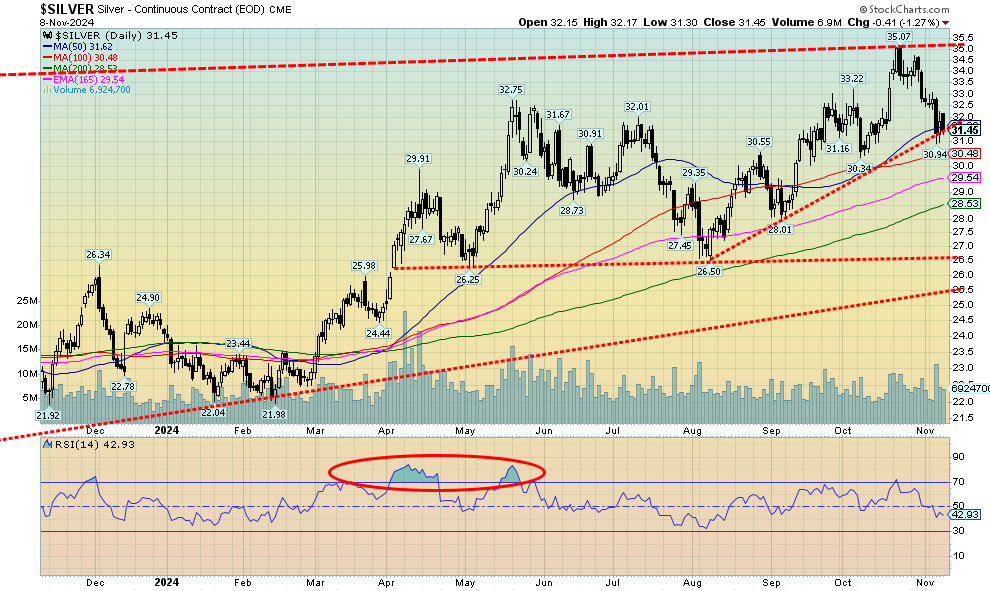
Silver as usual followed gold lower this past week, but the drop was worse. Silver fell 3.8%, far outpacing gold’s decline of 2.0%. Silver remains up 30% in 2024; however, we are down 10.3% from the recent high near $35. That is correction territory. We thought we were breaking out when we leaped to $35, but so far it hasn’t held and we did not like the fact we dropped back under $32. Still, we are only testing that uptrend line from the August 2024 low. However, we wouldn’t want to see it break. Another break under $31 would not be good and then we could fall to $29.50/$30.00. We regain back above $33 and new highs could be in order above $34. We’ll see this week against the backdrop of the CPI and PPI.

Source: www.stockcharts.com
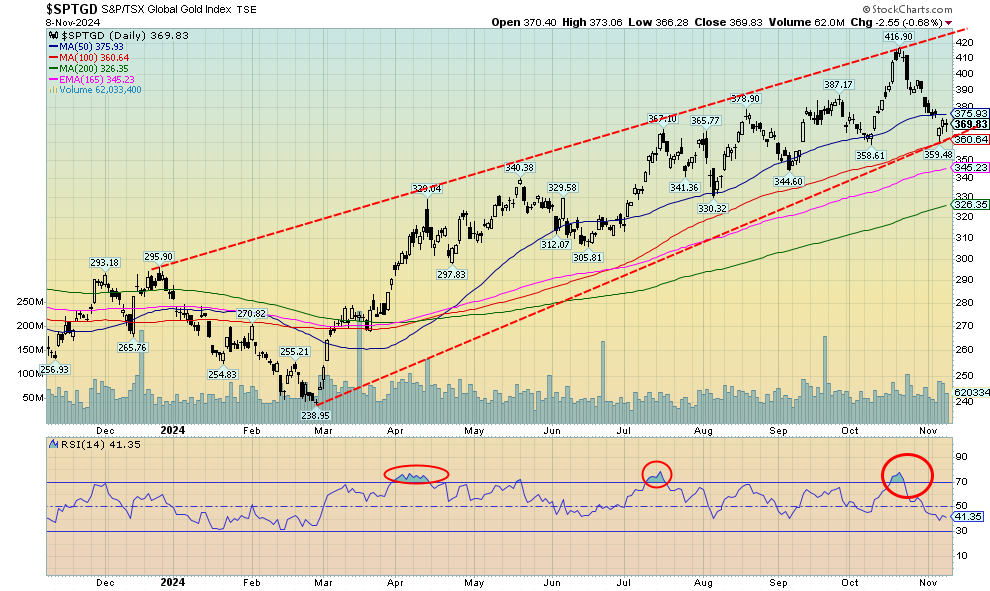
Like everything related to the metals this past week, gold stocks fell. The TSX Gold Index (TGD) was down 1.9% while the Gold Bugs Index (HUI) lost 1.7%. That’s the bad news. The good news is their fall relative to gold and silver was about the same as gold but better than silver. That they didn’t get hit harder is actually good news. We also finished the week on an uptrend line but below the 50-day MA and just above the 100-day MA at 360. Below that, the 165-day EMA lies at 345 and finally the 200-day MA is at 326. Those areas would also be support. In the volatile world of gold stocks, we are down about 11% from the recent high. That is a fairly normal type of correction. On the run to the 455 all-time high in 2011, there were a few drops of about 15%. So not unusual—so far. The volatility comes from their thin nature as outstanding stock for the public is low. Many companies are held in funds, insiders, and more. That stock doesn’t usually come out with any regularity. We need to regain 400 to suggest we’ve made a bottom, and 405 to suggest we could take out the recent high at 417. Remember, we are still up almost 30% on the year, so it’s not all bad.
Read the FULL report here: Technical Scoop: Trump Indicators, Market High, Metals Sell
Disclaimer
David Chapman is not a registered advisory service and is not an exempt market dealer (EMD) nor a licensed financial advisor. He does not and cannot give individualised market advice. David Chapman has worked in the financial industry for over 40 years including large financial corporations, banks, and investment dealers. The information in this newsletter is intended only for informational and educational purposes. It should not be construed as an offer, a solicitation of an offer or sale of any security. Every effort is made to provide accurate and complete information. However, we cannot guarantee that there will be no errors. We make no claims, promises or guarantees about the accuracy, completeness, or adequacy of the contents of this commentary and expressly disclaim liability for errors and omissions in the contents of this commentary. David Chapman will always use his best efforts to ensure the accuracy and timeliness of all information. The reader assumes all risk when trading in securities and David Chapman advises consulting a licensed professional financial advisor or portfolio manager such as Enriched Investing Incorporated before proceeding with any trade or idea presented in this newsletter. David Chapman may own shares in companies mentioned in this newsletter. Before making an investment, prospective investors should review each security’s offering documents which summarize the objectives, fees, expenses and associated risks. David Chapman shares his ideas and opinions for informational and educational purposes only and expects the reader to perform due diligence before considering a position in any security. That includes consulting with your own licensed professional financial advisor such as Enriched Investing Incorporated. Performance is not guaranteed, values change frequently, and past performance may not be repeated.


