Excerpt from this week's: Technical Scoop: Wobbly Markets, Golden Outlook, Copper Skids
Source: www.stockcharts.com
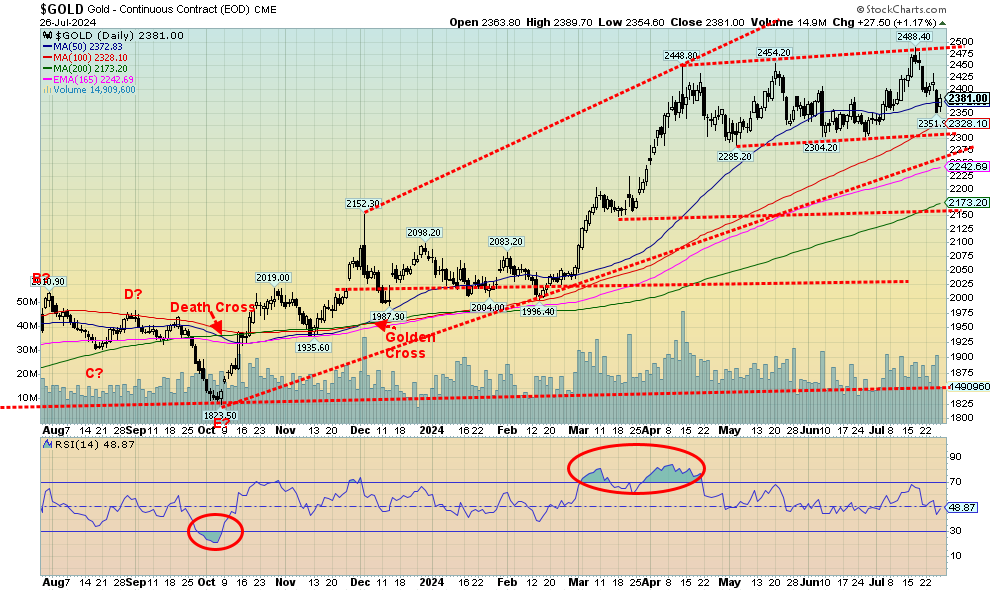
For the second consecutive week gold prices fell. We are now down over $100 from the all-time high set just seven days ago. We are holding above recent lows down near $2,300. On the week, gold fell 0.8%. But silver once again took it on the chin, falling 4.4%. Silver is still up 16.3% in 2024. Nonetheless, the weakness in silver suggests to us that this corrective period is not yet over. Silver fell to new lows for the current move, but gold did not. A potentially positive divergence? We’d actually prefer it the other way as strength in silver pulls gold higher.
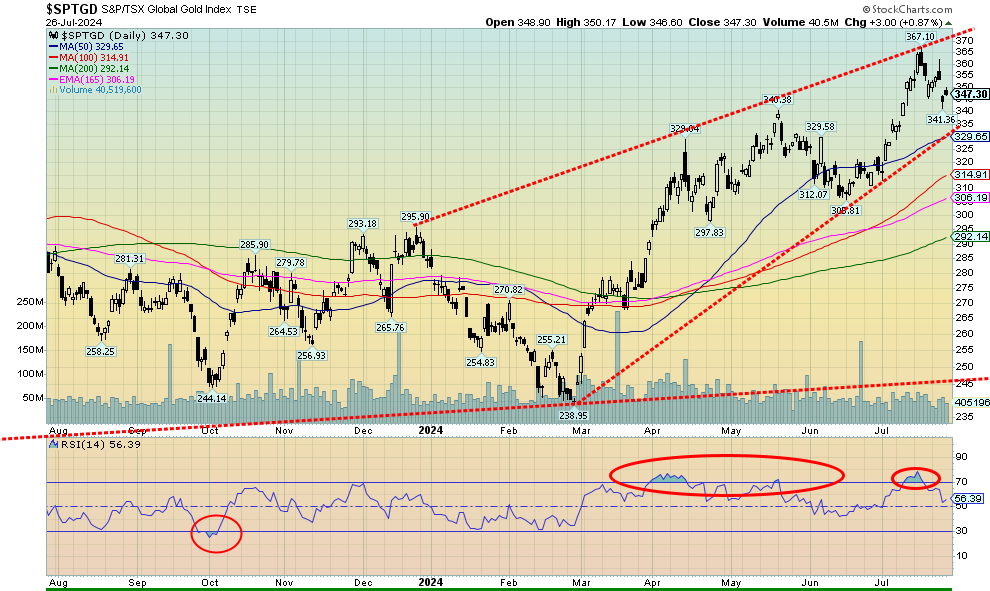
The rest of the precious metals market did not enjoy a good week, either. Platinum fell 3.0% and is now down 7.7% in 2024. Of the near precious metals, palladium fell 1.7% and copper dropped 2.8%. We continue to be positive on copper despite the drop we noted in our chart of the week. If there was a potential bright spot, it was the gold stocks. The Gold Bugs Index (HUI) fell 1.3% while the TSX Gold Index (TGD) dropped 1.1%. But both remain up 20%+ in 2024. With the gold stocks holding up so well, we view that as strength, suggesting to us this is just a correction and not the start of a bear market.
Despite the drop in gold, it responded positively to the PCE prices released on Friday. The PCE prices showed that inflation continues to moderate, even as it more or less remains above the Fed’s 2%. The Fed meets this coming week with the interest rate decision coming on Wednesday, July 31. It’s expected that the Fed will do nothing. Everyone is focused on the September meeting where it’s expected that the Fed will cut rates by at least 25 bp.
Many consider the Fed is behind because the BofC has already made two interest rate cuts. China recently cut rates as well. But that’s been about it. It is highly unlikely that the Fed would respond by knee jerk reaction to others cutting rates. The Fed makes their own decisions.
We learned that recently China slowed its gold purchases. We wouldn’t, however, read too much into that. It may just be a pause. China is the world’s largest gold producer. China continues to shed U.S. treasuries. The most recent figures available show that China sold off just over $2 billion in May. They are down about $78 billion year-over-year. But the world seems to be gradually shunning U.S. treasuries as total international holdings fell $19 billion in May and are down $8 billion over the past year. Doesn’t seem like much; however, the U.S. had to sell an additional $2.4 trillion in new debt this past year. Someone has to buy it. Most likely intra-government departments and some domestic holders like banks and insurance companies.
Gold’s pattern appears to us as a possible five-point reversal pattern. It comes in the form of ABCDE. If we are correct, this should be the E wave, the last one. Ideally, we’d like to see it hold above $2,300. After that low is found, we should resume the uptrend. We’ve been concerned about the poor performance of silver. However, we have to be pleased with the strong relative performance of the gold stocks. As you can see from the chart below, the TGD is holding up well with good support down to 330. We do keep reminding ourselves that the TGD is still down about 24% from its all-time high set in 2011. The HUI is worse, still down 54%. As we have pointed out many times, the gold stocks remain cheap relative to gold.
Source: www.stockcharts.com
Read the full report here: Technical Scoop: Wobbly Markets, Golden Outlook, Copper Skids
Disclaimer
David Chapman is not a registered advisory service and is not an exempt market dealer (EMD) nor a licensed financial advisor. He does not and cannot give individualised market advice. David Chapman has worked in the financial industry for over 40 years including large financial corporations, banks, and investment dealers. The information in this newsletter is intended only for informational and educational purposes. It should not be construed as an offer, a solicitation of an offer or sale of any security. Every effort is made to provide accurate and complete information. However, we cannot guarantee that there will be no errors. We make no claims, promises or guarantees about the accuracy, completeness, or adequacy of the contents of this commentary and expressly disclaim liability for errors and omissions in the contents of this commentary. David Chapman will always use his best efforts to ensure the accuracy and timeliness of all information. The reader assumes all risk when trading in securities and David Chapman advises consulting a licensed professional financial advisor or portfolio manager such as Enriched Investing Incorporated before proceeding with any trade or idea presented in this newsletter. David Chapman may own shares in companies mentioned in this newsletter. Before making an investment, prospective investors should review each security’s offering documents which summarize the objectives, fees, expenses and associated risks. David Chapman shares his ideas and opinions for informational and educational purposes only and expects the reader to perform due diligence before considering a position in any security. That includes consulting with your own licensed professional financial advisor such as Enriched Investing Incorporated. Performance is not guaranteed, values change frequently, and past performance may not be repeated.
About the author


Website: https://www.enrichedinvesting.com
Disclaimer: David Chapman is not a registered advisory service and is not an exempt market dealer (EMD) nor a licensed financial advisor. We do not and cannot give individualised market advice. David Chapman has worked in the financial industry for over 40 years including large financial corporations, banks, and investment dealers. The information in this newsletter is intended only for informational and educational purposes. It should not be considered a solicitation of an offer or sale of any security. The reader assumes all risk when trading in securities and David Chapman advises consulting a licensed professional financial advisor before proceeding with any trade or idea presented in this newsletter. David Chapman may own shares in companies mentioned in this newsletter. We share our ideas and opinions for informational and educational purposes only and expect the reader to perform due diligence before considering a position in any security. That includes consulting with your own licensed professional financial advisor.