
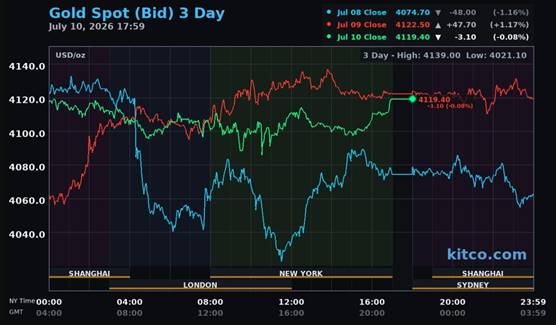
The gold price was forced to chop quietly sideways to a tad lower in Globex trading in New York on Thursday evening -- and until the 2:15 p.m. afternoon gold fix in Shanghai. It was then sold/engineered quietly lower until its spike low tick was set around 10:35 a.m. in COMEX trading in New York. Its ensuing rally ran into 'something' at 12:30 p.m. -- and it was sold a bit lower until 3 p.m. in after-hours trading. It then rallied rather smartly until the market closed at 5:00 p.m. EDT.
The high and low ticks in gold were reported as $4,144.60 and $4,081.70 in the August contract...an intraday move of $62.90 an ounce. The August/ October price spread differential in gold at the close in New York yesterday was $28.60...October/December was $31.30...December/February27 was $32.40 -- and February/April27 was $31.20 an ounce.
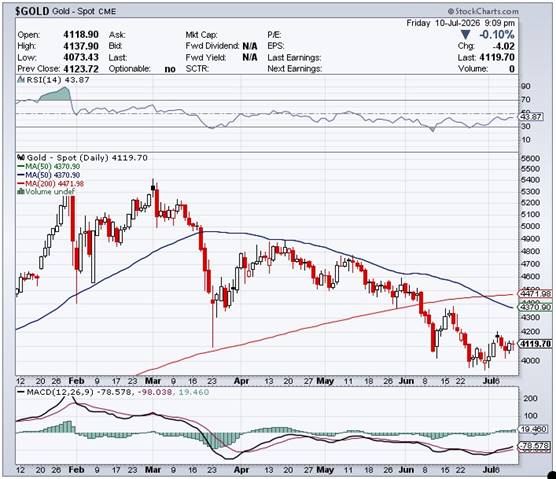
Gold was closed on Friday afternoon in New York at $4,119.40 spot...down only $3.20 on the day -- and $46.80 off its Kitco-recorded low tick. Net volume was deep into fumes & vapours territory at a bit over 66,500 contracts -- and there were a bit over 32,000 contracts worth of roll-over/switch volume out of August and into future months.
I saw that 389 gold, plus 73 silver contracts were traded in June yesterday and, as is always the case, it remains to be seen just how much of these amounts show up in tonight's Daily Delivery and Preliminary Reports further down in today's column. Spoiler alert...none of it.
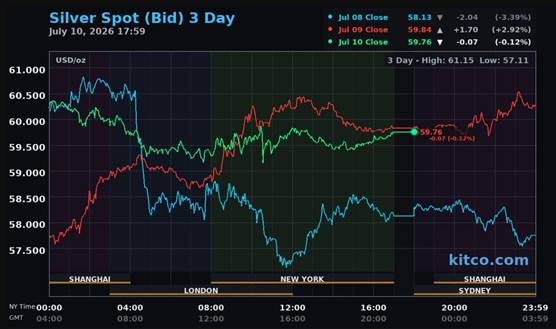
Silver's high tick was set around 11:15 a.m. in Shanghai on their Friday morning -- and it was quietly and a bit unevenly down hill from that juncture until at or just after the noon silver fix in London. It then chopped quietly and unevenly higher from that point until around 12 o'clock noon in COMEX trading in New York. It then had a very quiet and slightly descending down up move that lasted until trading ended at 5:00 p.m. EDT.
The high and low ticks in silver were recorded by the CME Group as $61.195 and $59.245 in the September contract...an intraday move of $1.95 the ounce. The July/ September price spread differential in silver at the close in New York yesterday was only 35.6 cents...September/December was 66.9 cents -- and December/ March27 was 67.7 cents an ounce.
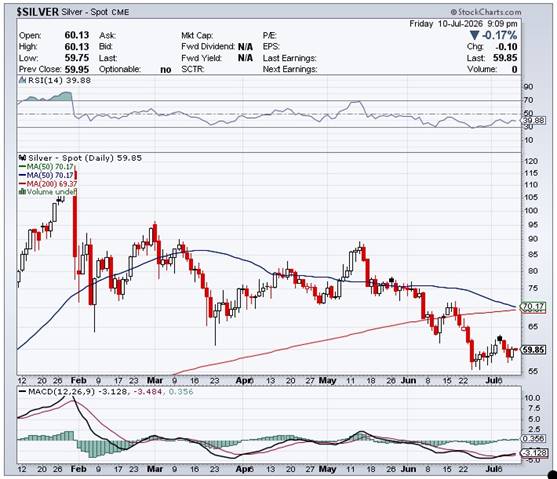
Silver was closed in New York on Friday afternoon at $59.76 spot...down only 7 cents from Thursday's close -- and $1.02 off its Kitco-recorded engineered price spike low tick. Net volume was microscopic at around 20,800 contracts -- and there were around 3,350 contracts worth of roll-over/switch volume in this precious metal...mostly into December.

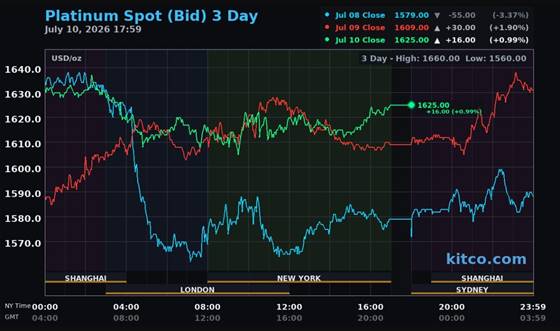
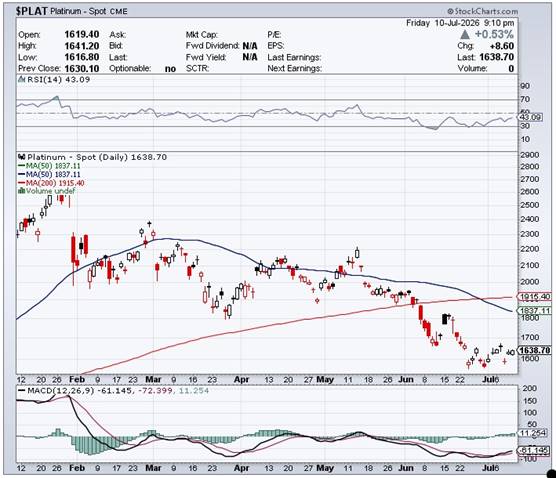
Platinum was sold a bit lower until very shortly before China opened on their Friday morning -- and its high tick was set the same time as silver's...around 11:15 a.m. CST...a price it revisited at the 2:15 p.m. afternoon gold fix in Shanghai. It was then sold lower until around 10:40 a.m. in Zurich...rallied until 12:30 p.m. CST -- and from there it chopped lower until its low tick was also set around 10:35 a.m. in COMEX trading in New York. It then chopped/wandered quietly and unevenly higher until the market closed at 5:00 p.m. EDT. Platinum was closed at $16.25 spot...up 16 dollars from Thursday -- and 23 bucks off its Kitco-recorded low tick.
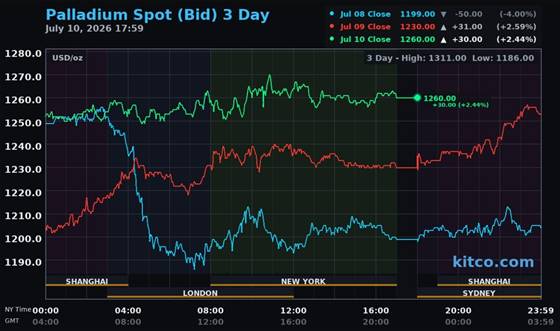
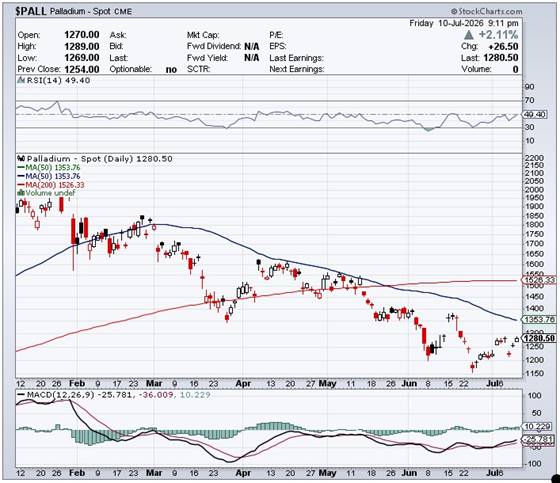
Palladium also rallied until around 11:15 a.m. CST on their Friday morning -- and then chopped broadly sideways until it began to chop a bit higher shortly after the COMEX opened in New York, with its high tick coming about ten minutes before the 11 a.m. EDT Zurich close. It was sold a bit lower over the next ten or minutes -- and then wandered/chopped quietly sideways until the market closed at 5:00 p.m. EDT. Palladium was closed at $1,260 spot...up 30 bucks on the day -- and 31 dollars off its Kitco-recorded low tick.
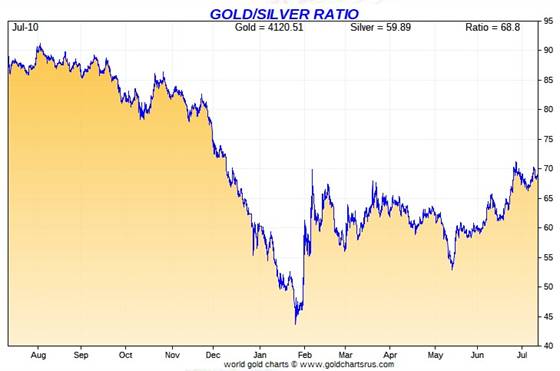
Based on the kitco.com spot closing prices in silver and gold posted above... the gold/silver ratio worked out to 68.9 to 1 on Friday...unchanged from Thursday.
Here's the 1-year Gold/Silver Ratio chart from Nick Laird -- and updated with this past week's data. Click to enlarge.
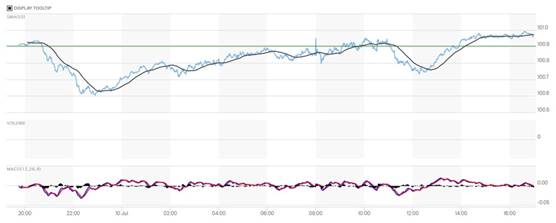
The dollar index closed very late on Thursday afternoon in New York at 100.90 -- and then opened higher by 1 basis point once trading commenced at 7:45 p.m. EDT on Thursday evening...which was 7:45 a.m. China Standard Time on their Friday morning. It didn't do much until it began to head sharply lower staring around 8:40 a.m. CST -- and that lasted until 10:55 a.m. CST. It then crawled/ chopped very quietly higher until 10:55 a.m. in New York -- and then sank until it appeared to get saved at 12:15 p.m. It was 'rallied' back above the unchanged mark until 2:45 p.m. -- and didn't do anything after that.
The dollar index finished the Friday trading session in New York at 100.97...up 7 basis points from its close on Thursday.
Here's the DXY chart for Friday...thanks to marketwatch.com as usual. Click to enlarge.

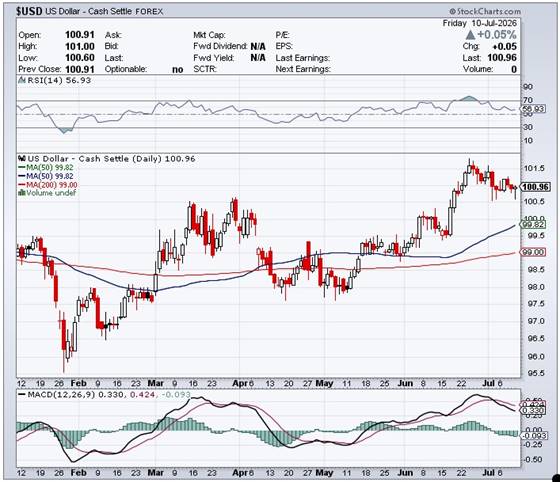
Here's the 6-month U.S. dollar index chart...courtesy of stockcharts.com as usual. The delta between its close...100.96...and the close on DXY chart above, was 1 basis point below that. Click to enlarge.
A case can certainly be made that the precious metals 'reacted' to what the dollar index was doing in gold and silver at least. But it was obvious from the price action in New York that 'da boyz' weren't going to allow either silver or gold close up on the day.
U.S. 10-year Treasury: 4.5690%...up 0.0300/(+0.66%)...as of the 1:59:54 p.m. CDT close
The yield on the ten-year had a broad up/down up move until it ran into a brick wall at 12:38 p.m. CDT/1:38 p.m. EDT -- and wasn't allowed to get higher than that.
For the week, the ten-year closed higher by a net 8.40 basis points...but would have been far more than that if they Fed hadn't intervened when they felt it necessary.
Here's the 5-year 10-year U.S. Treasury chart from the yahoo.com Internet site -- which puts the current yield into a somewhat longer-term perspective. Click to enlarge.
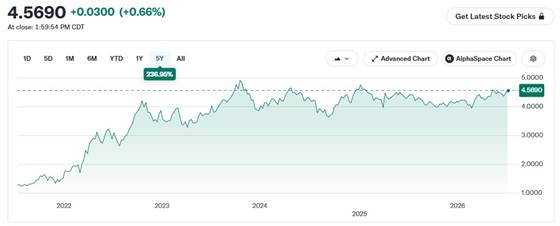
It still hasn't been allowed to take out its 4.92% high of October 15, 2023 -- and it's more than obvious that if the Fed hadn't been mucking about in the treasury market, it's yield would be comfortably above that mark by now. It managed to close above 4.50% again this week -- and it will be of some interest to see if the Fed will allow that to last. They didn't allow it the last time it happened.

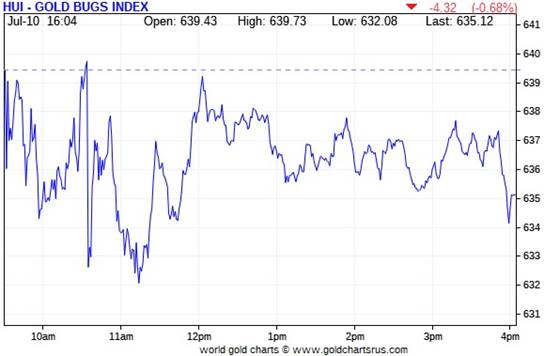
The gold equities opened down a bit once the markets opened at 9:30 a.m. in New York on Friday morning -- and then proceed to chop unevenly and somewhat wildly sideways to a tad lower until trading ended at 4:00 p.m. EDT. The HUI closed down 0.68 percent.
The silver stocks also traded a bit lower in the same choppy price path as the gold shares. Nick Laird's Silver Sentiment Index closed lower by 0.35 percent. Click to enlarge.
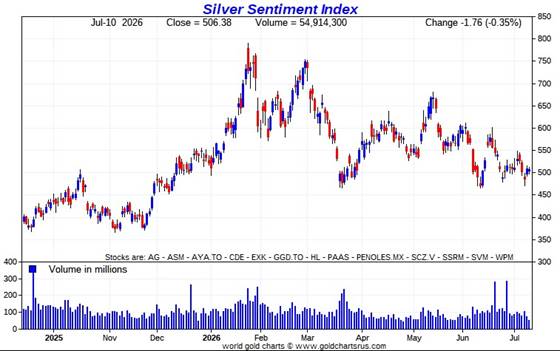
The star was GoGold Resources, up 2.57 percent...most likely on their earnings news posted in Friday's column. The two biggest underperformer were Endeavour Silver and SSR Mining...closing lower by 1.94 and 1.96 percent respectively.
I didn't see any news of any of the thirteen silver companies that make up the above index.
Silver was closed lower by 0.12% on Friday -- and Nick's Silver Sentiment Index finished the day down 0.35%. Sprott's PSLV finished the day lower by 0.36%
Gold closed lower by 0.08%...the HUI closed down 0.68% -- and Sprott's PHYS closed lower by 0.29%
The Shanghai/U.S. price premium in silver was 11.78 percent on their Friday.
The reddit.com/Wallstreetsilver website, now under 'new' and somewhat improved management, is linked here. The link to two other silver forums are here -- and here.

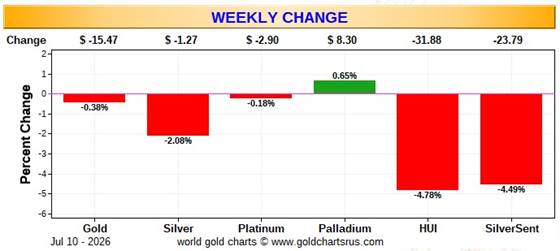
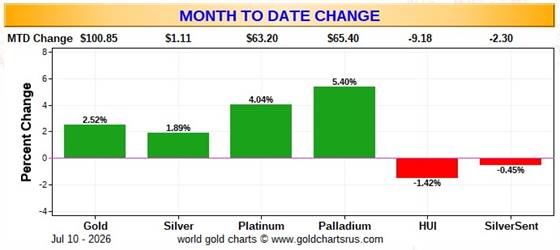
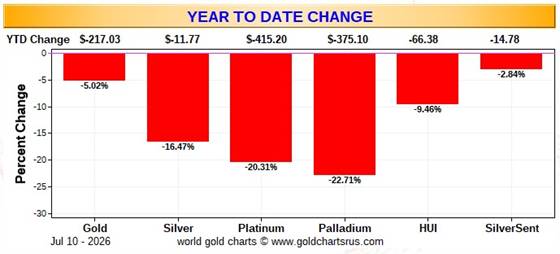
Here are the usual three charts that appear in this spot in every weekend missive. They show the changes in gold, silver, platinum and palladium in both percent and dollar and cents terms, as of their Friday closes in New York — along with the changes in the HUI and the Silver Sentiment Index.
Here's the weekly chart -- and it's pretty much wall-to-wall red this week as well. Of note once again is the 'outperformance' of the silver shares vs. the silver price...compared to the gold stocks vs. the gold price. It remains stark. Click to enlarge.
Here's the month-to-date chart -- and it contains just one extra day of data compared to the weekly chart -- and was the big 'up' day we had on July 3, going into the Independence Day holiday in the U.S. Click to enlarge.
Here's the year-to-date chart -- and there's no green to be seen but, once again, the standout is how well the silver equities have held up, despite the fact that the commercial traders have its underlying precious metal down a bit over 16% on the year. All three of these charts are collateral damage when 'da boyz' are running one of their patented 'wash, rinse & spin' cycles in the Globex/COMEX futures market. It's of great interest that the silver shares are outperforming the metal itself by as much as they are -- and may be directly connected to my discussion in The Wrap. But it doesn't explain why the gold equities are underperforming by as much as they are. Click to enlarge.
Despite the fact that silver has now broken the $120 barrier...albeit briefly -- and the silver well in London came close to running dry last October...the gold/silver ratio remains at a farcical 68.9 to 1 as of Friday's close. The 'normal' and historical ratio is around 15 to 1...which would put silver at a bit under $275 based on gold's closing price on Friday. And if priced at the ratio of 7:1 that it comes out of the ground at...compared to gold...that would put silver at a bit under $590 an ounce. So a rather impressive triple-digit silver price is in our future...most likely somewhere between those two numbers.
As I say in this spot every Saturday...all that remains to be resolved is what that price will be -- and how soon 'da boyz' allow it to happen. Its first attempt to reach one of these values back at the end of January was obviously crushed ...as were all the rest since then. But in the face of the continuing structural deficit in silver -- and all the other stuff going on in the world today, they can't keep it up forever. There's more on this in The Wrap.

The CME Daily Delivery Report for Day 10 of July deliveries showed that 221 gold -- plus 135 silver contracts were posted for delivery within the COMEX-approved depositories on Tuesday.
In gold, the two short/issuers were Deutsche Bank and ADM...issuing 201 and 20 contracts out of their respective client accounts. The three biggest long/ stoppers of the four in total were Australia's Macquarie Futures, French bank BNP Paribas -- and Wells Fargo Securities...picking up 97, 87 and 32 contracts respectively...Wells Fargo for their house account.
In silver, the three largest short/issuers were RBC [Royal Bank of Canada] Capital Markets, British bank HSBC and Wells Fargo Securities...issuing 58, 54 and 15 contracts respectively...Wells Fargo from their house account. The biggest long/stopper was JPMorgan, picking up 54 contracts for clients. The next three down the list were BofA Securities, RBC Capital Markets and Citigroup...stopping 28, 19 and 11 contracts -- and all for their respective house accounts. Deutsche Bank picked up 9 contracts for its house account as well.
In copper, a further 553 contracts/13.825 million pounds were issued and stopped...for a total of 8,267 COMEX contracts/206.675 million pounds month-to-date.
The link to yesterday's Issuers and Stoppers Report is here.
Month-to-date there have been 9,775 gold contracts issued and stopped -- and that number in silver is 5,948 COMEX contracts.
On First Day Notice, there were 7,493 gold contracts still open for July -- and in silver that number was 7,422 COMEX contracts. So there have already been more gold contracts issued and stopped in July than were posted for delivery on First Day Notice. But silver deliveries have some ways to go to get to 7,422 contracts...if they make it at all. This is disappointing, considering that July is a scheduled delivery month for silver, but not for gold.
The CME Preliminary Report for the Friday trading session, showed that gold open interest in July dropped by 58 contracts, leaving 255 still around ...minus the 221 contracts out for delivery on Tuesday as per the above Daily Delivery Report. Thursday's Daily Delivery Report showed that only 7 gold contracts were actually posted for delivery on Monday, so that means that 58-7=51 more gold contracts vanished from July deliveries.
Silver o.i. in July fell by 213 contracts, leaving 1,482 still open...minus the 135 contracts out for delivery on Tuesday as mentioned a bunch of paragraphs ago. Thursday's Daily delivery report showed that 115 silver contracts were actually posed for delivery on Monday...so that means that 213-115=98 more silver contracts disappeared from the July delivery month.
There have been a huge number of gold and silver contracts vanish from the July delivery month since First Day Notice...especially in the latter -- and I'm not sure what should be made of it. However, I am totally underwhelmed.
Total gold open interest for the Friday trading session in last night's Preliminary Report increased by 3,870 COMEX contracts -- but total silver o.i. fell by 16 contracts.
[I checked the final change in total open interest for gold for Thursday -- and it showed a decent decrease...from +4,981 COMEX contracts, down to +2,845 contracts. The final change in total silver o.i. for Thursday also showed a decrease...from +1,802 contracts, down to +1,460 COMEX contracts.]
Silver open interest in August in Friday's final report for Thursday rose by 64 contracts, leaving 2,008 still open. August gold open interest fell by a further 9,740 contracts...down to 251,553 COMEX contracts still open.

There were a net 102,840 troy ounces of gold removed from GLD -- and a net 575 troy ounces was withdrawn from GLDM. There were no reported changes in SLV.
The latest short report...for positions held at the close of trading on Tuesday, June 30...showed up on The Wall Street Journal's website yesterday afternoon. It showed only a small decline in the short position in SLV...from 32.00 million shares/troy ounces, down to 30.77 million shares/troy ounces...a drop of 3.84% -- and 5.82% of total SLV shares outstanding.
This is still an outrageous short position -- and realistically should only be a third of that amount.
There isn't a single troy ounce of silver backing any of these shorted shares as the SLV prospectus requires -- and one can only imagine what the silver price would be if those short had to buy the physical silver to back them.
The short position in GLD had a bigger drop...from 15.66 million shares, down to 11.64 million shares...a decline of 11.64% -- and only 3.30% of the total SLV shares outstanding. This short position is of little concern, as there's enough physical gold around to cover this, if required.
The SLV borrow rate started the Friday session at 0.41% -- and ended at 0.48%...with 10.0 million shares available to short. The GLD borrow rate started the day at 0.47% -- and ended at 0.56%...with 5.2 million shares available.
In other gold and silver ETFs and mutual funds on Earth on Friday ...net of any changes in COMEX, GLD, GLDM and SLV activity, there were a net 471,181 troy ounces of gold removed -- and all because of the 538,208 troy ounces withdrawn from China's various gold ETFs. But a net 8,178,974 troy ounces of silver were added -- and all because of the 8,334,678 troy ounces that ended up in India's silver ETFs.
There was no in/out activity in gold over at the COMEX-approved depositories on the U.S. east coast on Thursday -- and piddling 578 troy ounces were transferred from the Eligible category and into Registered over at Brink's, Inc. The link to this is here.
There was some activity in silver, as 623,751 troy ounces were received -- and 591,206 troy ounces were shipped out...all of which departed Asahi.
The two 'in' amounts were the 324,211 and 299,539 troy ounces that showed up at Asahi and Manfra, Tordella & Brookes, Inc. respectively.
In the paper department, there were 295,039 and 75,106 troy ounces transferred from the Eligible category and into Registered over at Brink's, Inc. and Delaware respectively...no doubt going out for delivery real soon.
The link to Thursday's COMEX silver activity is here.
The Shanghai Futures Exchange updated their silver inventories as of the close of business on their Friday -- and it showed that a net 10,995 troy ounces/ 0.342 metric tonnes of silver were withdrawn... leaving their silver inventories at 26.687 million troy ounces/829.858 metric tonnes.

Here are the usual 20-year charts that show up in this space in every weekend column. They show the total amounts of physical gold and silver held in all known depositories, ETFs and mutual funds as of the close of business on Friday. Click to enlarge.
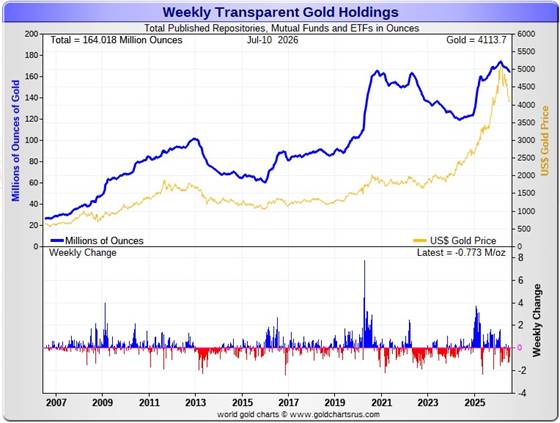
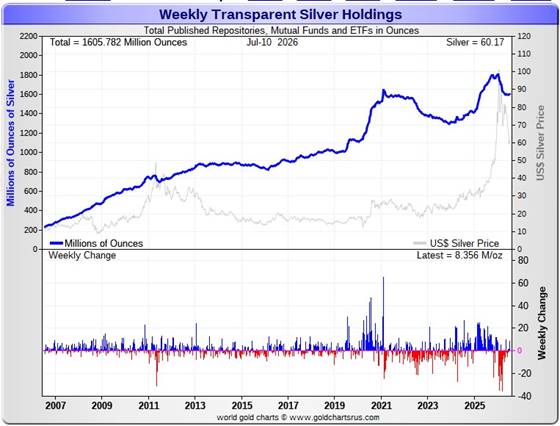
During the business week just past, there were a net and further 773,000 troy ounces of gold withdrawn -- but a net 8.356 million troy ounces of silver were added...mostly because of India.
According to Nick Laird's data on his website, a net 1.935 million troy ounces of gold were removed from all the world's known depositories, mutual funds and ETFs during the last four weeks. The only 'in' amount worth mentioning were the 135,515 troy ounces that went into UBS.
The largest two 'out' amounts by far were the 825,127 troy ounces that left the COMEX ...followed by the 538,208 troy ounces that departed China's gold ETFs. Next down the list were the 356,034 troy ounces withdrawn from SLV -- and the 316,417 troy ounces taken out of iShares/IAU.
The amount of gold in all the world's ETFs and mutual funds is now a bit below its old all-time high of late 2020...see the above chart. But it should be far higher...considering gold's current price...far more than double it was back then. I suspect it has everything to do with the 'everything bubble' in the equity markets -- and the current 'wash, rinse & spin' cycle by the collusive commercial shorts.
However, a surprising and net 10.065 million troy ounces of silver were added during that same 4-week time period.
The largest 'in' amount were the 8.335 million troy ounces into India...followed by the 6.654 million troy ounces into the COMEX.
The largest 'out' amounts were the 3.258 million oz. that left SLV...the 2.002 million oz. out of Aberdeen -- and the 1.092 million out of WisdomTree.
It should be noted that the amount of silver held in all these depositories, ETFs and mutual funds remains below its old all-time high inventory level of January 2021. But it should be far higher than it is as well, because silver is about 2.2x the price it was back then.
Back at its previous inventory peak in late January 2021, silver was around $27 an ounce. Now its about 33 bucks higher. Why the precious metal ETFs aren't doing better is a mystery for which I have few answers....except for what was mentioned a few paragraphs ago.
Retail demand remains comatose -- and there are no 'out of stock' signs over at all the retail bullion stores that I follow. They have decent stocks in just about everything they normally carry. The buy/sell spreads at most bullion stores remain a bit north of 10 percent -- and in the case of anything less than 0.999+ pure, it's far more than that. This obviously means that they have lots of stock -- and are not at all enthusiastic about buying anything.
COMEX silver withdrawals had been monstrous up until recently...135 million in Q1/2026...23 million oz. in April -- but only 12.6 million oz. in May -- and only 5.3 million oz. in June. As you can see, withdrawals from the COMEX have imploded in the last few months.
These amount don't include the 29.740 million oz. issued and stopped on the COMEX in the July delivery month so far. But this is not really silver demand per se...as all that's happening is that silver already sitting on the COMEX just changes ownership.
But silver demand from the COMEX can only go on for so long, as a huge chunk of silver sitting on the COMEX is owned privately in the Eligible category -- and not for sale or delivery. Just how much silver is actually available for shipment on demand to the LBMA of elsewhere, is unknown...but it's most certainly finite.
We're also well into the sixth year of a structural deficit in silver according to the ongoing reports from The Silver Institute. However, subscriber John Macintosh thinks it's far more than they're reporting -- and threw another b.s. flag on their latest report in his newest essay headlined "The Silver Institute: A Wonderland of Compounded Errors" -- and linked here.
The vast majority of precious metals being held in these depositories are by those who won't be selling until the silver price is many multiples of what it is today...if ever.
Sprott's PSLV is the third largest depository of silver on Planet Earth with 215.6 million troy ounces...unchanged for the last four weeks -- and a great distance behind the COMEX, which has now been demoted to the second largest silver depository, where there are 326.6 million troy ounces being held...up a net and further 3.2 million troy ounces over the last two weeks...but minus the 103 million troy ounces being held in trust for SLV by JPMorgan that Ted Butler found out about many years ago.
That 103 million ounce amount brings JPMorgan's actual silver warehouse stocks down to around the 35 million troy ounce mark...quite a bit different than the 137.9 million they indicate they have -- down a net 600,000 troy ounces over the last two weeks. They've parted with a lot of silver in the last eight or so months...around 76 million oz.
But that number doesn't include the silver that JPMorgan owns and has stored at the other COMEX-approved depositories. They've shipped out lots of that over the months and years...especially this year so far -- and a lot of it out of CNT.
PSLV remains a very long way behind SLV as well -- still the largest silver depository...with 478.1 million troy ounces as of Friday's close...down a net 2.5 million troy ounces over the last two weeks.
On a net basis since the latter parts of December -- and despite the big spike in the silver price at the end of January, just about every depository or ETF had been hemorrhaging silver. However, that outflow has declined precipitously over the last four months...as I pointed out a bunch of paragraphs ago regarding the COMEX.
The latest short report [for positions held at the close of business on Tuesday, June 30] showed that the short position in SLV declined by a tiny 3.84%...from the 32.00 million shares sold short in the prior report...down to 30.77 million shares in the latest short report that came out yesterday. This amount represents 5.82 percent of total SLV shares outstanding...still a bit obscene, but not nearly as bad as it was earlier in the year. Don't forget that there's no physical silver backing any of these shorted shares as the SLV prospectus requires.
BlackRock issued a warning more than ten years ago now to all those short SLV, that there might come a time when there wouldn't be enough metal for them to cover. That would only be true if JPMorgan decided not to supply it to whatever entity requires it. Those that remain short SLV shares are in equally dire straits as the Big 8 shorts in silver in the COMEX futures market -- and I suspect that they're the same entities.
The next short report...for positions held at the close of trading on Wednesday, July 15...will be posted on The Wall Street Journal's website on Friday, July 24.
Then there's that other little matter of the monster short position in silver held by Bank of America in the OTC market...with JPMorgan & Friends on the long side. Ted said it hadn't gone away. He wrote an article about this back in April 2021 headlined "A New Piece of the Puzzle" -- and linked here.
A while after that article came out, he also come to the conclusion that they're short around 25 million ounces of gold with these same parties as well. Once these short covering rallies in both silver and gold begin anew...we'll see if they need to get taken over, like Bear Stearns did back in 2008 -- and for the same reason. If that's the case, JPMorgan...their counterparty to these trades...will pick them up for next to nothing as well.
However, the latest report from the OCC below casts some doubt on Ted's thesis -- although I'm not at all qualified to say it's no longer valid.
The Office of the Comptroller of the Currency posted the precious metal derivatives of the four biggest U.S. banks for Q1/2026 on their website in the last week of June -- and I was somewhat taken aback by what it showed.
I should have actually said, what this report didn't show...as Bank of America has disappeared from the Big 4 -- and why it did, I'll get into in a bit, but it's very simple.
And what was almost equally amazing was the fact that the change from Q4/2025 to the end of March 2026 showed a decrease in the overall short positions of the U.S. banks in total. At the end of Q4/2025, the U.S. banks in total held precious metal derivatives of $830.54 billion. Three months later that number was down to $820.35 billion.
JPMorgan increased their derivatives position from $479.4 billion...up to $509.4 billion -- and Citigroup increased theirs from $217.2 billion, up to $235.6 billion. Goldman Sachs and Morgan Stanley hold piddling and irrelevant precious metal derivatives of $680 and $181 million dollars respectively...not even a rounding error in the grand scheme of things. Morgan Stanley wasn't even in this report at the end of 2025.
The other increase was in the 'Other U.S. commercial banks' category...from $12.6 billion, up to $74.5 billion...an increase of $61.9 billion from Q4/2025.
BofA's $120.7 billion derivatives position in the precious metals that they held at the end of Q4/2025 is nowhere to be seen in the latest Q1/2026 report -- and what was left of it is what showed up as that increase in the 'other U.S. commercial banks' category mentioned in the previous paragraph...around $61.9 billion worth.
The reason BofA no longer shows up as one of the Big 4 banks is because its totalderivatives position in all markets has fallen enough [below $55.562 TRILLION] to take it out of the Big 4 category -- and elevate Morgan Stanley into the No. 4 spot...even though it [and Goldman in No. 2 spot] have piddling short positions in the precious metals.
Here's the Q1/2026 data. Click to enlarge.
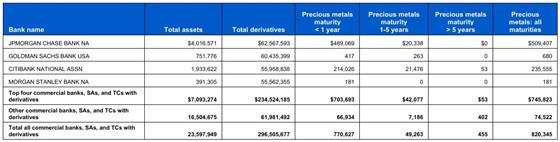
So, what this data tells us for sure, is that the U.S. division of 'da boyz' consists of JPMorgan, Citibank and BofA. Wells Fargo doesn't show up here, but I'm prepared to bet my entire net worth that if we could see their precious metal derivatives position...it would show that they are the fourth and smallest member of the U.S. division of 'da boyz'.
The other thing that this OCC report confirms is that neither Goldman Sachs or Morgan Stanley are card-carrying members of the Big 8 shorts in the precious metals.
But one thing that this report doesn't tell us, is whether these precious metals derivatives are held on the short side...or the long side. It's a given that virtually all of it is on the short side...but in the case of JPMorgan, I suspect they're no worse than market neutral in silver.

The Commitment of Traders Report, for positions held at the close of COMEX trading on Tuesday, July 7...showed tiny increases in the commercial net short positions in both silver and gold. In the case of silver, it was even less than the headline number that the Legacy COT Report shows below.
In silver, the Commercial net short position increased by a further 1,770 COMEX contracts...8.85 million troy ounces of paper silver.
They arrived at that number through the sale of 796 long contracts -- and they also sold/added 974 short contracts. It's the sum of those two number that represents their change for the reporting week.
Under the hood in the Disaggregated COT -- and with such small numbers, no category did much. The Managed Money traders decreased their net long position by 581 COMEX contracts -- and the trader in the Other Reportables and Nonreportable/small traders category both increased their net long position...the former by 1,228 contracts -- and the latter by 1,123 contracts.
Doing the math: 1,228 plus 1,123 minus 581 equals 1,770 COMEX contracts...the change in the Commercial net short position.
The Commercial net short position in silver now stands at 43,095 COMEX contracts/215.475 million troy ounces...up those 1,770 contracts from Monday's COT report.
The Big 4 collusive commercial traders reduced their net short position by an inconsequential 123 COMEX contracts, down to 33,764 COMEX contracts...still their largest short position since February 17.
The Big '5 through 8' increased their net short position for the second week in a row...them by a smallish 426 COMEX contracts...up to 14,156 contracts... about 1,500 contracts above their lowest short position I have records for.
The Big 8 commercial traders in total are net short 47,920 COMEX silver contracts...up an inconsequential 426-123=303 contracts on the week -- and also their largest short position since February 17.
But since the Big 8 shorts accounted for only 303 contracts of the increase in the Commercial net short position -- and the Commercial net short position rose by 1,770 COMEX contracts, that meant that Ted Butler's raptors, the 29 small commercial traders other than the Big 8, had to have been sellers during the reporting week -- and they were, decreasing their net long position by 1,770-303=1,467 COMEX contracts. They remain net long silver by 4,825 COMEX contracts.
The sale of these long contracts by Ted's raptors had the mathematical effect of increasing the Commercial net short position by those 1,404 contracts... which isn't an increase at all. When these small commercial traders are net long like they are now, it's only what the Big 8 commercial traders do that matters. It's been like that forever.
Here's the 3-year COT chart for silver thanks to Nick Laird -- and updated with the above data. Click to enlarge.
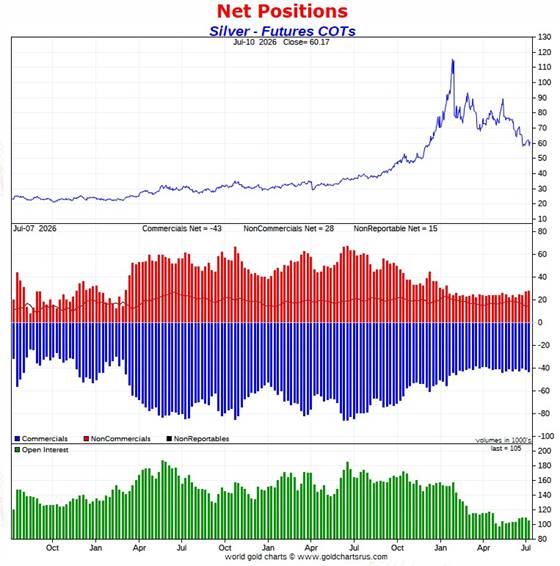
I'm glad I passed on what the COT Report might show for silver -- and even though the headline number was not a happy 1,770 contract increase in the Commercial net short position, it turned out that 1,404 contracts of that amount were the result of the sale of long contracts by Ted's raptors...which is only a mathematical increase, as I just stated above the chart.
The critical number was the increase in the short position of the Big 8 commercial traders -- and it only rose by an inconsequential 303 COMEX contracts. So, all in all, Friday's COT Report in silver was a big 'nothingburger.'
The net short position of the Big 8 commercial traders was a record low 43,407 contracts back on April 7 -- and despite the fact that they've engineered the silver price lower by around $15 since then...their net short position is now up to 47,920 COMEX contracts.
The Big 8 commercial traders are net short 45.7 percent of total open interest in silver in the COMEX futures market...up from the 43.7 percent they were short in Monday's COT Report. The reason for that increase was because total silver open interest fell by 4,105 COMEX contracts...about 4%...which obviously affects the percentage calculation.
I have no idea how things will unfold from here...but it's obvious that the Managed Money traders, et al. are digging in their heels and refusing to bow down to the wishes of the Big 8 shorts by selling longs, or going short by much more than the already have. I have more on this in The Wrap.
And despite the fact that the Big 8 collusive commercial traders are not holding a record short position, the set-up from a COMEX futures market perspective remains wildly bullish nonetheless.
In gold, the commercial net short position increased by an inconsequential 1,212 COMEX contracts...121,200 troy ounces of paper gold.
They arrived at that number by purchasing 446 long contracts...but also sold/ added 1,658 short contracts -- and it's the difference between those two numbers that represents their change for the reporting week.
Under the hood in the Disaggregated COT Report, the changes in categories were much larger. The Other Reportables and Nonreportable/small traders both added to their net long positions...the former by 4,157 COMEX contracts -- and the latter by 985 contracts. This meant that the Managed Money had to have added to their net long position, which they did to the tune of 3,930 COMEX contracts.
Doing the math: 4,157 plus 985 minus 3,930 equals 1,212 COMEX contracts ...the change in the commercial net short position, which it must do.
The Big 4 commercial traders increased their net short position by 3,024 COMEX contracts, up to 134,211 contracts -- and a bit over 12,000 contracts above their lowest short position that I have records for.
The Big '5 through 8' commercial traders increased their net short position by only 759 contracts, up to 64,689 COMEX contracts...the fourth week in a row that they have increased their net short position...their largest short position since January 20.
The Big 8 commercial traders in total are net short 198,900 COMEX contracts...up 3,783 contracts from Monday's COT Report -- and now a hefty 37,002 contracts above their record low of 161,898 contracts that they were short on May 26.
But since the commercial net short position fell by only 1,212 COMEX contracts -- and the Big 8 increased their net short position by 3,783 contracts...that meant that Ted's raptors, the 37 small commercial traders other than the Big 8, had to have been buyers during the reporting week -- and they were. They decreased their net short position by 3,783-1,212=2,571 contracts -- and are now net short 'only' 23,382 COMEX contracts.
And like they currently are in silver, they would normally be net long gold by many thousands of contracts [if not tens of thousands of contracts] at this point in the price cycle -- and why they're not this time around, I have no idea...but suspect that they have been recruited into the trenches in the fight to prevent a massive rise in the gold price. But if they weren't short this amount -- and net long those thousands [to tens of thousands] of contracts that they normally would be, it's a guarantee that gold would be many, many thousands of dollars higher in price than it is now.
I suspect that no more than two or three of these small commercial traders hold the vast majority of this short position...so it's the 'Big 10 or 11' -- and not just the 'Big 8' traders that are running the gold price management show.
Here's Nick's 3-year COT chart for gold -- and updated with the above data. Click to enlarge.
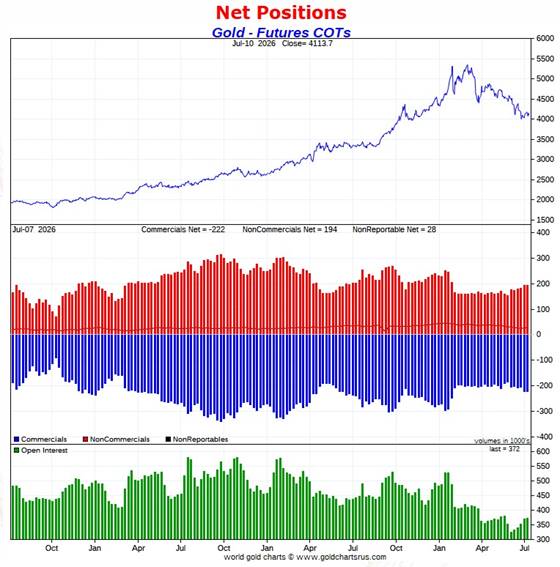
Since all the commercial traders from the largest to the smallest, are net short silver...about 115 traders in total...this week's increase in the commercial net short position was also a big 'nothingburger.'
The Big 8 are short 53.5 percent of total open interest in gold in the COMEX futures market...up from the 52.8% they were short in last week's report...and the tiny increase in total open interest during the reporting week was inconsequential to this increase.
However, unlike silver, the commercial net short position in gold is much larger than the Big 8 short position...because the rest of the collusive commercial traders, Ted Butler's raptors, are also net short gold. Adding them into the mix, which you have to do, puts the commercial net short position in gold at 59.8 percent of total open interest in the COMEX futures market...unchanged from what they were short in Monday's report.
Then, if you subtract out the uneconomic and market-neutral spread trades from total open interest, the commercial net short position in gold soars to around 65% of total open interest...which is grotesque beyond belief.
But despite the continued increases in the commercial net short positions in silver and gold, both remain on the launchpad for a major rally, especially in the former -- and will occur when they're allowed.
When that event is allowed to transpire, then we'll find out in short order if the collusive commercial traders put their collective heads back in the lion's mouth and go short in a major way once again. Based on what we've been witness to over the last month or so, it seems likely that they will. But I'm not prepared to wager any money on that.
In the other metals, the Managed Money traders in palladium increased their net short position by a further 412 COMEX contracts -- and are now net short palladium by 6,381 COMEX contracts...the only category, commercial or otherwise, that's net short palladium.
The commercial traders in the Swap Dealers category are net long palladium by 3,652 contracts -- and the commercial traders in the Producer/Merchant category are net long 509 COMEX contracts...for the moment. The traders in the Other Reportables are net long 1,723 contracts in this metal at the moment -- and the Nonreportable/small trader categories are net long 497 COMEX contracts.
As I keep mentioning about these numbers, palladium is a very dinky market. Total open interest is only 17,854 COMEX contracts...an increase of an inconsequential 7 contracts this past reporting week...still about the lowest it's been since sometime in 2022. Open interest in platinum is also about the lowest since that time as well.
The world's banks are net short an inconsequential 3.6 percent of total open interest in palladium in the COMEX futures market as of the July Bank Participation Report that came out yesterday...which is a decrease from the 9.3 percent that they were net short in June's Bank Participation Report.
This is a very strange and twisted market once you get a look into its internal structure -- and as I point out in every monthly Bank Participation Report, the only reason that there's a COMEX futures market in palladium is so the collusive commercial traders of whatever stripe can manage its price.
In platinum the Managed Money traders decreased their net long position by 312 COMEX contracts during the reporting week -- and remain net long platinum by 7,585 contracts. The traders in the Other Reportables and Nonreportable/small trader category remain net long platinum by very respectable amounts as well.
The commercial traders in the Producer/Merchant category in platinum are net short 9,239 COMEX contracts. The Swap Dealers are net short platinum by 8,463 COMEX contracts.
In yesterday's Bank Participation Report, the world's banks...19 of them in total...were net short 38.2 percent of total open interest in platinum in the COMEX futures market.
In copper, the Managed Money traders decreased their net long position by a further but tiny 919 COMEX contracts during the past reporting week -- and remain net long copper by 58,784 contracts...1.470 billion pounds of the stuff. The traders in the Other Reportables and Nonreportable categories are net long copper as well.
Copper, like palladium, continues to be a wildly bifurcated market. The Producer/ Merchant category is net short 90,983 copper contracts/ 2.275 billion pounds -- while the Swap Dealers are net long 17,813 COMEX contracts/445 million pounds of the stuff. So it's the commercial traders in the Producer/Merchant category that are short against every other group of traders...including the commercials in the Swap Dealer category.
Whether this dichotomy in copper means anything or not, will only be known in the fullness of time. Ted Butler said it didn't mean anything as far as he was concerned, as they're all commercial traders in the commercial category. But this bifurcation has been in place for as many years as I've been keeping records -- and that's a very long time....10+ years.
In this vital industrial commodity, the world's banks...both U.S. and foreign...are net short copper by 4.8% of total open interest in the July Bank Participation Report...up from the 2.1% they were short in the June BPR. Back in the October 2025 BPR, these same banks were net long 0.90% of the total open interest in copper in the COMEX futures market. So basically they're close to market neutral...but only numerically, as that dichotomy between the two groups of commercial traders is still there.
At the moment it's all the commodity trading houses such as Glencore and Trafigura et al., along with some hedge funds, that are mega net short copper in the Producer/Merchant category, as the Swap Dealers are net long, as pointed out above.
The next Bank Participation Report for the July trading period is due out this Friday, August 7.

Here’s Nick Laird’s “Days to Cover” chart, updated with the COT data for positions held at the close of COMEX trading on Tuesday, July 7. It shows the days of world production that it would take to cover the short positions of the Big 4 — and Big '5 through 8' traders in every physically traded commodity on the COMEX. This chart is a graphical representation of what's shown in the COT Report above. Click to enlarge.
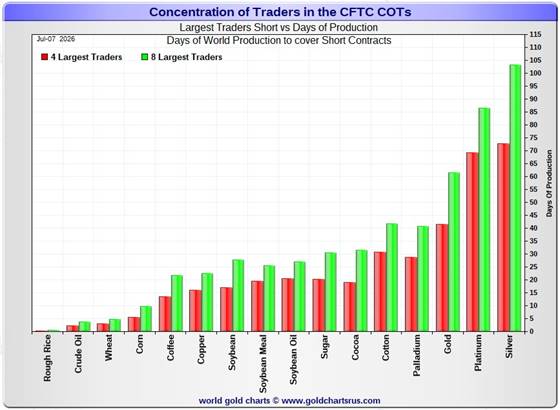
In this week's data, the Big 4 traders are short about 73 days of world silver production...unchanged from Monday's COT report. The ‘5 through 8’ large traders are short an additional 30 days of world silver production...and also unchanged from Monday's COT report...for a total of 103 days that the Big 8 are short...and obviously unchanged as well.
These 'unchanged' numbers should not be a surprise, because the Big 4/8 only increased their short position by a net 303 COMEX contracts during the reporting week...which is only a fraction one day's worth of world silver production.
Those 103 days that the Big 8 traders are currently short, represents about 3.4 months of world silver production, or 239.600 million troy ounces/47,920 COMEX contracts. That's up from the 238.085 million troy ounces/47,617 contracts from Monday's COT Report.
In gold, the Big 4 are short about 41 days of world gold production... unchanged from Monday's COT Report -- and the Big '5 through 8' are short an additional 21 days of world production...up 2 days from Monday, for a total of 62 days of world gold production held short by the Big 8 commercial traders -- and obviously up 2 days from report from Monday's COT Report.
In silver, I suspect that a goodly chunk of the gross short position in the Big 4 commercial category is mostly held by only two traders...both of them U.S. banks... Wells Fargo and BofA I suspect. In June's Bank Participation Report, 5 U.S. bullion banks held a gross short position of 12,884 COMEX contracts... down a whole bunch from May. But July's BPR showed that these same five U.S. banks increased their gross short position back up to 16,128 contracts... an increase of 3,244 COMEX contracts. I wasn't at all happy to see this...but then again, I wasn't surprised, either...considering that Big 8 have been 'stuffed' the way they have.
This chart is also a graphical representation of why I consider platinum to be 'da boyz' No. 2 problem child after silver -- and it continues to be a big problem child.
And also I note that cotton is now back as the 4th most shorted commodity on the COMEX...edging out palladium by 1 day of world production.
The short position in SLV now sits at 30.77 million shares/troy ounces as of the latest short report that came out yesterday...for positions held at the close of trading on Tuesday, June 30. This represents a decrease of only 3.84% from the prior report -- and 5.82% of total SLV shares outstanding. This is not as off-the-charts grotesque and obscene as it once used to be -- but realistically should be something less than a third of that amount.
Don't forget that there's not a single solitary troy ounce of silver backing any of these shorted shares as the SLV prospectus requires.
The next short report...for positions held at the close of business on Wednesday, July 15...is due out on Friday, July 24.
In the overall in yesterday's COT Report, the short positions of the Big 8 commercial traders in both silver and gold were big 'nothingburgers.'
As Ted Butler pointed out quite often over the years, the resolution of the Big 4/8 short positions will be the sole determinant of precious metal prices going forward...although that short position in gold held by his raptors continues to be another negative factor -- but decreased by a bit during this past reporting week. However, under normal circumstances, it wouldn't be there at all...it would be a huge long position.
And as he also pointed out over the years, there would come a time when what the numbers show in the COT Report won't matter, as events in the real world...whatever they may be...will overtake them. That hasn't happened yet...but that day is coming.
All that we await, is the denouement that follows. The big bear raids we've endured over the last many months, weeks and days...are all part and parcel of the process to keep their respective prices in line until that moment arrives.

The July Bank Participation Report [BPR] data is extracted directly from yesterday's Commitment of Traders Report. It shows the number of futures contracts, both long and short, that are held by all the U.S. and non-U.S. banks as of Tuesday’s cut-off in all COMEX-traded products.
For this one day a month we get to see what the world’s banks have been up to in the precious metals. They’re usually up to quite a bit...but only in gold by all banks -- and the U.S. banks in silver and platinum.
[The July Bank Participation Report covers the five-week time period from June 2...to July 7 inclusive]
In gold, 5 U.S. banks are net short 82,398 COMEX contracts, up a further 16,396 contracts from the 66,002 contracts that these same 5 U.S. banks were net short in the June BPR. This is their largest short position since February's BPR for January.
Also in gold, 23 non-U.S. banks are net short 95,640 COMEX contracts, up 3,626 contracts from the 92,014 contracts that these same 23 non-U.S. banks were net short in June's BPR.
At the low back in the August 2018 BPR...these non-U.S. banks held a net short position in gold of only 1,960 contacts -- so they've been back on the short side in a gargantuan way ever since. Only a handful of these banks hold meaningful short positions in gold. The short positions of the rest are of no consequence -- and never have been.
Although most of the largest U.S. and foreign bullion banks are in the Big 8 short category, some of the hedge fund/commodity trading houses are short large amounts of gold in that category as well. There's also the possibility that the BIS could be short gold in the COMEX futures market.
As of July's Bank Participation Report, 28 banks [both U.S. and foreign] were net short 47.9 percent of the entire open interest in gold in the COMEX futures market...down from the 48.5 percent that these same 28 banks were net short in the June BPR -- and only down because of the increase in open interest during the reporting month, which obviously affects the percentage calculation.
And if you remember from the above COT Report, the commercial net short position in gold was 59.8 percent of total open interest -- and if you subtract out the 47.9 percent held short by the banks...only 59.8-47.9=11.9 percentage points of the commercial net short position is not held by the banks. How's that for a concentrated and manipulative short position?
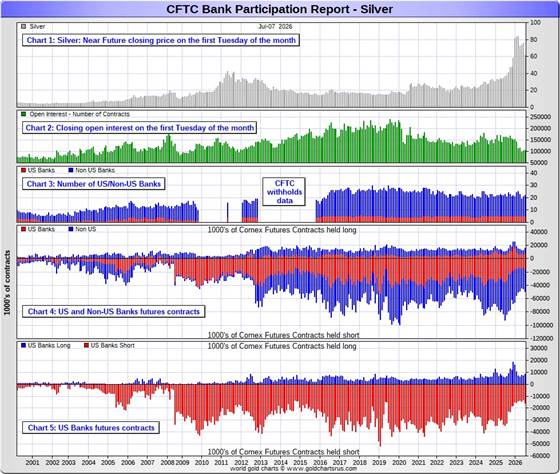
Here’s Nick’s BPR chart for gold going back to 2000. Charts #4 and #5 are the key ones here. Note the blow-out in the short positions of the non-U.S. banks [the blue bars in chart #4] when Scotiabank’s COMEX short position was outed by the CFTC in October of 2012. Click to enlarge.
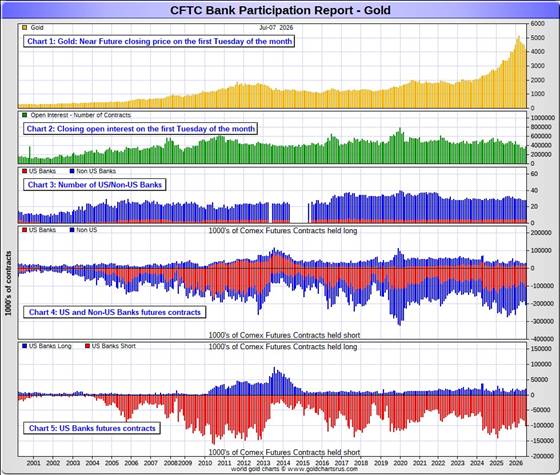
In silver, 5 U.S. banks are net short 7,601 COMEX contracts...up 1,505 contracts from the 6,096 contracts they were net short in the June BPR -- and is still ultra low, but not a record low.
But the number I really wanted to see was the change in their gross short position. In the December BPR it was 17,838 contracts, but in the June BPR, that number was down to 12,884 contracts which was, without doubt, their lowest gross short position in silver, ever. But July's BPR showed that it had jumped back up to 16,128 COMEX contracts...which I wasn't happy to see.
The five U.S. banks that are net short silver would be Citigroup, Wells Fargo, Bank of America, Goldman Sachs -- and Morgan Stanley...with by far the lion's share held by no more than two of these banks...most likely BofA and Wells Fargo, although I'm starting to have my suspicions about Citi.
Also in silver, 17 non-U.S. banks are net short 26,021 COMEX contracts, down 754 contracts from the 26,755 contracts that 16 non-U.S. banks were net short in the June BPR. This is their smallest short position since February 2024.
It's a given, based on silver deliveries in 2025 -- and so far in 2026...that HSBC, Barclays, Standard Chartered, BNP Paribas, Deutsche Bank and Macquarie Futures hold by far the lion's share of the short positions of these non-U.S. banks. Canada's Bank of Montreal is a card-carrying member of this group as well.
And, like in gold, the BIS could also be actively shorting silver. However, the remaining short positions in silver, divided up between the rest of the of the non-U.S. banks, are immaterial — and have always been so....the same as most of the 23 non-U.S. banks in gold as well.
As of July's Bank Participation Report, 22 banks [both U.S. and foreign] were net short 32.1 percent of the entire open interest in silver in the COMEX futures market — up an inconsequential amount from the 32.0 percent that 21 banks were net short in the June BPR.
Here’s the BPR chart for silver. Note in Chart #4 the blow-out in the non-U.S. bank short position [blue bars] in October of 2012 when Scotiabank was brought in from the cold. Also note August 2008 when JPMorgan took over the silver short position of Bear Stearns—the red bars. It’s very noticeable in Chart #4—and really stands out like the proverbial sore thumb it is in chart #5. Click to enlarge.
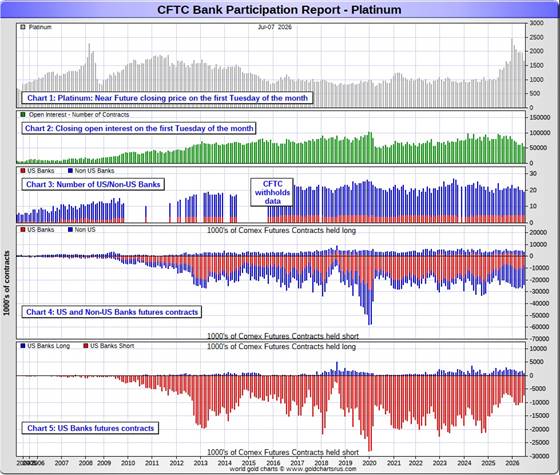
In platinum, 5 U.S. banks are net short 6,454 COMEX contracts in the July BPR, down a further 1,766 contracts from the 8,220 contracts that these same 5 U.S. banks were short in the June BPR. This is the third month in a row that these U.S. banks have reduced their short position in platinum -- and their lowest short position since December of last year.
At the 'low' back in September of 2018, these U.S. banks were actually net long the platinum market by 2,573 contracts...so they still have more work to do to get back to market neutral...if they ever intend to.
Also in platinum, 14 non-U.S. banks decreased their net short position by only 280 contracts... from 14,347 contracts held by 15 banks in June's BPR...down to 14,067 contracts in the July BPR. This is 5.76x the amount they held short in the May/25 BPR, so they've been gone back on the short side in platinum by a huge amount since then.
Back in the December 2023 BPR, these non-U.S. banks were net short a microscopic 35 platinum contracts...so they have yeoman work to do if they ever want to get back to even close to that number. I doubt that they'll ever accomplish that -- and are permanently stuck with this short position.
As you know, platinum remains the big commercial shorts No. 2 problem child after silver -- and there's now a long-term structural deficit in it [and palladium] as well.
As of July's Bank Participation Report, 19 banks [both U.S. and foreign] were net short 38.2 percent of platinum's total open interest in the COMEX futures market, up big from the 34.4 percent that 20 banks were net short in June's BPR -- and up big only because of a hefty decrease in total open interest.
Here's the Bank Participation Report chart for platinum. Click to enlarge.
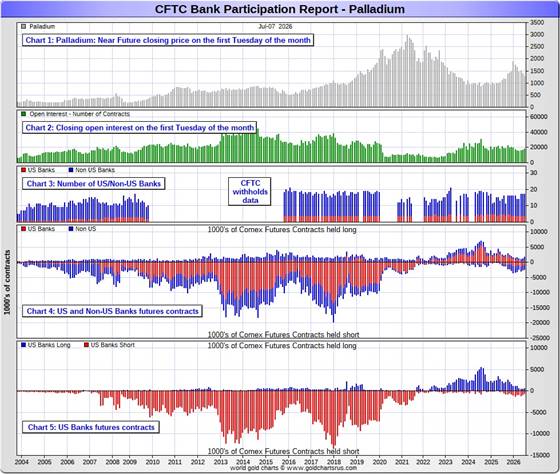
In palladium, 4 U.S. banks are net short only 67 COMEX contracts in the July BPR, a decrease of a further 311 contracts from June.
Also in palladium, 13 non-U.S. banks are net short by 567 COMEX contracts... a decrease of 569 contracts from the 1,136 contracts that these same 13 non-U.S. banks were net short in the June BPR.
None of this mean anything considering how tiny these amounts are... especially when divided up between 17 banks. But I must admit that I'm somewhat surprised that they're short at all, considering how far they have palladium below any moving averages that matter.
And as I've been commenting on for almost forever, the COMEX futures market in palladium is a market in name only, because it's so illiquid and thinly-traded. Its total open interest in yesterday's COT Report was only 17,854 contracts...compared to 53,645 contracts of total open interest in platinum...104,859 contracts in silver -- and 371,776 COMEX contracts in gold.
Total open interest in palladium has increased quite a bit over the last ten or so years, because I remember when it was less than 9,000 contracts on average. So it's nowhere near as illiquid as it used to be -- and it's also been helped along by the fact that the bid/ask is now down to only 40 bucks. It used to be $150 at one point way back when.
As I say in this spot every month, the only reason that there's a futures market at all in palladium, is so that the Big 8 commercial traders can control its price. That's all there is, there ain't no more.
As of this Bank Participation Report, 17 banks [both U.S. and foreign] are net short 3.6 percent of total open interest in palladium in the COMEX futures market...down from the 9.3 percent of total open interest that these same 17 banks were net short in the June BPR.
For the last 5 years or so, the world's banks have not been involved in the palladium market in a material way...see its chart below. With all the world's banks basically market neutral from a COMEX futures market perspective...it's only the Managed Money traders that are net short now.
The Big 8 shorts in palladium, none of which are banks, are net short 40.0 percent of total open interest in palladium as of yesterday's COT Report...down a bit from the 43.2 percent of total open interest they were short a month ago.
Here’s the palladium BPR chart -- and it remains to be seen if 'da boyz' return as big short sellers again at some point like they've done in the past. Click to enlarge.
Excluding palladium, most likely no more than a dozen or so banks in total -- and mostly U.S. and U.K.-based...along with French bank BNP Paribas and Deutsche Bank...continue to hold meaningful short positions in the other three precious metals...although I won't let Canada's Bank of Montreal or Australia's Macquarie Futures off the hook just yet.
As I pointed out above, some of the world's commodity trading houses and hedge funds are also net short the four precious metals. They have the ability to affect prices if they choose to exercise it. But it's still the collusive Anglo/ American/Western bullion bank cartel in the commercial category that are at Ground Zero of the price management scheme in the COMEX futures market. They are -- and remain, the not-for-profit/short sellers of last resort...until further notice.
And as has been the case for several decades now, the short positions held by the Big 4/8 traders is the only thing that matters...especially the short positions of the Big 4...or maybe only the Big 1 or 2 in silver. How this is ultimately resolved [as Ted kept pointing out] will be the sole determinant of precious metal prices going forward.
Considering the current state of affairs of the world as they stand today -- and the structural deficit in silver -- and now in platinum and palladium as well, the chance that these big bullion banks and commodity trading houses could get overrun at some point, is no longer zero -- and certainly within the realm of possibility if things go totally non-linear somewhere.
But...as Ted kept reminding us...if they do finally get overrun, it will be for the very first time. And it was patently obvious that the collusive commercial traders of whatever stripe had to step in multiple times over the last six months in order to prevent exactly that from happening. If they hadn't, Ted Butler's "Bonfire of the Silver Shorts" would have become a reality within days...if not hours.
I'll have more to say about this in The Wrap.
The next Bank Participation Report for trading in July is due out on Friday, August 7.

CRITICAL READS
Lots of new supply: Treasury debt of notes and bonds outstanding ballooned by $70 billion this week.
The U.S. government sold $743 billion of Treasury securities during the week, in 10 auctions. Of them, $612 billion were Treasury bills, spread over seven massive auctions, with maturities from 4 weeks to 52 weeks, most of them to replace maturing T-bills. And $131 billion were 3-year and 10-year Treasury notes and 30-year Treasury bonds, which replaced $61 billion of maturing securities, causing the total amount of notes and bonds outstanding to balloon by $70 billion this week.
There was strong demand at the auctions, but at higher yields. T-bill yields have begun to factor in rate hikes. The 6-month T-bills sold at an investment rate of 3.96%. The 1-year T-bills sold at an investment rate of 4.03%, for the first time over 4% since the auction on July 8, 2025, and that was three rate-cuts ago. The 10-year Treasury notes at a yield of 4.58%, highest auction yield since February 2025. The 30-year Treasury bond sold at a yield of 5.058%, the highest auction yield since 2007.
Inflation has been running at a rate of over 4%, so all those T-bill yields, though they have risen in recent months, are below the rate of inflation, and “real” (after inflation) returns are negative. But Treasury yields of 1 year and shorter are not impacted by inflation, but by the Fed’s policy rates and by market expectations of those policy rates within the remaining maturity window of those yields. And the Treasury market is now solidly in the camp of rate hikes, starting with at least one this year. If Fed Chair Warsh wants to talk the Treasury market down from those rate-hike expectations, he needs to start scrambling pronto...
This longish but very interesting and chart-filled commentary was posted on Wolf's website on Friday sometime -- and I thank Mike Coombs for pointing it out. Another link to it is here.
Currency Pegs and Carry Trades -- Doug Noland
Ten-year Treasury yields rose eight bps this week to 4.56%. Yields rose to 4.60% intraday in Wednesday trading, the high since May 21st – and only seven bps below the May 19th peak closing high (4.67%). It’s worth remembering that 10-year Treasury yields dropped to a February 27th low of 3.94%. Five-year Treasury yields traded to 4.34% Wednesday (closed week at 4.30%) – the high back to February 2025. Two-year Treasury yields traded to 4.23% intraday Wednesday, also the high since February 2025 (closed week at 4.21%). Benchmark MBS yields rose to 5.56% Wednesday, the high since the May war spike (closed week 5.53%).
The market is pricing a 4.10% policy rate for the April 28, 2027, FOMC meeting, implying almost two (1.9) rate increases. This compares to 2.925% on February 27th. So, the rates market has gone from two cuts to now pricing two rate increases. Interestingly, the end of “Operation Epic Fury” and a $30 plus collapse in crude prices have had a negligible impact on market rate expectations.
It’s worth noting that the New York Fed’s June survey of Consumer Expectations had one-year inflation at 3.67% - the high since September 2023, with three-year inflation expectations at 3.3%, the high back to June 2022.
But this is not a domestic story. Wednesday’s “Trump says Iran MoU ‘Is Over’” and the 6% spike in crude prices exposed ongoing global bond market fragility.
The odds are decent that Japan, France and U.K. markets are leading an upside breakout for global bond yields more generally. In such a heavily indebted world with highly levered global bond markets, one would typically expect some fraying nerves to make their way into higher risk premiums and CDS (Credit default swap) prices. Not so much, at least so far.
I won’t venture a guess as to what initially upsets the apple cart. It could be debt market dislocation in any number of countries. An acute geopolitical crisis. There could be a run on a particular currency, or dislocation in a major funding currency (such as the yen). Or perhaps the trigger will simply be a bursting stock market Bubble (i.e., led by South Korean memory stocks).
I am comfortable predicting powerful contagion effects – a likely chain reaction of de-risking/deleveraging that will reverberate across global markets. There should be no doubt that Bubble dynamics function poorly (being kind) in reverse. I can’t help but think that global bond markets are sending a warning.
This commentary from Doug showed up on his website around midnight last night PDT -- and another link to it is here.

Guns Fall Silent As Trump Says U.S.-Iran Talks On Again, But Insists 'In No Uncertain Terms, Ceasefire is OVER'
The guns have actually been silent in the Middle East overnight, after two days of deadly strikes between the United States and Iran, amid a general return to pre-market open headlines of 'peace imminent again' as mediators desperately work to get diplomacy back on track. The White House position is that the ceasefire is over but that Washington has agreed to reengage Tehran in mediated talks.
Trump indicates U.S. has agreed to Iran talks, but United States has stated to them, in no uncertain terms, that cease fire is over.
The New York Times writes early Friday that "Qatar, which helped broker the U.S.-Iran truce last month, has been in talks with Washington and Tehran to de-escalate the crisis, according to two officials with knowledge of the matter, who requested anonymity to discuss sensitive diplomacy. In recent days, several other regional countries — Bahrain, Kuwait and Jordan, all of which host U.S. military facilities — said they have come under Iranian attack."
The same report further says, "Even as the fighting appeared to subside on Friday, it remained unclear whether the latest mediation efforts could prevent that cycle from repeating." The situation has devolved into a "dangerous test of wills, with each side trying to show that it can absorb the other’s attacks and respond forcefully, without tipping the conflict back into full-scale war," NYT continues.
This Zero Hedge news item showed up on their website at 10:40 a.m. on Friday morning EDT -- and another link to it is here.
Disastrous NATO Summit: Renewed War on Iran & Russia -- Colonel Douglas Macgregor
This 51-minute long video interview with the colonel was hosted by Professor Glenn Diesen on Friday morning EDT -- and here's another gentleman that I have all the time in the world for. I thank Guido Tricot for sending it -- and another link to it is here.

China now has 7 of world's 10 biggest banks as Beijing's financial ambitions grow
China's "big four" state-run banks are the largest in the world in terms of asset scale, a new report has found, underscoring Beijing's rising ambitions to build the country into a global financial powerhouse.
The ranking, released by The Banker magazine on Wednesday, was topped by the four Chinese banks -- Industrial and Commercial Bank of China, China Construction Bank, Agricultural Bank of China, and Bank of China -- with JPMorgan Chase following in fifth place.
In total, Chinese banks made up seven of the top 10 in the ranking, which lists global banks in terms of tier-one capital size. All seven of them are controlled by the Chinese government.
Postal Savings Bank of China broke into the top 10 for the first time, while U.S. giants Bank of America and Citigroup ranked sixth and eighth, respectively.
Chinese banks collectively held US$54.8 trillion in total assets, more than double the US$25 trillion held by U.S. banks in the ranking, data showed.
However, the race is not only about size, as U.S. banks continue to hold the advantage in terms of profitability.
This news item put in an appearance on the South China Morning Post on Thursday -- and I found it on the gata.org Internet site on Friday. Another link to it is here.
Supercycle = Gold & Silver to 7x. Jeff Currie with Steven Feldman on Open Position
This 28-minute video interview is worth watching...but the comments section below the video is loaded with things like..."Guest was invited on just to hear the host talk."...and "Don't you love it when the host act as a guest too...?"...plus "Don’t think that the guest would return to this show. I would not." Another link to it is here.
Poland’s central bank buys 82 tonnes of gold so far this year
Poland’s central bank purchased 82 tons of gold in 2026 through Thursday, Governor Adam Glapinski said at a news conference in Warsaw. The bank added 37 tons since April, when the last official data was released, representing approximately $5 billion at current prices.
"We’ve been consistently buying gold, taking advantage of the recent price drops," Glapinski said.
Poland purchased more gold than any other central bank in 2025 and appears positioned to do so again in 2026.
Glapinski confirmed the Polish central bank’s target of reaching 700 tons of gold holdings. The bank now holds 632.4 tons of gold, with 105 tons kept in Poland and the remainder divided between London and New York.
"This isn’t some kind of race or a purchase made merely for the sake of it," the governor said. "There is a deep sense in the state’s role in ensuring the security of Poland and Poles under all circumstances, including wartime, which of course we’re not expecting."
This updated news story from Thursday was posted on the investing.com Internet site -- and I found it on Sharps Pixley. Another link to it is here.
Indian gold ETFs buck global trend with $38.8M June inflows
World Gold Council data show Indian gold ETFs saw net inflows of $38.8 million in June, a turnaround from May’s outflows. Nippon India ETF Gold BeES led with $15.84 million in investments, followed by SBI ETF Gold with $8.12 million. Market specialists point to domestic investors treating the price dip as an accumulation opportunity, reflecting continued use of gold ETFs for portfolio diversification despite elevated prices.
"For the first time on record, investment-led gold buying in India surpassed jewellery consumption in the March quarter. This marks a structural shift in a market where jewellery has historically dominated gold demand." -- World Gold Council
This gold-related article was picked up the msn.com Internet site on Thursday sometime -- and is another item I found on Sharps Pixley. Another link to it is here.
GoldCore's Skoyles outlines China's gold bid, but who wants to trust China?
GoldCore's Jan Skoyles this week brilliantly summarized China's creation in Hong Kong and Shanghai of a comprehensive and physical system of gold trading, clearing, settlement and vaulting allowing traders and investors to bypass the derivatives-based systems in London and New York, a new system based on Asian trading hours and with its own ticker symbol for pricing: HAU.
Presumably the Hong Kong-Shanghai system may give the world a chance to see what the price of gold is in a market not as susceptible to interventions by the U.S. Federal Reserve, Treasury Department, and Bank of England in support of the U.S. dollar.
Skoyles' analysis is headlined "Gold and Silver: Asia's New Clearing System Is Now Live: The Structural Story," it's 9 minutes long, and it can be viewed at YouTube here.
But even fans of the monetary metals who will welcome a challenge to the London and New York gold rackets may do well to wonder: Why wouldn't China itself have reasons to manipulate the gold market it has created, to use it to attack the currencies of its adversaries or to help place the yuan at more convenient levels of valuation? After all, China already openly rigs the yuan market every day.
In 2009 financial and geopolitical analyst Jim Rickards was allowed to remark on CNBC, "When you own gold you're fighting every central bank in the world."
The enemy of your enemy is indeed your friend -- sometimes, and maybe for a while. But why should any gold advocate think that the totalitarian regime in Beijing is any more trustworthy than the corrupt regimes in London and Washington?
This interesting commentary from GATA secretary/treasurer Chris Powell showed up on the gata.org Internet site on Friday -- and it's certainly worth your time, as is the Skoyles' interview. Another link to it is here.

QUOTE of the DAY

The WRAP
"Understand this. Things are now in motion that cannot be undone." -- Gandalf the White
Today's pop 'blast from the past' is a cover of a Chicago tune that's now 54 years young -- and reached No. 11 on Billboard's Hot 100 way then. On the original recording, the Beach Boys guested as backing vocalists -- and here's the Moscow-based group Leonid & Friends performing a faithful reproduction of it. I featured this before back in 2017 when I first stumbled across it -- and it had only been viewed around 35,000 times...if my memory serves me correctly. That has changed -- and the link is here. The bass line is a total snoozer...so I passed on it.
Today's classical 'blast from the past' is one I've only feature once over the last eleven years -- and it's definitely time for a revisit. Composed by Ludwig van Beethoven between 1804 and 1808 -- and first performed in Vienna in the latter year, the work achieved its strong critical reputation not long afterward; E. T. A. Hoffmann described it as "one of the most important works of the time." It's a reputation it still holds today.
It's Beethoven's Symphony No. 5 in C minor, Op. 67 -- and here's the Vienna Philharmonic doing the honours in a live performance, with Maestro Christian Thielemann at the podium. The link is here.
It was a very quiet trading session in all four precious metals -- and although gold and silver managed decent rallies going into the 5:00 p.m. close of trading, I noted that 'da boyz' didn't allow either to close up on the day.
But with gold volume deep into fumes & vapours territory -- and silver's microscopic...the collusive commercial traders of whatever stripe had a pretty easy time of it. And for that exact reason, I'm wondering why they allowed platinum and palladium to close higher by as much as they did.
Open interest in gold in last night's Preliminary Report was higher by less than 4,000 contracts -- and total silver o.i. fell by 16 contracts. Nothing to see here.
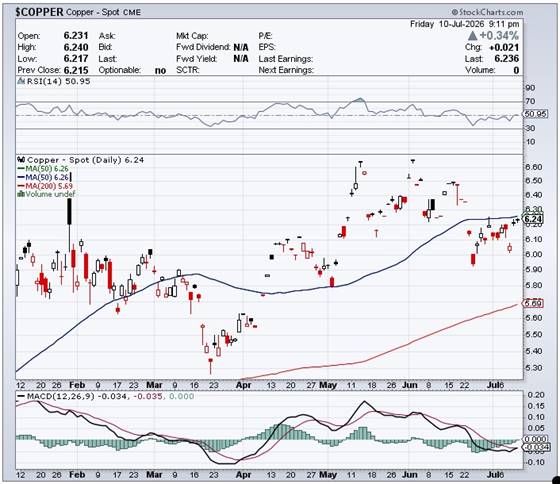
Copper gained a further 2.1 cents...but was prevented from closing above its 50-day moving average. It finished the Friday trading session at $6.236/pound.
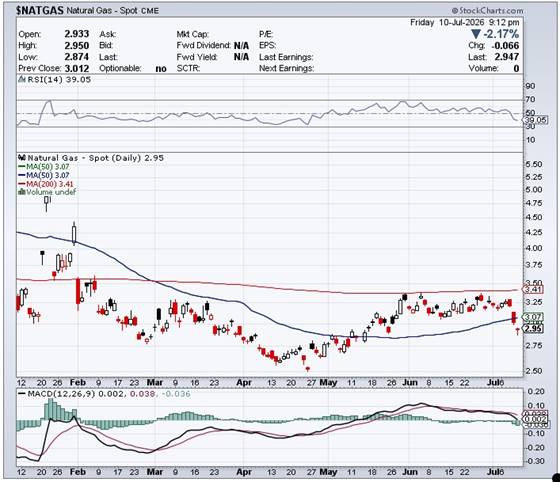
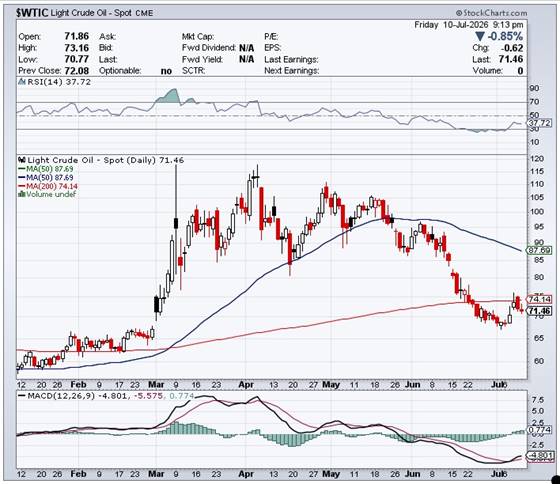
Natural gas [cart included] got clubbed for the second day in a row...as it was closed lower by 6.6 cents at $2.59/1,000 cubic feet -- and is now some distance below any moving average that matters. WTIC closed down a further 62 cents at $71.46/barrel -- and a little further below its 200-day moving average. It has now been engineered back below where it was before the war started.
Here are the 6-month charts for the Big 6+1 commodities for Friday... thanks to stockcharts.com as always and, once again, the 6-month chart for silver doesn't show its entire intraday price move. Click to enlarge.
As I was working through the numbers in the Commitment of Traders and Bank Participation Reports yesterday, it reinforced and broadened my view of the overall. At first I only noticed it in silver...but it then expanded to include gold and platinum as well as I continued to delve deeper into them.
Although not at the exact bottoms of the current 'wash, rinse & spin' cycle in any of the four precious metals, we're so far below their respective 50 and 200-day moving averages, that it really doesn't matter. The point is that although their respective prices have been crushed, that new reality has never manifested itself in the positions held by the non-commercial and small traders ...except for palladium, where the Managed Money traders are net short against all the other categories of traders...including all the traders in the commercial category.
In gold, despite the pounding it's taken, the Managed Money traders remain mega net long by 116,000 contracts...the Other Reportables by 78,000 contracts -- and the Nonreportable/small traders by 28,000 contracts. These are incredibly high numbers in all categories. But enough of them have sold that the commercial traders have been able to bomb the price by $1,600 bucks since its late January high...but the vast majority of the traders in these categories have remained long and strong throughout all that.
In silver, it's even more dramatic. In the past -- and at this price level -- and this far below the moving averages, the Managed Money traders would be market neutral at best, or would be slightly short. Not this time. As of yesterday's COT Report, they remained net long an eye-watering 13,200 contracts...with the other two categories net long 15,000 contracts each. Silver's price has been cut in half since the end of January -- and these traders are still standing strong. This is not only astounding...it's historic, as it's never happened before.
In platinum it's the same as silver...with its price also well below its 200-day moving average. In the past, the Managed Money traders would be mega net short...but as yesterday's COT Report, they remained net long 7,500 contracts -- with the Other Reportables and small trades net long very comfortable amounts as well.
In the recent past, I was always commenting on the big net long positions held by the Managed Money traders in silver as its price was getting crushed. But now that the tide is fully out on this current iteration of 'da boyz' wash rinse and spin cycle, it has become apparent that...Pavlov's dog has died in gold and platinum as well -- and the collusive commercial traders, which includes the banks, are staring across the table at Managed Money, Other Reportables and Nonreportable/small traders that are whole different breed of cat in these two precious metals as well.
'Da boyz' may be able to shake the tree enough to get prices lower...but it will be on tiny net volumes...as virtually all the traders left in these categories aren't going anywhere.
I'm reminded of a term that U.S. Ambassador Chas Freeman dug up when describing the U.S. and the predicament it faced in Iran. It was German word...Zugzwang.
Zugzwang, according to Wikipedia, is a situation found in chess and other turn-based games wherein one player is put at a disadvantage because of their obligation to make a move; a player is said to be "in zugzwang" when any legal move will worsen their position. Although the term is used less precisely in games such as chess, it is used specifically in combinatorial game theory to denote a move that directly changes the outcome of the game from a win to a loss.
I used this term many months ago to describe the situation the commercial shorts and western bullion banks were in regarding silver...but now with the tide fully out...it also applies in gold and platinum.
No matter what the commercial traders do going forward...increase their short positions on the next rallies...or stand aside and let their prices trade freely...their positions worsen. As I've said countless times in the past, the only way to save the shorts and the western bullion banks is to close the LBMA and COMEX.
Ted Butler thought that this was an impossibility when I spoke of it, because he felt that the western banking system would never give up that sort of power and control -- and for the last decade or so he might have been right about that. As it turns out, that theory was never put to the test until his 'bonfire' came close to going supernova at the end of January.
When 'da boyz' stepped in to save the shorts -- and the markets at that time -- and crushed their respective prices, it was at that point they discovered that the new breed of traders that now populated the non-commercial and small traders categories that simply refused to sell to them in anywhere near the volumes required. So they're in Zugzwang.
About the time this was all going down [in February sometime] was the moment that the news broke into the public domain about the $15,000 and $20,000 December call options in gold. I stuck an ''X' post about it in one of my March columns that reader Brian Goodner had sent me -- and new one was posted on Wednesday that showed up in my Thursday column -- and here it is again...
"There was a new 'X' post on those December call options in gold from @MBAeconomics yesterday..."Massive volume seen at new December COMEX gold call strikes. $6,000 and $8,000 calls have entered the chat. These “lottery” tickets are significantly more expensive than $10,000, $15,000, and $20,000 strikes. Again, we do not see this accumulation on any other expirations, solely December." I thank reader Brian for this one as well -- and the link to it is here."
One has to wonder if these non-blinking traders that have suddenly appeared in the Managed Money, et al. categories are setting themselves up for the same potential payday. Considering the amount of money already bet on this trade in calls...with more piling on all the time...one has to think that they know something that we don't.
Then, back on June 25, a story from the South China Morning Post was headlined "Major Chinese banks suspend individual trading on Shanghai Gold Exchange amid volatility" -- and linked here. Then there was this story from the same news organization this past Tuesday headlined "Hong Kong begins trial operation of gold clearing and settlement system" -- and linked here. All of this was wrapped up neatly in this 9-minute video clip from Jan Skoyles of GoldCore fame on Friday headlined "Gold & Silver: Asia's New Clearing System is Now Live: The Structural Story" -- and linked here.
Then there was this commentary from Alasdair Macleod on Friday...
"So, what is the PBOC up to? It is extending the SGE (which it owns and directs) into Hong Kong. At the same time, it is freeing up movement of physical gold between Shanghai and Hong Kong, having announced that permission from the PBOC to export gold to the island is no longer required. It has announced a substantial expansion of facilities in Hong Kong, set up a clearing and settlement system facility, is reviving dollar gold futures trading alongside gold-yuan futures, establishing a delivery connection with the SGE, coordinating with Shenzhen for refining and regulatory refinement, giving tax incentives for gold trading in Hong Kong, enhancing yuan liquidity, encouraging new gold-linked investment vehicles even for onshore pension funds, and planning a massive expansion of storage facilities to 2,000 tonnes+.
Quite a list. It is also consistent with earlier steps to permit China to put the yuan on a gold standard. Is that the significance of July 24th when major banks want to see speculative longs closed? Perhaps not, but a replay of late-1973 is in the cards as a start.
Watch this space, very closely."
Is this a threat to the western bullion bank cartel -- and their 50+year market management of the precious metals and other commodities in the COMEX futures market? You betcha -- and long overdue.
As for the timeline -- and the intrigues along the way...I have no idea. Nor do I know how soon their prices will rise -- and how high they'll get. However, it's a safe bet that we'll know before Christmas, as there's big, big money betting gold will rise by a spectacular amount...with more big money being added all the time. [I wonder who's on the short side of these trades?...just asking for a friend. - Ed]
Although silver hasn't been mentioned, I can easily see it being priced at an order of magnitude higher than it closed at on Friday...if everything comes to pass in gold as is being anticipated.
So we wait some more.
I'm still "all in" -- and, as always, will remain so to whatever end.
See you here on Tuesday.
Ed
About the author

SUBSCRIBE: https://edsteergoldsilver.com/

Ed Steer’s Daily Analysis of the Gold and Silver Markets
After eight years of writing about the precious metals for Casey Research, the folks at Stansberry & Associates—who just recently purchased controlling interest in the company—decided that my ‘niche market’ column didn’t fit into their plans.
Since the time that Casey Research was kind enough to offer me a stand-alone column, it became their most highly-rated blog almost from the outset—and has remained that way up to this date...