While the indicators last week suggested a higher silver price this week, it looks like the overdue correction has finally begun. We shouldn’t be surprised to see a correction in the silver price as it doubled in less than three months. However, it does seem as if the corrections are much more extreme… as the last gains over the past five days have now been erased today.
Regardless, the underlying fundamentals for precious metals are very strong. I posted this chart of the U.S. Currency in Circulation on my SRSrocco Report Twitter Feed this morning:
In just the past five months, the U.S. Currency in Circulation has increased by nearly $200 billion, while it took 27 months do increase the same amount previously. I can assure you, the U.S. and world population did not raise that quickly to need an additional $200 billion in Federal Reserve Notes, mostly $100 bills.
While some precious metals investors were going to bed with DOLLAR SIGNS in their eyes dreaming of SUGAR PLUMS dancing in their heads, these corrections are all apart of a bull market. Yes, it’s true that in my latest Youtube video update, I said that the indicators suggested higher silver prices this week. Again, Technical Analysis is not a guarantee… it is just a GUIDELINE of future outcomes. With some outcomes-trends more likely than others.
Now that silver has plunged 15% for the day, it has fallen below certain KEY LEVELS. Here are the next support levels for silver:
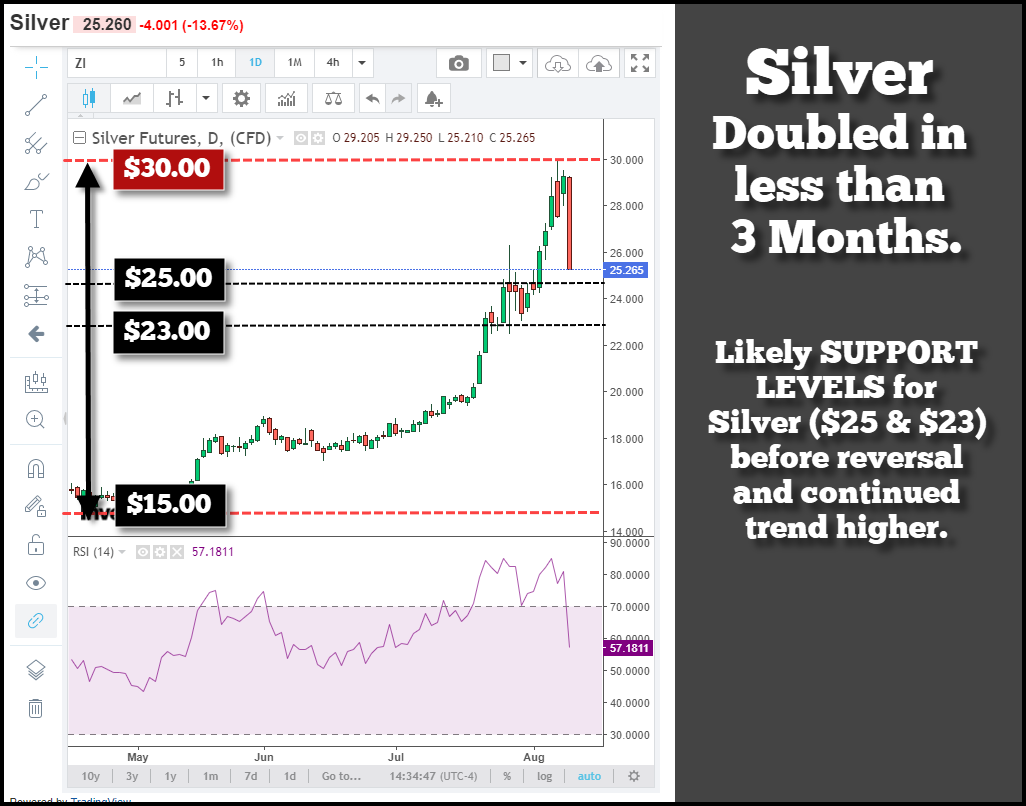
We should realize that with the silver price doubling in price in less than three months, a correction was coming whether we liked it or not. The silver price will most likely fall to $25 and possibly $23 before reversing higher. However, silver must remain above the monthly $21 level to say in a BULL MARKET.
It will be interesting to see the Silver COT Report changes this week as this massive correction took place on the very last day of the reporting period that will show up in the data released on this Friday. I will post a new video update this weekend.
With the SRSrocco Report transitioning to a new subscriber service shortly, I will be providing more ADVANCED CHARTS for those who are looking for support and resistance levels for TURNS in Stocks, commodities, and the market.
I have been keeping a close eye on Pan American Silver and made this chart back on July 20th. It shows the $36 level on the weekly chart as a long-term resistance level for Pan American Silver:
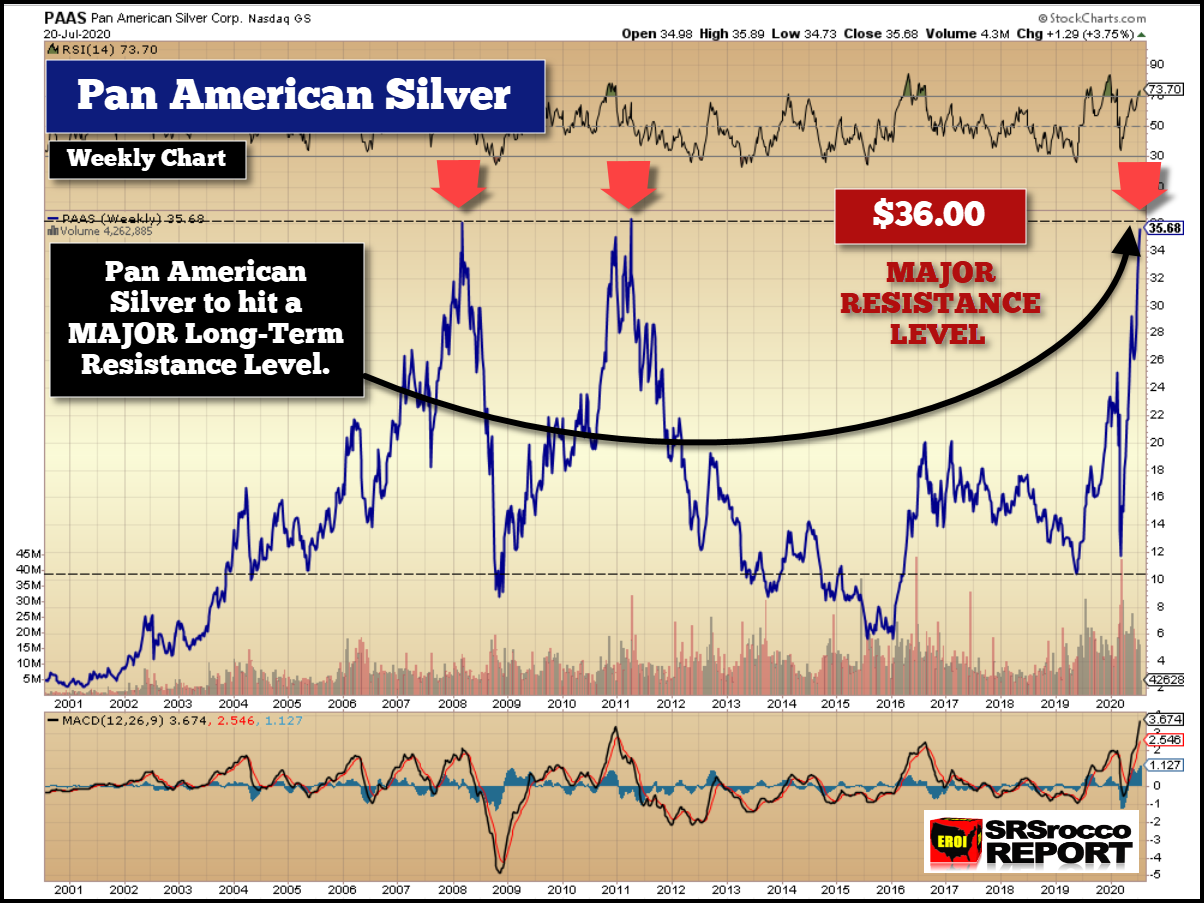
While Pan American Silver did briefly touch $40, its present move was extremely narrow compared to its prior movements to $36 in 2008 and 2011. I knew at some point soon; Pan American Silver would need to experience a correction before moving higher.
I published this earlier on Twitter:
I also posted the following Pan American Silver weekly chart on Twitter showing its possible support levels:

I believe Pan American Silver is going to really surprise investors on the upside as the silver (and gold) continue higher over the next several years. We shouldn’t look at these corrections as something negative, but rather, as important necessary steps to get to much higher prices in the future.
Lastly, in setting the tone for my simple analysis that ENERGY=MONEY=PRECIOUS METALS, this little tidbit came out on the Oilprice.com website last week, Big Oil’s Most Profitable Business Is No Longer Oil.
HILARIOUS is a perfect word to describe how BIG OIL is now making its money by TRADING ACTIVITY rather than producing oil and gas. This should be a stark warning to investors, especially in the energy industry, that the beginning of the end of BIG OIL has arrived. And with the end of BIG OIL, it will also signify the end of Global GDP growth. You can’t have one without the other.
About the author


Independent researcher Steve St. Angelo (SRSrocco) started to invest in precious metals in 2002. Later on in 2008, he began researching areas of the gold and silver market that, curiously, the majority of the precious metal analyst community have left unexplored. These areas include how energy and the falling EROI – Energy Returned On Invested – stand to impact the mining industry, precious metals, paper assets, and the overall economy.
Steve considers studying the impacts of EROI one of the most important aspects of his energy research. For the past several years, he has written scholarly articles in some of the top precious metals and financial websites.
You can find many of Steve’s articles on noteworthy sites, such as GoldSeek-SilverSeek.com
WEBSITE: https://srsroccoreport.com/