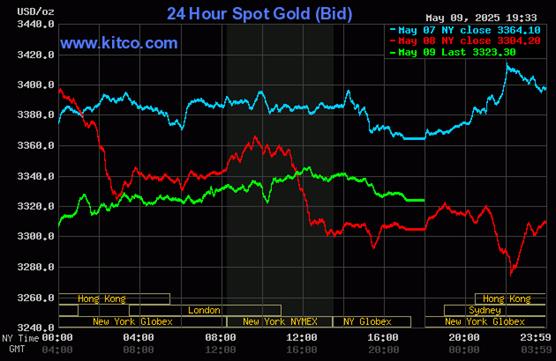
Gold's rally that began at the Globex open in New York on Thursday evening got stepped on an hour later -- and once Shanghai opened, it was sold/engineered lower until its low tick was set at 10:15 a.m. China Standard Time on their Friday morning. Its ensuing rally ran into 'something' three hours and change later -- and it didn't do much from that point until the noon silver fix in London was done. It then crept mostly quietly higher until 'da boyz' reappeared minutes after 12:15 p.m. in COMEX trading in New York -- and they quietly worked their magic until the market closed at 5:00 p.m. EDT.
The low and high ticks in gold were recorded as $3,278.90 and $3,352.70 in the June contract... an intraday move of $73.80 an ounce. The June/August price spread differential in gold at the close in New York yesterday was $28.60...August/October was $27.60 -- and October/December was $27.50 an ounce.
Gold was closed in New York on Friday afternoon at $3,323.30 spot...up only $19.10 on the day -- and $24.10 off its Kitco-recorded high tick. Net volume was a bit on the heavier side at 181,500 contracts -- and there were a bit over 51,000 contracts worth of roll-over/switch volume out of June and into future months...mostly August, of course, but with noticeable amounts into October, December, plus February 26.
I saw that 216 gold, plus only 7 silver contracts were traded in May yesterday, so it will be interesting to see just how much of that shows up in tonight's Daily Delivery and Preliminary Reports.
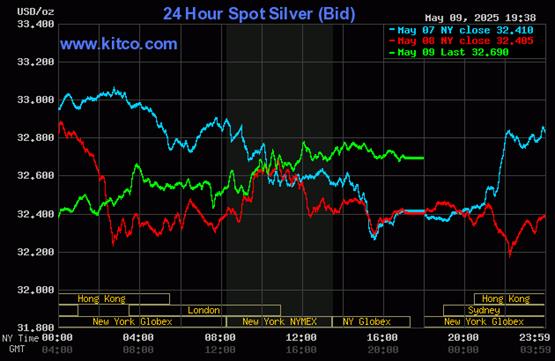
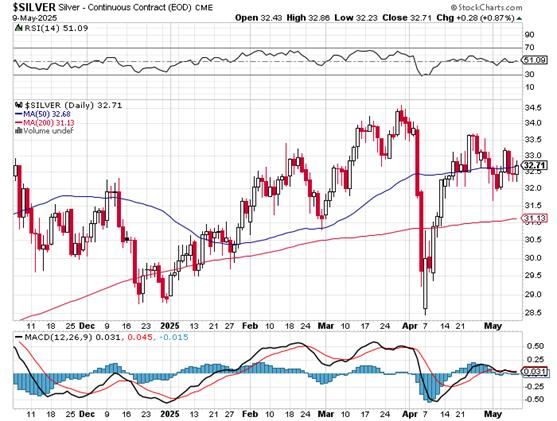
Up until around 8:55 a.m. in Globex trading in London on their Friday morning, silver's price path was managed in a similar fashion as gold's. From that juncture it chopped quietly sideways to a bit lower until it began to chop quietly higher starting at 9:15 a.m. in COMEX trading in New York. That rally attempt was capped for the final time at noon EDT -- and from that point it was forced to chop quietly sideways to a bit lower until the market closed at 5:00 p.m. EDT.
The low and high ticks in silver were reported by the CME Group as $32.36 and $33.04 in the July contract...an intraday move of 68 cents. The May/July price spread differential in silver at the close in New York yesterday was 23.8 cents...July/September was 30.9 cents -- and September/December was 42.2 cents an ounce.
Silver was closed on Friday afternoon in New York at $32.69 spot...up 28.5 cents from Thursday -- and 15 cents off its Kitco-recorded high tick. Net volume was bordering on fumes and vapours once again at a hair over 28,000 contracts -- and there were around 4,350 contracts worth of roll-over/switch volume out of July and into future months in this precious metal.
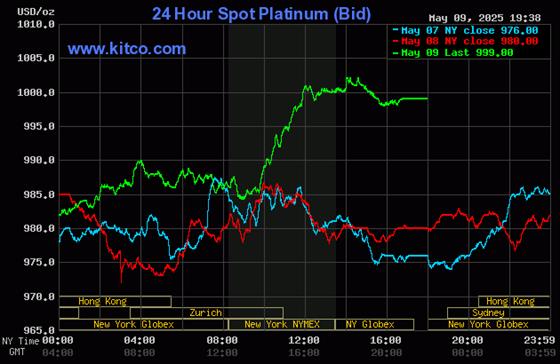
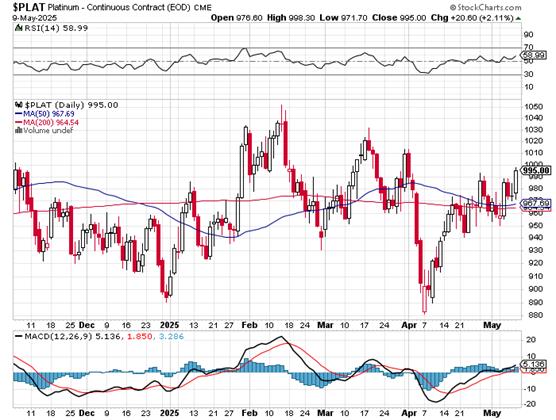
Platinum's low tick was also set at 10:15 a.m. in Shanghai -- and its ensuing rally ran into 'something' about the same time as silver's...around 9:45 a.m. in Globex trading in Zurich. It was then sold/engineered quietly and unevenly lower until the 10 a.m. EDT afternoon gold fix in London -- and away it went to the upside...running into 'something' at noon EDT...the moment it broke above $1,000 spot. It crept a few dollars higher until 2 p.m. in after-hours trading -- and was then sold a bit lower until 3:40 p.m. in after-hours trading. It didn't do much after that. Platinum was closed at $999 spot...up 19 bucks from Thursday -- and 3 dollars off its Kitco-recorded high tick.
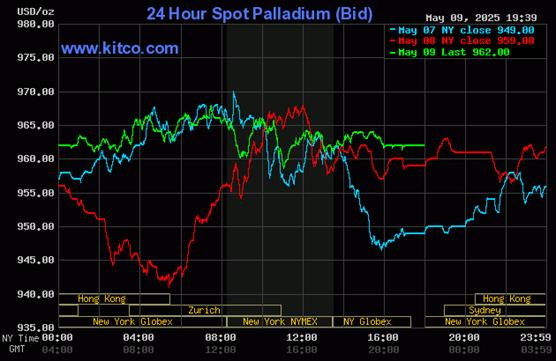
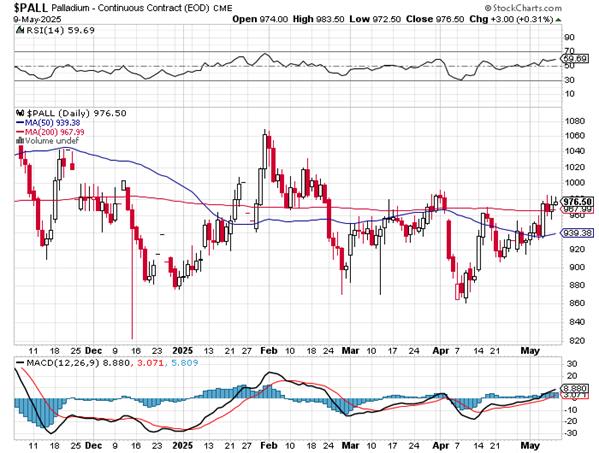
Palladium's early price path in Globex trading was mostly similar to the other three precious metals -- and 'da boyz' stepped in around 1:20 p.m. in Zurich. It was then sold quietly and unevenly lower until the 11 a.m. EDT Zurich close. It chopped a bit higher over the next hour -- and didn't do a whole heck of a lot after that. Palladium was closed at $962 spot...up 3 bucks on the day -- and 7 dollars off its Kitco-recorded high tick.
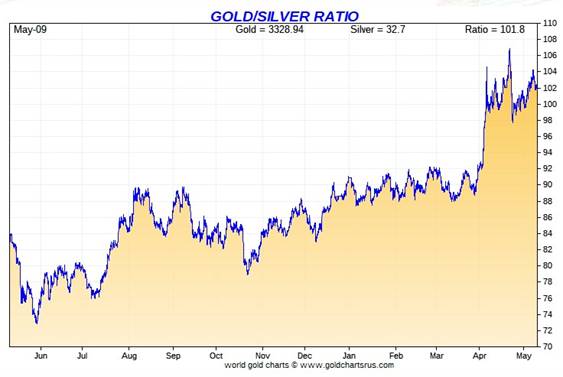
Based on the kitco.com spot closing prices in silver and gold posted above, the gold/silver ratio worked out to 101.7 to 1 on Friday...compared to 102.0 to 1 on Thursday.
Here's the 1-year Gold/Silver Ratio chart...courtesy of Nick Laird. Click to enlarge.
![]()
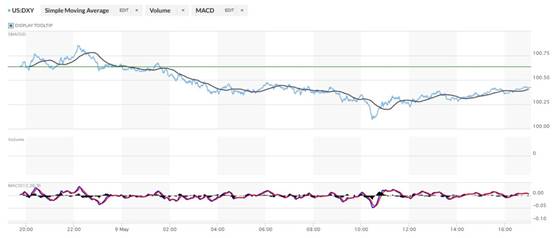
The dollar index closed very late on Thursday afternoon in New York at 100.64 -- and then began to chop quietly higher once trading commenced at 7:45 p.m. EDT on Thursday evening ...which was 7:45 a.m. China Standard Time on their Friday morning. That lasted until 10:10 a.m. CST -- and from that point it stair-stepped its way broadly and quietly lower until it appeared to get saved at its 10:28 a.m. EDT low tick. It rallied a bit until 11:18 a.m. -- and then crawled quietly and a tad unevenly higher until the market closed at 5:00 p.m. EDT.
The dollar index finished the Friday trading session in New York at 100.34...down 30 basis points from its close on Thursday -- and 8 basis points below its indicated close on the DXY chart below.
Here's the DXY chart for Friday...thanks to marketwatch.com as usual. Click to enlarge.
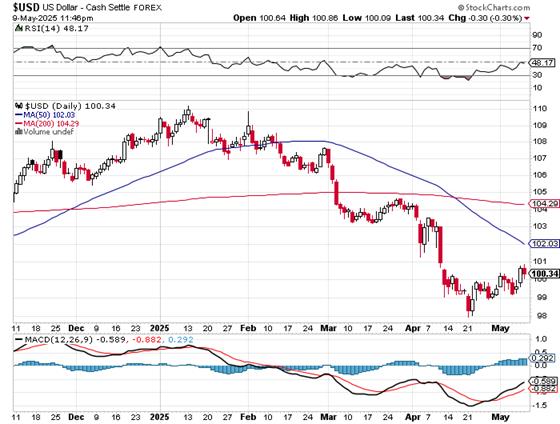
Here's the 6-month U.S. dollar index chart...courtesy of stockcharts.com as always. The delta between its close...100.34...and the close on DXY chart above, was zero basis points for the second day in a row. Click to enlarge
.
U.S. 10-year Treasury: 4.3750%...up 0.0020/+(0.05%)...as of the 1:59:50 p.m. CDT close
The Fed had to step in shortly after the COMEX open on Friday morning to work their magic, or the yield on the ten-year would have closed far higher than it did.
The 10-year closed up 5.30 basis points on the week...mostly because of the big jump higher on Thursday.
Here's the 5-year 10-year U.S. Treasury chart from the yahoo.com Internet site -- which puts the yield curve into a somewhat longer-term perspective. Click to enlarge.
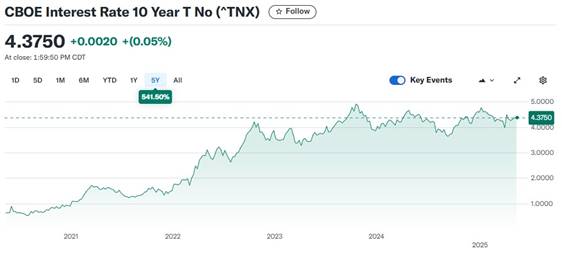
As I continue to point out in this spot every week, the 10-year hasn't been allowed to trade above its 4.92% high tick set back on October 15, 2023 -- and it's more than obvious from the above chart that it will he held at something under 5% until further notice, as yield-curve control is now firmly in place.
![]()
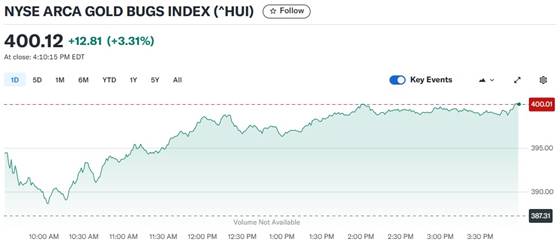
The gold shares opened higher once trading began at 9:30 a.m. in New York on Friday morning -- and then dipped a bit along with a brief 'swoon' in the gold price until their low ticks were set minutes after 10 a.m. EDT. They then took two broad steps higher from there until 2 p.m. -- and despite the fact that the gold price was being quietly engineered lower, the stocks hung in there for the rest of the day -- as the HUI closed up 3.31 percent. Here's the chart...courtesy of Yahoo Finance once again. Click to enlarge.
Despite the milquetoast performance of the silver price on Friday, the silver equities far outperformed their golden brethren, as Nick Laird's Silver Sentiment Index closed higher by 5.66 percent. Click to enlarge.
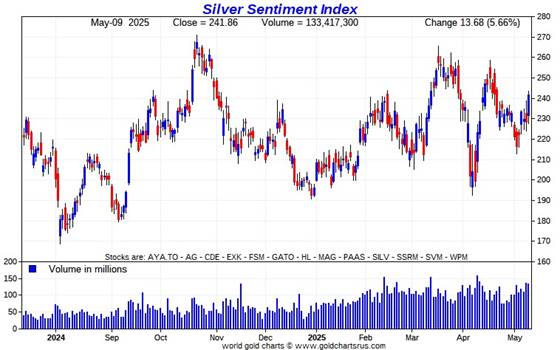
The hands-down star for the second day in a row was Coeur Mining, as it closed up a further 12.48 percent -- and the underperformer was Aya Gold & Silver, as it closed unchanged... despite this apparently good news.
There was also this news from SSR Mining on Thursday.
The new short report came out on Friday afternoon -- and it showed that the short position in First Majestic Silver rose to 22.96 million shares sold short on the NYSE...an increase of 26.89% from the last report that came out two weeks ago. That amount represents 5.29% of the float -- and is nothing special.
The silver price premium in Shanghai over the U.S. price on Friday was 7.62 percent.
The reddit.com/Wallstreetsilver website, now under 'new' and somewhat improved management, is linked here. The link to two other silver forums are here -- and here.
![]()
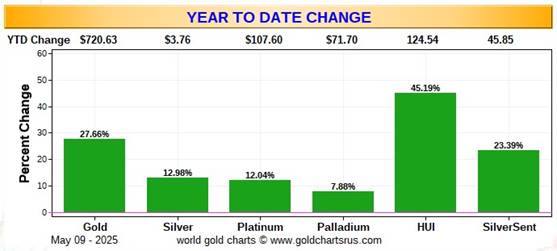
Here are the usual three charts that appear in this spot in every weekend missive. They show the changes in gold, silver, platinum and palladium in both percent and dollar and cents terms, as of their Friday closes in New York — along with the changes in the HUI and the Silver Sentiment Index.
Here's the weekly chart -- and it's back to being wall-to-wall green. Although the silver shares have been outperforming their golden cousins by a bit all week, it was the standout 30+% increase in the share price of Coeur Mining over the last two business days that really supercharged the Silver Sentiment Index. Click to enlarge.
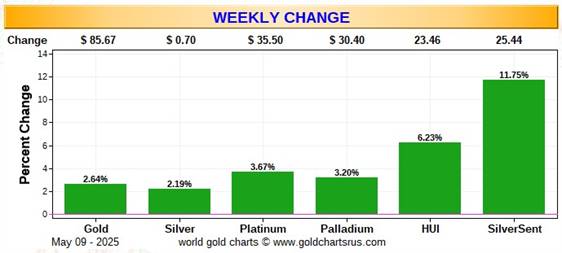
Here's the month-to-date chart -- and the big gain by Coeur Mining sure made a difference here as well. I'm just delighted that it's a wonderful shade of green across the board. But it should be noted that the big price pressure by 'da boyz' month to date has all been gold and silver-related...which is why platinum and palladium have been the stars so far. Click to enlarge.
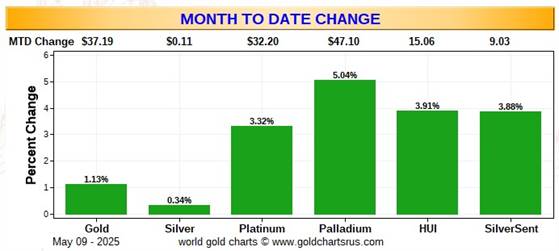
Here's the year-to-date chart -- and the big gain by Coeur is lost here -- and the underperformance of silver and its associated equities...courtesy of the collusive commercial traders of whatever stripe...is painfully obvious. Click to enlarge.
Of course -- and as I mention in this spot every Saturday -- and will continue to do so...is that if the silver price was sitting close to a new all-time high of 'whatever' dollars an ounce, like gold is sitting at its current price of $3,323 spot...within six or so percent of its all-time high...it's a given that the silver equities would be outperforming their golden cousins...both on a relative and absolute basis -- and by a country mile. That day lies in our future... somewhere.
![]()
The CME Daily Delivery Report for Day 9 of May deliveries, showed that 163 gold -- and 558 silver contracts were posted for delivery within the COMEX-approved depositories on Tuesday.
In gold, the only short/issuer that mattered was Stonex Financial, issuing 160 contracts out of its house account. There were seven long/stoppers in total -- and the four biggest were Canada's BMO [Bank of Montreal] Capital Markets, British bank Standard Chartered, British bank HSBC and JPMorgan...picking up 47, 41, 38 and 21 contracts...the first two banks on the list for their respective house accounts.
In silver, the two largest of the three short/issuers in total were Citigroup and Stonex Financial, issuing 500 and 51 contracts out of their respective house accounts. The only two long/stoppers that mattered were JPMorgan and the CME Group, picking up 377 and 169 contracts respectively...the CME Group for their own account.
The CME Group immediately reissued theirs as 5x169=845 of those one-thousand ounce good delivery bar micro silver futures contracts. The two long/stoppers for those were ADM and Advantage, picking up 542 and 303 contracts for their respective client accounts.
The link to yesterday's Issuers and Stoppers Report is here.
Month-to-date there have already been 16,125 gold contracts issued/ reissued and stopped -- and that number in silver is 14,257 COMEX contracts. In platinum, it's 355 contracts -- and in palladium...4.
The Preliminary Report for the Friday trading session showed that gold open interest in May rose by 154 contracts, leaving 393 still open, minus the 163 contracts out for delivery on Tuesday as per the above Daily Delivery Report. Thursday's Daily Delivery Report showed that only 11 gold contracts were posted for delivery on Monday, so that means that 154+11=165 more gold contracts were added to May deliveries.
Silver o.i. in May dropped by 113 contracts, leaving 1,128 still around...minus the above-mentioned 558 contracts out for delivery on Tuesday. Thursday's Daily Delivery Report showed that 118 silver contracts were actually posted for delivery today, so that means that 118-113=5 more silver contracts were added to the May delivery month.
Total gold open interest on Friday increased by a net 1,747 COMEX contracts. Total silver o.i. also rose, it by a net 641 COMEX contracts. Not big numbers in either precious metal, which is encouraging.
[I checked the final total open interest numbers for the Thursday trading session -- and they showed a decent downward adjustment in gold...from -4,160 contracts, down to -5,401 contracts. Total silver open interest also decreased by a very decent amount...from +280 contracts, down to -2,047 COMEX contracts.]
June open interest in silver fell by 50 contracts yesterday, leaving 3,146 still open.
![]()
And after a deposit into GLD on Thursday, there was a withdrawal from it on Friday, as an authorized participant removed 55,752 troy ounces of gold. However, there were 19,461 troy ounces of gold added to GLDM. And after no action for three days over at SLV, an a.p. added 2,000,641 troy ounces of silver to it on Friday.
The new short report showed up on The Wall Street Journal's website late on Friday afternoon EDT -- and it showed that the short position in SLV fell from 58.28 million shares sold short...down to 43.25 million shares...a decline of 25.78%...but still 8.76 percent of all SLV shares outstanding. The short position in GLD went in the other direction, rising from 11.87 million shares sold short...up to 14.48 million shares sold short, an increase of 21.99 percent.
The short position in SLV remains outrageously high -- as none of those shares have any physical silver backing them as required by their prospectus. It's just another way that 'da boyz' use to keep the silver price as low as possible -- and for as long as possible. The short position in gold is of no concern.
And just as a point of interest...the short position in PSLV is only a tiny fraction of 1 percent of the total shares outstanding...because only 334,475 shares are sold short of the 539.19 million shares issued.
The SLV borrow rate started the Friday session at 1.03 % -- and finished it at 0.81 percent...with 2.9 million shares available. The GLD borrow rate started the day at 0.70% -- and closed at 0.74%...with 3.1 million shares available for shorting purposes.
In other gold and silver ETFs and mutual funds on Earth on Friday...net of any changes in COMEX, GLD, GLDM and SLV activity, there were a net 46,196 troy ounces of gold added...but a net 75,329 troy ounces of silver were removed.
And still nothing from the U.S. Mint -- and nothing month-to-date, either. There's still no Q4/2024 sales report, or 2024 Annual Report from the Royal Canadian Mint.
![]()
The only activity in gold over at the COMEX-approved depositories on the U.S. east coast on Thursday were the 22,864 troy ounces received at JPMorgan. Nothing was shipped out...for a change. In the paper department, there were 20,477 troy ounces transferred from the Registered category and back into Eligible. The largest amount were the 13,050 troy ounces transferred over at Malca-Amit USA...followed by the 7,137.522 troy ounces/222 kilobars over at Brink's, Inc. The link to Thursday's COMEX gold activity is here.
There was certainly no let-up in silver, as 2,238,415 troy ounces were received -- and 1,457,165 troy ounces were shipped out.
The largest 'in' amount by far were the 1,942,330 troy ounces received at JPMorgan -- and the two largest 'out' amounts were the 617,124 troy ounces/one truckload that arrived at Loomis International...followed by the one truckload/600,214 troy ounces received at CNT.
There was pretty impressive paper activity as well. The largest amount were the 594,672 troy ounces/one truckload transferred from the Eligible category and into Registered over at CNT...with the remaining 315,293 troy ounces getting transferred in the opposite direction, from Registered and back into Eligible over at JPMorgan.
The link to Thursday's monstrous COMEX silver action is here.
The Shanghai Futures Exchange reported that a net 79,638 troy ounces of silver were added to their inventories on Friday, which now stands at 30.044 million troy ounces.
![]()
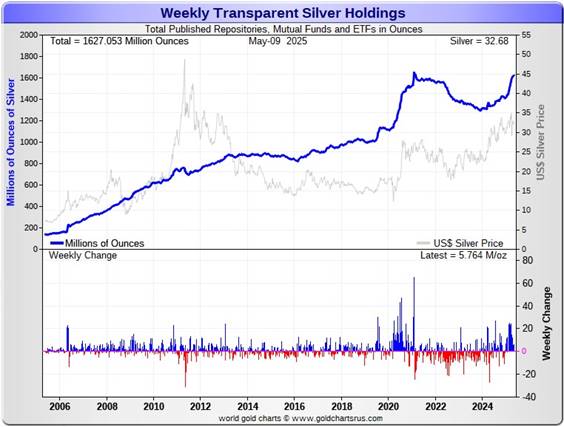
Here are the usual 20-year charts that show up in this space in every weekend column. They show the total amounts of physical gold and silver held in all known depositories, ETFs and mutual funds as of the close of business on Friday.
During the business week just past, there were a net 2.325 million troy ounces of gold withdrawn...and virtually all of it because of what's been departing the COMEX -- but a net 5.764 million troy ounces of silver were added during that same time period, with all of that amount going into the COMEX. Click to enlarge.
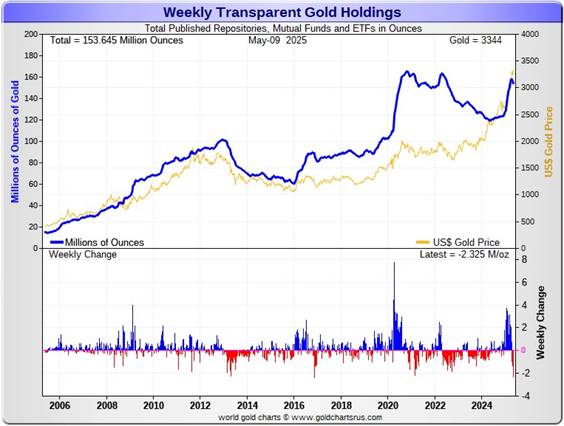
According to Nick Laird's data on his website, a net 5.088 million troy ounces of gold were removed from all the world's known depositories, mutual funds and ETFs during the last four weeks -- and sole reason for that was because of the 5.422 million troy ounces that were shipped out of the COMEX. Most of the other ETF and mutual funds had decent inflows in the last four weeks.
And it should be noted on the gold chart above, that despite the fact that we're well north of $3,000 in gold -- and have been in record high price territory for a long while now, the amount of gold held by all the world's mutual funds, depositories and ETFs is not even close to a new all-time high.
But a net 23.577 million troy ounces of silver were were added during that same 4-week time period, with a net 6.106 million oz. of that amount going into the COMEX...5.608 million ounces into iShares/SSLN -- and 2.712 million into WisdomTree/PHPM. The 'in' list goes on and on. There were no big not outflows.
Retail bullion sales, from what I've heard from my sources, are barely OK -- and that's being kind. It remains a buyer's market for physical at the retail level for the moment -- and why that's so is still a mystery. John Q. Public is nowhere to be seen -- although the big institutional investors are starting to make their presence felt.
At some point there will be even larger quantities of silver and gold required by all the rest of these ETFs and mutual funds once serious institutional buying really kicks in -- and as I just pointed out, there certainly have been signs of that across the board over the last month...silver in particular.
The really big buying lies ahead of us when the silver price is finally allowed to rise substantially, which I'm sure is something that the powers-that-be in the silver world are keenly aware of. At the moment, they're certainly keeping it on a short price leash -- as the 100+ to 1 gold/silver ratio remains a perversion...a testament to the ongoing price management on the COMEX.
And as Ted Butler stated some time ago now, it stands to reason that JPMorgan has parted with a large portion of the one billion troy ounces that they'd accumulated since the drive-by shooting that commenced at the Globex open at 6:00 p.m. EDT on Sunday, April 30, 2011.
I suspect that most of the silver flown into the COMEX from London and other places so far this year...230+ million ounces...came from their stash -- and they continue to build their COMEX silver reserves in New York as well. I'm sure they've been supplying the ever-increasing amounts of silver that are now flowing into the rest of world's ETFs and mutual funds too.
Little has changed from last week, as the physical demand in silver at the wholesale level continues unabated -- and COMEX silver deliveries have snapped back sharply in May so far. The amount of silver being physically moved, withdrawn, or changing ownership remains extremely strong... including May COMEX deliveries, where over 71 million oz. have been delivered so far.
So far this year -- and not including that 71 million ounces delivered in May, there have been 217.211 million ounces of silver deposited in the COMEX -- and 47.703 million troy ounces have been shipped out year-to-date. That's huge movement.
New silver has to be brought in from other sources [JPMorgan in London] and elsewhere to meet the ongoing demand for physical metal...as the metal currently sitting in New York was obviously already spoken for and not for sale. This demand will continue until available supplies are depleted...which will most likely be the moment that JPMorgan & Friends stop providing silver to feed this deepening structural deficit, now in its fifth year according to the latest Report from The Silver Institute.
The vast majority of precious metals being held in these depositories are by those who won't be selling until the silver price is many multiples of what it is today.
Sprott's PSLV is the third largest depository of silver on Planet Earth with 186.7 million troy ounces...unchanged for the last two weeks -- but a great distance behind the COMEX, now the largest silver depository, where there are 503.6 million troy ounces being held...up a net 4.6 million troy ounces this past week...but minus the 103 million troy ounces being held in trust for SLV by JPMorgan.
That 103 million ounce amount brings JPMorgan's actual silver warehouse stocks down to around the 113 million troy ounce mark...quite a bit different than the 216.0 million they indicate they have...up another 8.9 million troy ounces on the week.
PSLV remains a very long way behind SLV as well -- as they are now the second largest silver depository after the COMEX, with 450.8 million troy ounces as of Friday's close...up a net 200,000 troy ounces from last week.
The latest short report [for positions held at the close of business on Wednesday, April 30] showed that the short position in SLV fell by a further 25.78%...from the 58.28 million shares sold short in the prior report...down to 43.25 million shares in this latest report...a bit under 9 percent of total SLV shares outstanding. This amount remains grotesque, obscene -- and fraudulent beyond description...as there is no physical silver backing any of it as the SLV prospectus requires.
BlackRock issued a warning several years ago to all those short SLV, that there might come a time when there wouldn't be enough metal for them to cover. That would only be true if JPMorgan decides not to supply it to whatever entity requires it...which is most certainly a U.S. bullion bank, or perhaps more than one.
The next short report...for positions held at the close of trading on Thursday, May 15...will be posted on The Wall Street Journal's website on Tuesday evening EDT, May 27.
Then there's that other little matter of the 1-billion ounce short position in silver held by Bank of America in the OTC market...with JPMorgan & Friends on the long side. Ted said it hadn't gone away -- and he'd also come to the conclusion that they're short around 25 million ounces of gold with these same parties as well.
The latest OCC Report [hat-tip to Justin Newman] came out a few week ago for Q4/2024 and it showed that the precious metal derivatives held by the four largest U.S. banks fell by ten percent from Q3/2024...with most of that drop coming from the $38 billion/12% decrease over at JPMorgan. Goldman's tiny position was up an immaterial amount -- and Citigroup's derivative positions in the precious metals rose by 11% -- and BofA's position fell by about 31%. But with JPMorgan holding 56% of all the precious metals derivatives -- and Citibank holding 32% of the total, it's only those two banks that matter.
But as I keep pointing out in this spot every weekend, the OCC indicator is flawed for two very important reasons, as way back 10-15 years ago, this report used to include the top dozen or so U.S. banks -- and included the likes of Wells Fargo and Morgan Stanley, amongst others...that are card-carrying members of the Big 8 shorts. Now the list is down to just four banks...so a lot of data is hidden...which is certainly the reason why the list was shortened. On top of that, the list doesn't include the non-U.S. banks that are members of the Big 8 shorts: British, French, German, Canadian -- and Australian.
![]()
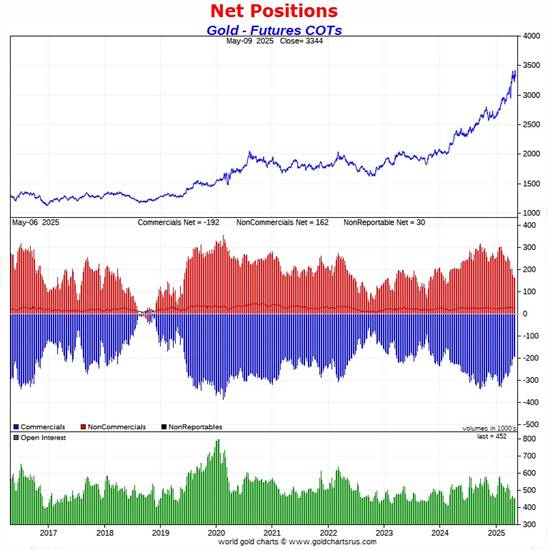
The Commitment of Traders Report, for positions held at the close of COMEX trading on Tuesday, showed a small decline in the Commercial net short position in silver, but it was raptor long selling that made it so. In actual fact, the Big 8 increased their short position by a small amount. There was a smallish increase in the commercial net short position in gold as well.
But -- and as I pointed out in yesterday's missive...because of the price action since the Tuesday cut-off, all of this data is very much 'yesterday's news'.
In silver, the Commercial net short position declined by 1,461 COMEX contracts, or 7.305 million troy ounces of the stuff.
They arrived at that number through the sale of 9,094 long contracts...but also bought back 10,555 short contracts -- and it's the difference between those two numbers that represent their change for the reporting week.
With such a small change in the Commercial net short position, there wasn't much going on under the hood in the Disaggregated COT Report. The Managed Money traders decreased their net long position by 856 contracts...as did the Nonreportable/small traders...decreasing theirs by 770 COMEX contracts. This meant that the traders in the Other Reportables category had to have increased their net long position to balance things out...which they accomplished by increasing their net long position by 165 COMEX contracts.
Doing the math: 856 plus 770 minus 165 equals 1,461 COMEX contracts... the change in the Commercial net short position.
The Commercial net short position in silver now stands at 67,803 COMEX contracts/339.015 million troy ounces...down those 1,461 contracts from the 69,264 COMEX contracts/346.320 million troy ounces that they were short in last Friday's COT Report.
The Big 4 shorts decreased their net short position for the sixth week in a row, this time by 749 COMEX contracts...from 52,365 contracts, down to 51,616 contracts. Despite these continuous so-called improvements over that time period, their short position remains very bearish. This is the lowest short position they've held since January 7...which isn't isn't saying a lot.
But the Big '5 through 8' shorts increased their net short position for the second week in a row, this time by 1,130 COMEX contracts...from the 20,610 contracts in last Friday's COT Report, up to 21,740 contracts in yesterday's COT Report. During the last two weeks, they've increased their short position by 4,991 contracts. And because of that, it's most likely that there's a least one Managed Money and/or Other Reportables trader with large enough short positions to be in this category.
The Big 8 shorts in total increased their overall net short position from 72,974 contracts, up to 73,356 COMEX contracts week-over-week...an increase of 381 COMEX contracts.
But since the Commercial net short position fell by 1,461 contracts in yesterday's COT Report -- and the Big 8 increased their net short position by 381 contracts, this meant that Ted's raptors...the small commercial traders other than the Big 8...had to have been buyers during the reporting week -- and they were...increasing their net long position by 1,461+381=1,842 COMEX contracts. In last week's COT Report, they were net long 3,711 COMEX contracts. In this week's, they're up to a net long position of 5,553 contracts.
It was the raptors purchasing long contracts that caused the Commercial net short position to decline during this reporting week...which is obviously just a mathematical decrease...not a decrease at all.
Here's Nick's 9-year COT chart for silver -- and updated with the above data. Click to enlarge.
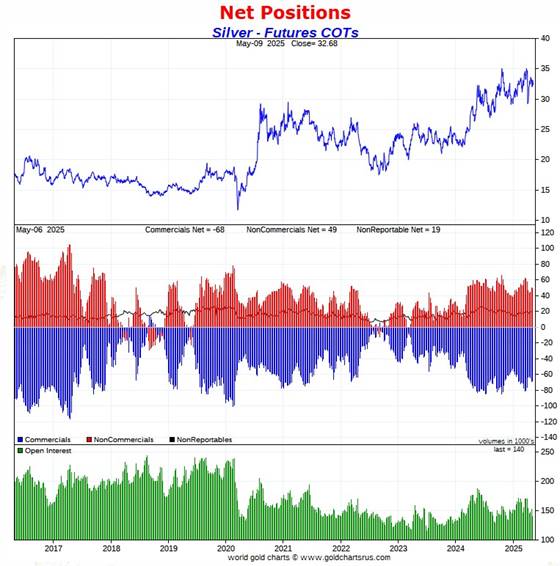
So, the all important [and only thing that matters] short position of the Big 8 increased for the third week in a row -- but that fact was masked by the purchase of long positions by the small commercial traders, which is what caused the Commercial net short position to fall. This, as I pointed out in the paragraph above the chart, is a mathematical decrease in the commercial net short position...which does nothing to hide the 800 lb. gorilla still sitting in the living room.
We remain a very considerable distance from a bullish configuration in silver from a COMEX futures market perspective...30,000+ COMEX contracts worth -- and most of that would have to come out of the Big 4 short category...most likely the Big '1 or 2'.
As it's been for decades, it only matters what the collusive Big 8 commercial traders do... especially the Big 1 or 2 as just mentioned...both of which are U.S. bullion banks, I'm sure.
The Big 8 collusive commercial traders are net short 52.3 percent of the total open interest in silver in the COMEX futures market...up huge from the 47.8 percent they were net short in the last COT Report. The reason for that big jump was the fact that total open interest cratered by 12,408 contracts during the reporting week...which obviously affects the percentage calculation.
But nothing has changed with regards to that ongoing and deepening structural deficit in the physical market...which is now well into its fifth consecutive year.
Of course not to be forgotten -- and which also has a huge and negative impact on the silver price, is the outrageous and grotesque short position in SLV...which now stands at 43.25 million shares/troy ounces...just under 9% of total open interest...as of last short report that came out yesterday.
Not one of those ounces sold short has any physical silver backing it. The next short report, for positions held at the close of COMEX trading on Thursday, May 15 will be posted on the WSJ's website early Tuesday evening on May 27.
Of course -- and as I pointed out earlier, it's entirely within the realm of possibility that some of the big shorts in SLV are "short against the box"...so the actual short position in SLV may not be as large as it appears.
![]()
In gold, the commercial net short position increased by a tiny 1,342 COMEX contract, or 134,200 troy ounces of the stuff, which is barely a rounding error in the grand scheme of things. And, like the COT report in silver, is already 'yesterday's news' because of the price action since the Tuesday cut-off.
They arrived at that number by selling 5,543 long contracts, but also bought back 4,201 short contracts -- and it's the difference between those two numbers that represents their change for the reporting week.
Under the hood in the Disaggregated COT Report it was only the Managed Money traders that were sellers during the reporting week, reducing their net long position by a net 3,804 COMEX contracts. The Other Reportables and Nonreportable/small traders were net buyers, as the former increased their net long position by 2,983 contracts -- and the latter by 2,163 COMEX contracts.
Doing the math: 2,983 plus 2,163 minus 3,804 equals 1,342 COMEX contracts, the change in the commercial net short position.
The commercial net short position in gold now sits at 192,103 COMEX contracts/19.210 million troy ounces of the stuff...up those 1,342 contracts from the 190,761 contracts/19.076 million troy ounces they were short in last Friday's COT Report.
The Big 4 shorts in gold increasedtheir net short position by 6,470 contracts this reporting week...from the 112,967 contracts they were short in the last COT report, up to 119,437 contracts in yesterday's report. This still remains their smallest short position since March 1 of last year, when they were short 114,723 COMEX contracts -- and vastly improved from the 198,271 contracts there were net short in the January 21 COT Report.
The Big '5 through 8' shorts decreased their net short position for the fifth week in a row...from 69,135 contracts they were short in last Friday's COT Report, down to 62,885 contracts held short in the current report...a decrease of a further 6,250 COMEX contracts. This is not their lowest short position, but it's getting very close to it.
And because of the size of the gross short position in the Managed Money category, I still suspect that there's at least one of them with a large enough short position to be in the Big '5 through 8' category.
The Big 8 short position rose from 182,322 contracts/18.210 million troy ounces in last Friday's COT Report...up to 182,322 contracts/18.232 million troy ounces in yesterday's...a decrease of an irrelevant 220 COMEX contracts.
But since the commercial net short position rose by 1,342 COMEX contracts during the reporting week -- and the Big 8 commercial short position rose by only 220 COMEX contracts, that meant that Ted's raptors...the small commercial traders other than the Big 8 had to have been sellers during the reporting week -- and they were. They increased their short position by 1,342-220=1,122 COMEX contracts. Their short position is now up to 9,781 contracts...from the 8,659 contract short position they held in last Friday's COT Report.
And because of the approximately 65,000 contract drop in the raptor short position since February 14, their remaining short position looks pretty 'normal' -- and is no longer of any concern.
Here's Nick's 9-year COT chart for gold -- and updated with the above data. Click to enlarge.
This COT Report in gold was one big 'nothingburger' -- and as mentioned further up, is already 'yesterdays' news' anyway.
The Big 8 collusive traders are short 40.3 percent of total open interest in gold in the COMEX futures market...unchanged from the 40.3 percent they were short in the prior COT Report -- and as I pointed out a few paragraphs ago, the short position held by Ted's raptors is no longer a negative factor from a COMEX futures market perspective...as it's now well back into 'normal' territory for it.
The collusive commercial traders of whatever stripe in gold have been slowly reducing their short position over the last several months. The Big 8 short position is now 79,373 contracts lower than it was at its high on January 21 -- and Ted Butler's raptors, the small commercial traders other than the Big 8, have reduced their short position by a very hefty 66,942 COMEX contracts since their high of February 14. So the commercial traders in total have reduced their short position in gold by 146,315 contracts/14.632 million troy ounces since early part of this year. It's been their buying of long contracts that has propelled the gold price to its recent new record high.
Of course there's been even more improvement in the commercial net short positions in both gold and silver since the Tuesday cut-off...more in gold than in silver, I suspect -- and for that reason, the set-up in gold from a COMEX futures market perspective remains very bullish.
But there are still two more trading days left to go in the ongoing reporting week -- and anything can happen between now and the COMEX close on Tuesday, which is the cut-off for next Friday's COT Report.
As I pointed out in this space last week...the sole reason why the silver price has languished, is that these same collusive commercial traders in gold have been loath to cover their short positions in silver, because the moment that they move to do so...it's "to the moon, Alice!"...as there will be few traders to go short against them.
However, the Big 8's ultra aggressive efforts to cover their silver shorts during April...using engineered price declines as their weapon of choice...didn't help them much. That only leaves them the option of buying longs directly in the open market in order to cover, which would be a death sentence -- and Ted Butler's "Bonfire of the Silver Shorts" scenario would unfold within days, if not hours.
To show you just how ugly and apparently hopeless it is for them...the Big 8 commercial traders were net short 72,788 COMEX silver contracts back on December 31 -- and despite their huffing and puffing since then, they were net short 73,356 contracts in yesterday's report.
As I pointed out further up, the Big 8 would have to cover 30,000 short contracts minimum to get back to a really bullish configuration in silver...like they are in gold at the moment. Only a draconian price move to the downside would accomplish that, as those long and strong silver have proven very reluctant to sell, regardless of the amount of price pressure 'da boyz' have laid on them so far this year. That includes the pounding handed out since the COMEX close on Tuesday...but only on ultra low volumes. Monster engineered price moves to the downside require volumes past Jupiter...or maybe even Saturn -- and I just don't think that's in the cards.
'Da boyz' appear stuck holding this permanent and grotesque short position silver -- and how this is resolved remains to be see. However, it will be the determining factor in the future price of silver, which is something else that Ted Butler will be proven right about.
![]()
In the other metals, the Managed Money traders in palladium decreased their net short position by 1,361 COMEX contracts -- but remain net short palladium by 12,383 contracts...57.4 percent of total open interest. The commercial traders in the Producer/ Merchant category remain on the long side by a tiny amount for the fifth week in a row...but the commercial traders in the Swap Dealers category remain mega net long palladium by 9,117 contracts. The traders in the Other Reportables and Nonreportable/small trader categories remain net long by decent amounts as well.
And it shouldn't be forgotten that the world's banks remain net long 19.1 percent of total open interest in palladium in the COMEX futures market as of the latest Bank Participation Report that came out yesterday.
In platinum, the Managed Money didn't do much...decreasing their net short position by a paltry 382 COMEX contracts during the reporting week -- and remain net short platinum by 3,194 COMEX contracts.
The commercial traders in the Producer/Merchant category in platinum are mega net short 19,198 COMEX contracts -- but the Swap Dealers in the commercial category are net long 5,158 contracts. The traders in both the Other Reportables and Nonreportable/small traders categories remain net long platinum by very hefty amounts...especially the Other Reportables.
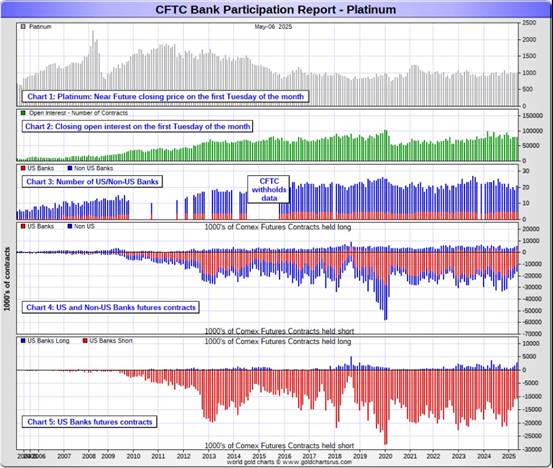
It's mostly the world's banks in the Producer/Merchant category that are 'The Big Shorts' in platinum in the COMEX futures market, as per May's Bank Participation Report that came out yesterday -- and have decreased their short position in platinum by a bit more since the April report, especially the non-U.S. banks.
In copper, the Managed Money traders increased their net long position by a further 3,159 contracts -- and are net long copper by 22,085 COMEX contracts...about 552 million pounds of the stuff as of yesterday's COT Report...up from the 473 million pounds they were net long copperin last Friday's COT report.
Copper, like platinum, continues to be a wildly bifurcated market in the commercial category. The Producer/Merchant category is net short 33,026 copper contracts/825 million pounds -- while the Swap Dealers are net long 10,671 COMEX contracts/267 million pounds of the stuff.
Whether this means anything or not, will only be known in the fullness of time. Ted said it didn't mean anything as far as he was concerned, as they're all commercial traders in the commercial category. However, this bifurcation has been in place for as many years as I've been keeping records -- and that's a long time.
In this vital industrial commodity, the world's banks...both U.S. and foreign... are net long 6.6 percent of the total open interest in copper in the COMEX futures market as shown in the May Bank Participation Report that came out yesterday -- and down a bit from the 7.3 percent they were net long in April's.
At the moment it's the commodity trading houses such as Glencore and Trafigura et al., along with some hedge funds, that are net short copper in the Producer/Merchant category, as the Swap Dealers are net long, as pointed out above.
The next Bank Participation Report is due out on Friday, June 6.
![]()
Here’s Nick Laird’s “Days to Cover” chart, updated with the COT data for positions held at the close of COMEX trading on Tuesday, May 6. It shows the days of world production that it would take to cover the short positions of the Big 4 — and Big '5 through 8' traders in every physically traded commodity on the COMEX. Click to enlarge.
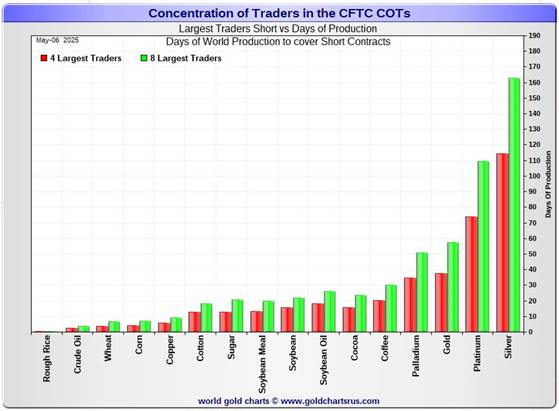
In this week's data, the Big 4 traders are short 115 days of world silver production...down about 1 day from the prior COT report. The ‘5 through 8’ large traders are short an additional 48 days of world silver production ...up about 2 days from the last COT Report, for a total of about 163 days that the Big 8 are short -- and up about 1 day from last Friday's COT report.
Those 163 days that the Big 8 traders are short, represents around 5.4 months of world silver production, or 366.780 million troy ounces/73,356 COMEX contracts of paper silver held short by these eight commercial traders. Several of the largest of these are now non-banking entities, as per Ted's discovery a year or so ago. May's Bank Participation Report continues to confirm that this is still the case -- and not just in silver, either.
The small commercial traders other than the Big 8 shorts, Ted's raptors, increased their long position in silver from 3,711 contracts...up to 5,553 contracts in yesterday's COT Report.
In gold, the Big 4 are short about 38 days of world gold production...up about 2 days from the prior COT Report. The Big '5 through 8' are short an additional 19 days of world production, down about 2 days from last the last report...for a total of 57 days of world gold production held short by the Big 8 -- and obviously unchanged from last Friday's COT Report.
As mentioned further up, the Big 8 commercial traders are net short 52.3 percent of the entire open interest in silver in the COMEX futures market as of yesterday's COT Report, up big from the 47.8 percent they were net short in last Friday's report. That percentage increase came about because of the huge 12,408 contract drop in total open interest, which obviously affects the calculation.
In gold, it's 40.3 percent of the total COMEX open interest that the Big 8 are net short, unchanged from last week. That's because there was virtually no change in both the commercial net short position -- and total open interest week-over-week.
And as I mentioned further up in the COT discussion in gold, the short position of Ted's raptors is no longer a factor of any kind in the total commercial net short position. Adding in their 9,781 contract short position, only increases the commercial net short position to 42.5 percent of total open interest. So their short position represents only 42.5-40.3=2.2 percentage points of total open interest. Back on February 14, that number was was about ten times that amount.
Ted was of the opinion that Bank of America is short about one billion ounces of silver in the OTC market, courtesy of JPMorgan & Friends. He was also of the opinion that they're short 25 million ounces of gold as well.
The latest OCC Report [hat-tip to Justin Newman] that came out about a month ago now for Q4/2024...showed that the precious metal derivatives held by the four largest U.S. banks fell by ten percent from Q3/2024...with most of that drop coming from the $38 billion/12% decrease over at JPMorgan. Goldman's tiny position was up an immaterial amount -- and Citigroup's derivative positions in the precious metals rose by 11% -- and BofA's position fell by about 31%. But with JPMorgan holding 56% of all the precious metals derivatives -- and Citibank holding 32% of the total of the four reporting banks, it's only those two banks that matter.
However, as just stated, that's only four of the U.S. banks. The likes of Wells Fargo and Morgan Stanley are not included, because they aren't the largest banks...even though their respective precious metal derivatives positions may be huge...which I suspect they are...that doesn't count for anything in this report, which is the reason that it's only marginally useful.
The short position in SLV now sits at 43.25 million shares as of the last short report that came out yesterday, for positions held at the close of COMEX trading on Wednesday, April 30 -- and is down 25.78% from the 58.28 million shares sold short on the NYSE in the prior report. This number remains off-the-charts grotesque and obscene -- and yet another way that 'da boyz' are controlling the silver price, as I mentioned further up.
In actual fact, the short position could be far less than stated above, if some of those traders are "short against the box".
The next short report is due out Tuesday, May 27...for positions held at the close of business on Thursday, May 15.
In the overall, the Big 8 commercial shorts decreased their short position in silver by a tad. But it was all the Big '5 through 8' -- and the change in the Big 8 short position in gold was immaterial.
As Ted Butler had been pointing out ad nauseam, the resolution of the Big 4/8 short positions will be the sole determinant of precious metal prices going forward -- and I'm happy to report, as I said a bunch of paragraphs ago, that the short position held by Ted's raptors in gold is no longer a factor going forward.
![]()
The May Bank Participation Report [BPR] data is extracted directly from yesterday's Commitment of Traders Report data. It shows the number of futures contracts, both long and short, that are held by all the U.S. and non-U.S. banks as of Tuesday’s cut-off in all COMEX-traded products.
For this one day a month we get to see what the world’s banks have been up to in the precious metals. They’re usually up to quite a bit -- and they certainly were again this past month.
[The May Bank Participation Report covers the five-week time period from April 1 to May 6 inclusive]
In gold, 5 U.S. banks are net short 75,948 COMEX contracts, down big from the 97,959 contracts that these same 5 U.S. banks were net short in the April BPR. This is their lowest net short position in gold in a year.
Also in gold, 25 non-U.S. banks are net short 107,797 COMEX contracts, down 20,129 contracts from the 127,926 contracts that 23 non-U.S. banks were short in April's BPR...their lowest short position since January, which isn't saying a lot.
At the low back in the August 2018 BPR...these non-U.S. banks held a net short position in gold of only 1,960 contacts -- so they've been back on the short side in a gargantuan way ever since. Only a handful of these banks hold meaningful short positions in gold. The short positions of the rest are of no consequence -- and never have been.
Although a lot of the largest U.S. and foreign bullion banks are in the Big 8 short category, some of the hedge fund/commodity trading houses are short even more grotesque amounts of gold in that category.
It's also a strong possibility that the BIS could be short gold in the COMEX futures market as well.
As of May's Bank Participation Report, 30 banks [both U.S. and foreign] were net short 40.6 percent of the entire open interest in gold in the COMEX futures market...down from the 45.3 percent that 28 banks were net short in the April BPR. This remains an obscene and manipulative short position.
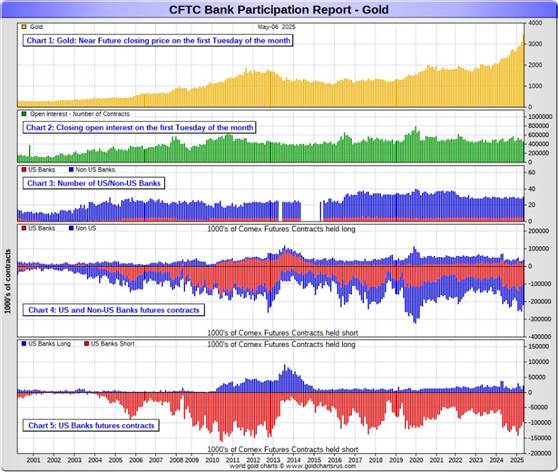
Here’s Nick’s BPR chart for gold going back to 2000. Charts #4 and #5 are the key ones here. Note the blow-out in the short positions of the non-U.S. banks [the blue bars in chart #4] when Scotiabank’s COMEX short position was outed by the CFTC in October of 2012. Click to enlarge.
In silver, 5 U.S. banks are net short 22,474 COMEX contracts, up a smallish 584 contracts from the 21,890 contracts that these same 5 U.S. banks were short in the April BPR...which is a negligible amount. So that big price smash in silver well below all the moving averages at the beginning of the reporting period didn't help them much, as they had to pile back on the short side during its ensuing rally.
The short holders in silver of the five U.S. banks in total, would be Citigroup, Wells Fargo, Bank of America, Goldman Sachs and JPMorgan.
Also in silver, 17 non-U.S. banks are net short 40,471 COMEX contracts, down 2,335 contracts from the 42,806 contracts that that 18 non-U.S. banks were net short in the April BPR...their lowest short position since December, which is also not saying much.
It's a given, based on silver deliveries so far this year, that HSBC, Barclays, Standard Chartered, BNP Paribas and Macquarie Futures hold by far the lion's share of the short positions of these non-U.S. banks...as do some of Canada's banks as well...with the Bank of Montreal and Scotia Capital/Scotiabank coming to mind.
And, like in gold, the BIS could also be actively shorting silver. However, the remaining short positions divided up between the remaining small handful of non-U.S. banks are immaterial — and have always been so....the same as most of the 20 non-U.S. banks in gold as well.
As of May's Bank Participation Report, 22 banks [both U.S. and foreign] were net short a grotesque 44.9 percent of the entire open interest in silver in the COMEX futures market — and up big from the 38.0 percent that 23 banks were net short in the April BPR...and up big because of the huge decrease in silver open interest during the five week reporting period, which affects the percentage calculation.
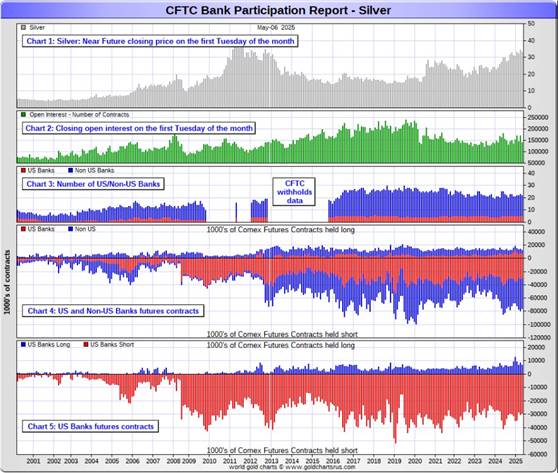
Here’s the BPR chart for silver. Note in Chart #4 the blow-out in the non-U.S. bank short position [blue bars] in October of 2012 when Scotiabank was brought in from the cold. Also note August 2008 when JPMorgan took over the silver short position of Bear Stearns—the red bars. It’s very noticeable in Chart #4—and really stands out like the proverbial sore thumb it is in chart #5. Click to enlarge.
In platinum, 5 U.S. banks are net short 7,926 COMEX contracts in the May BPR, down 1,268 contracts from the 9,194 contracts that these same 5 U.S. banks were short in the April BPR. This is the lowest short position since way back in October of 2018. They've been hard at work reducing their short position in the last six months or so.
At the 'low' back in September of 2018, these U.S. banks were actually net long the platinum market by 2,573 contracts...so they still have work to do just to get back to market neutral.
Also in platinum, 16 non-U.S. banks decreased their net short position by a hefty 2,219 contracts...from 4,662 contracts held by 13 banks in April's BPR... down to 2,443 contracts in the May BPR.
Back in the December 2023 BPR, these non-U.S. banks were net short a microscopic 35 platinum contracts...so they also have more work to do if they ever want to get back to that number.
As you know, platinum remains the big commercial shorts No. 2 problem child after silver -- and there's now a long-term structural deficit in it [and palladium] as well.
And as of May's Bank Participation Report, 21 banks [both U.S. and foreign] were net short 13.3 percent of platinum's total open interest in the COMEX futures market, down from the 17.5 percent that 18 banks were net short in April's BPR.
Here's the Bank Participation Report chart for platinum. Click to enlarge.
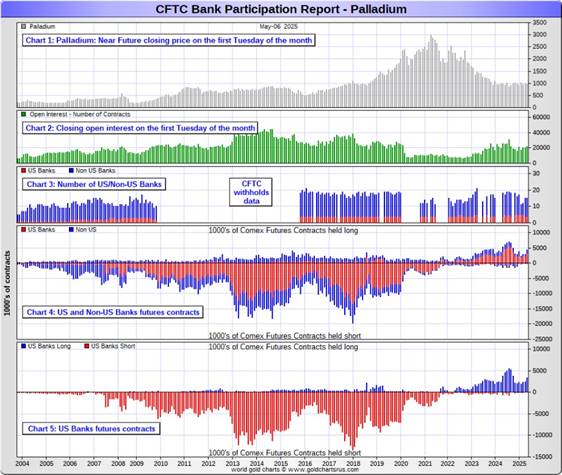
In palladium, 4 U.S. banks are net long 3,261 COMEX contracts in the May BPR, up 917 contracts from the 2,344 contracts that these same 4 U.S. banks were net long in the April BPR.
Also in palladium, 11 non-U.S. banks are net long 848 COMEX contracts...up from the 284 contracts that these same 11 non-U.S. banks were net long in the April BPR.
And as I've been commenting on for almost forever, the COMEX futures market in palladium is a market in name only, because it's so illiquid and thinly-traded. Its total open interest in yesterday's COT Report was only 21,543 contracts...compared to 77,994 contracts of total open interest in platinum...140,261 contracts in silver -- and 452,414 COMEX contracts in gold.
Total open interest in palladium has increased quite a bit over the last number of years, because I remember when it was less than 9,000 contracts. So it's nowhere near as illiquid as it used to be -- and it's also been helped along by the fact that the bid/ask is now only 40 bucks. It used to be $150 at one point way back when.
As I say in this spot every month, the only reason that there's a futures market at all in palladium, is so that the Big 8 commercial traders can control its price. That's all there is, there ain't no more.
As of this Bank Participation Report, 15 banks [both U.S. and foreign] are net long 19.1 percent of total open interest in palladium in the COMEX futures market...up from the 13.1 percent of total open interest that these same 11 banks were net long in the April BPR.
For the last 5 years or so, the world's banks have not been involved in the palladium market in a material way...see its chart below. And with them still net long, it's almost all hedge funds and commodity trading houses that are left on the short side. The Big 8 commercial shorts, none of which are banks, are short 43.7 percent of total open interest in palladium as of yesterday's COT Report...down from the 48.5 percent they were short in April's BPR.
Here’s the palladium BPR chart. Although the world's banks are net long at the moment, it remains to be seen if they return as big short sellers again at some point like they've done in the past. Click to enlarge.
Excluding palladium for obvious reasons, and almost all of the non-U.S. banks in gold, silver and platinum...only a handful of the world's banks, most likely no more than a dozen or so in total -- and mostly U.S. and U.K.-based...along with French bank BNP Paribas...continue to hold meaningful short positions in the other three precious metals...although I won't let Canada's Bank of Montreal or Scotia Capital/Scotiabank off the hook just yet...nor Deutsche Bank in gold.
As I pointed out above, some of the world's commodity trading houses and hedge funds are also mega net short the four precious metals...far more short than the U.S. banks in some cases. They have the ability to affect prices if they choose to exercise it...which I'm sure they're doing at times -- and this is particularly obvious in the thinly-traded and illiquid palladium market. But it's still the collusive Anglo/American/Western bullion bank cartel in the commercial category that are at Ground Zero of the price management scheme in the COMEX futures market in the other three.
And as has been the case for years now, the short positions held by the Big 4/8 traders is the only thing that matters...especially the short positions of the Big 4...or maybe only the Big 1 or 2 in both silver and gold. How this is ultimately resolved [as Ted kept pointing out] will be the sole determinant of precious metal prices going forward.
The collusive Big 8 commercial traders et al. continue to have an iron grip on their respective prices -- and their boot prints are visible every day in the Globex/COMEX futures markets. That circumstance will continue until they either relinquish control voluntarily, are told to step aside...or get overrun.
Considering the current state of affairs of the world as they stand today -- and the structural deficit in silver -- and now in platinum and palladium as well, the chance that these big bullion banks and commodity trading houses could get overrun at some point, is no longer zero -- and certainly within the realm of possibility if things go totally non-linear at some point.
But...as Ted kept reminding us from time to time...if they do finally get overrun, it will be for the very first time...which obviously wasn't allowed to happen this past month, either.
The next Bank Participation Report is due out on Friday, June 6.
![]()
CRITICAL READS & VIDEOS
Asian-Crisis-in-Reverse Feel -- Doug Noland
Sure got the old neck stuck out this time. Markets have rallied, financial conditions have loosened, and debt markets have reopened. I’m not dissuaded. The great Bubble is in trouble.
It was 15 months from the June 2007 (subprime eruption) mortgage finance Bubble piercing to the cataclysmic 2008 crisis. Over that drawn out “process,” crisis dynamics at the “periphery” ebbed and flowed as they gravitated toward the precious “core.” Aggressive rate cuts and various measures somewhat impeded the process, yet nothing could alter the reality of Trillions of suspect debt, egregious speculative leverage, and associated fatal market structure issues (i.e., derivatives and the “repo” market). There was no rectifying acute financial and economic fragilities that had accumulated over the Bubble period.
Crisis dynamics take fateful turns when perceived safe and liquid “money” succumbs to a crisis of confidence and panic. Historically, bank runs triggered acute financial and economic crises. In September 2008, it was a panicked run on “money,” more specifically Lehman Brothers and Wall Street “repo” liabilities.
Today’s crisis dynamics have key differences from 2008. In general, market-based mortgage Credit had a significantly outsized role in total system Credit going into 2008. This created latent vulnerability to the reversal of speculative flows and deleveraging, along with an associated tightening of market financial conditions. At the same time, the “core” was underpinned by rock solid perceptions of “moneyness” for Treasuries, Federal Reserve Credit, and the dollar more generally. The robust “core” afforded Washington extraordinary crisis-fighting capacity that should no longer be taken for granted.
In one respect, today’s Credit dynamics seem more robust. Massive fiscal deficits ensure system Credit growth remains dominated by the expansion of “core” Treasury securities. This, at least initially, insulates Credit expansion from the type of “risk off” market dynamics and reversal of speculative flows that doomed the mortgage finance Bubble back in the second half of 2007. Relative stability at the “core” initially stalled crisis dynamics that erupted at the “periphery.”
But there is today an important caveat. This cycle’s egregious excesses – over-issuance, speculative leverage, and Credit debasement – have flourished at the “core” – especially within Treasury and agency securities markets.
Moreover, there are serious issues associated with another key “core” Credit component – Federal Reserve liabilities. After ending 2007 at about $900 billion, total Fed assets today weigh in at $6.7 TN.
Doug's weekly commentaries are always worth reading -- and this one is no exception. It was posted just before midnight PDT on Friday night -- and another link to it is here. Gregory Mannarino's post market close rant for Friday runs for 29 minutes -- and is linked here.
![]()
Swiss pensions curb exposure to U.S. dollar assets amid debt, policy concerns
Swiss pension funds are reassessing their exposure to U.S. dollar-denominated assets in light of rising hedging costs, growing concerns over U.S. fiscal policy, and increasing national debt levels.
Speaking during a conference call hosted by consultancy Complementa this week, Andreas Rothacher, head of investment research, said there is now a “certain loss of trust” in the U.S. as an issuer of sovereign debt. He cited high hedging costs and the mounting level of U.S. public debt as key drivers of Swiss pension funds’ strategic decisions.
Swiss pension funds already began reducing or exiting foreign currency government bonds, particularly U.S. Treasuries, last year.
This retrenchment is not limited to U.S. sovereign debt. Thomas Breitenmoser, head of investment consulting at Complementa, added that Swiss pension schemes are also cutting exposure to euro-denominated government bonds in favour of corporate credit, while maintaining only modest allocations to sovereign bonds in foreign currencies.
He noted this is clearly linked to the rising U.S. debt burden, which raises the question of how much longer Swiss pension funds will want to continue investing in U.S. Treasuries.
This article showed up on the ipe.com Internet site on Friday -- and I found it on the gata.org Internet site. Another link to it is here.
![]()
INTEL Round Table w/Larry Johnson & Ray McGovern : Weekly Wrap: May 9
This interesting and very worthwhile 34-minute video interview with former CIA analysts Johnson and McGovern was hosted by Judge Andrew Napolitano as always -- and comes to us courtesy of Guido Tricot...as always. It was posted on the youtube.com Internet site late on Friday afternoon EDT -- and the link to it is here.
![]()
Gold reserves in London vaults rise in April as bullion returns from U.S.
The London Bullion Market Association said on Thursday that gold held in London vaults totalled 8,536 metric tons at the end of April, up 0.6% from the previous month, as more of the precious metal returned from New York to London after dislocation.
The premium of the most active COMEX gold futures' over London spot prices normalised in April, when the Trump administration excluded the precious metal from broader U.S. import tariffs, after being elevated for months.
Market players had increased gold deliveries to the U.S. in the December-March period to cover their COMEX positions against the possibility that the U.S. would impose tariffs on imports.
The additional stocks came from Switzerland or London, the world's largest over-the-counter gold trading hub, reducing liquidity in the London market. This development prompted London bullion market players to borrow gold from central banks, which store their bullion in the Bank of England's vaults.
"While gold stocks at the Bank of England declined at a similar pace to March, commercial vaults across London saw another monthly increase in holdings," said the LBMA, which oversees the London market.
"This trend reinforces the view that gold is continuing to move out of the Bank of England and into the broader Loco London system as well as gold leaving CME warehouses as tariff fears eased and arbitrage opportunities disappeared."
This Reuters story, filed from London, was picked up by msn.com -- and I found it on Sharps Pixley. Another link to it is here.
![]()
Poland’s gold reserves now larger than European Central Bank’s, says Polish central bank chief
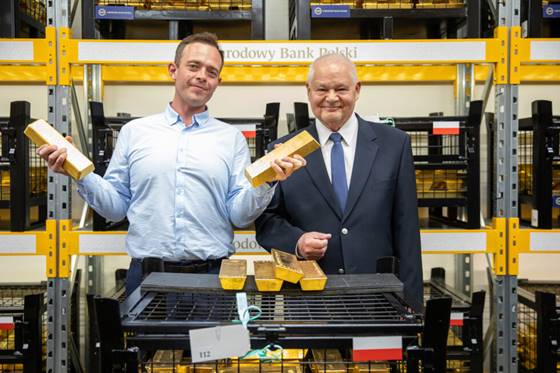
The National Bank of Poland (NBP) now holds 509.3 tonnes of gold, exceeding the reserves of the European Central Bank (ECB), says NBP governor Adam Glapiński.
“This shows the stability, abundance and solvency of the Polish economy,” Glapiński told reporters during a press conference. He sees gold as a shield against global instability and a cornerstone of economic sovereignty.
Gold now accounts for 22% of the Polish central bank’s total reserves, above the NBP’s 20% target, according to Glapiński, who notes that the NBP’s holdings are now greater than the 506.5 tonnes of gold held by the ECB, which sets monetary policy for the Eurozone and the European Union.
Poland has accelerated its gold accumulation in recent years. In 1996, the National Bank of Poland (NBP) held just 14 tonnes of gold. By 2016, that figure had risen to 102 tonnes. The pace of purchases increased significantly after 2022, with the NBP more than doubling its holdings from 228 tonnes to 480 tonnes within two years.
Glapiński, who became NBP governor in 2016, says the bank’s gold was, by the end of 2024, worth 60 billion zloty (€14.12 billion) more than what the bank paid for it, and the gain has continued to grow since.
This gold related news item showed up on the notesfrompoland.com Internet site on Friday -- and is another story that I found on Sharps Pixley. Another link to it is here.
![]()
Gold ETF Flows: April 2025: Asia erupts as global momentum builds
Highlights
- Asia flows surged and North America also saw robust demand, while Europe witnessed mild outflows.
- The strongest inflow since March 2022 and the continued gold price surge pushed global gold ETFs’ AUM to US$379bn, 10% higher in the month.
- Global gold trading volumes rose significantly across all markets.
April in review
Global physically backed gold ETFs1 added US$11bn in April, extending their inflow streak to five months (Table 1)2. Supported by a higher gold price and continued inflows, global gold ETFs’ total assets under management (AUM) reached another month-end high of US$379bn. Meanwhile, holdings surged 115t to 3,561t, the highest since August 2022 and yet still 10% below the month-end peak of 3,915t in October 2020.
Asia led inflows, accounting for 65% of the net global total – their strongest month on record. North American demand was also sizable while European flows flipped negative. Other regions continued to experience positive demand, albeit only mildly.
Only part of this article from the World Gold Council is posted in the clear. I found it on Sharps Pixley yesterday -- and another link to it is here.
![]()
Thailand sees robust retail gold investment demand in Q1
The World Gold Council’s Q1 2025 Gold Demand Trends report reveals that Thailand’s total bar and coin investment demand rose 25% year-on-year in Q1 2025 to 7.4t, marking the strongest first quarter since 2019. This brings the country’s consumer demand to 9.1t, a 17% increase, representing the highest quarterly consumer growth in Southeast Asia.
Surging Gold ETFs Fuel Q1 Global Demand
The global total quarterly gold demand (including OTC ) was 1,206t, a 1% increase year-on-year, in a record high price environment, in which gold surpassed US$3,000/oz.
The gold ETF revival fuelled a more-than doubling of total investment demand to 552t, a 170% year-on-year increase and the highest since Q1 2022. ETF inflows accelerated around the world, totalling 226t in the first quarter, as price momentum and tariff policy uncertainty drove investors to gold as a haven.
Global bar and coin demand increased 3% y/y, remaining elevated at 325t during Q1, spurred by a surge of retail investment in China, which posted its second-highest quarter on record. Eastern investors drove much of the global demand for bar and coin, offsetting Western weakness as appetite in the U.S. dropped 22% year-on-year, alongside a modest 12% recovery in Europe, but from a very low base in the same quarter last year.
Central Banks are now entering their 16th consecutive year of net-buying, adding 244t to global reserves in Q1 amidst ongoing global uncertainty. While this level of demand was 21% lower year-on-year, it remains robust and in line with the quarterly average for the last three years of sustained, strong buying.
This gold-related story was posted on the nationthailand.com Internet site on Thursday -- and yet another article I found on Sharps Pixley. Another link to it is here.
![]()
MEME of the DAY

![]()
The WRAP
Today's pop 'blast from the past' dates from 1970 -- and I certainly remember spinning this '45' on CHAR Radio at Alert, N.W.T. way back then. The song reached number 15 on the U.S. Billboard Hot 100 in 1971 -- and spent 18 weeks on the charts, making it the band's single of greatest longevity, sustaining itself three weeks longer than their greatest hit, "Midnight Confessions". The link is here. There's a bass cover to this -- and that's linked here.
Today's classical 'blast from the past' is one I've not posted before, so I shall make amends today. It's Franz Schubert's Symphony No. 8 in B minor..."The Unfinished"...a musical composition that he started in 1822, but left with only two movements—though he lived for another six years.
It was not premiered until 17 December 1865 in Vienna...37 years after Schubert passed away at the ripe old age of 31. The performance was received with great enthusiasm by the audience -- but was not published before 1867.
And of all Schubert's works...it remains the most popular to this day. Here's the Budapest Festival Orchestra performing the work in the Béla Bartók National Concert Hall in Budapest on 28 February 2014. Maestro Iván Fischer conducts -- and the link is here.
![]()
I was certainly happy to see that gold and silver were allowed to close the week on a positive note, as I certainly wasn't thinking that when the collusive commercial traders of whatever stripe set all four of the low ticks in the precious metals at 10:15 a.m. in Globex trading in Shanghai on their Friday morning.
Although gold closed up $19.10 in the spot market, it only closed higher by just under 8 bucks in June, its current front month. Silver managed to close a hair above its 50-day moving average at $32.71 in July, its current front month.
Platinum's big gain on Friday, which was stopped cold in its tracks the moment it broke above $1,000 spot, took it a lot further above its 50 and 200-day moving averages. And as pointed out in the Bank Participation Report above, the short positions held in this precious metal by the banks has dropped quite a bit since the beginning of the year, so there might be more room for it to run if 'da boyz' allow it. It's nowhere near being overbought on its RSI trace.
Palladium wasn't allowed to do much -- and like the other three precious metals, was closed well off its high tick of the day.
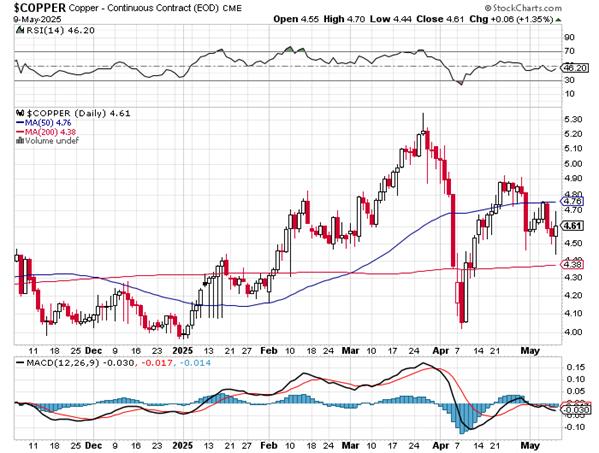
It was a wild day in copper, as it traded in a 26 cent price range -- and finished the Friday session up a nickel at $4.61/pound...but still stuck in no-man's land between its 50 and 200-day moving averages.
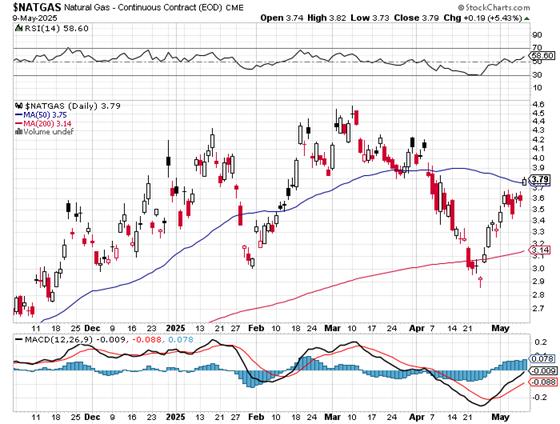
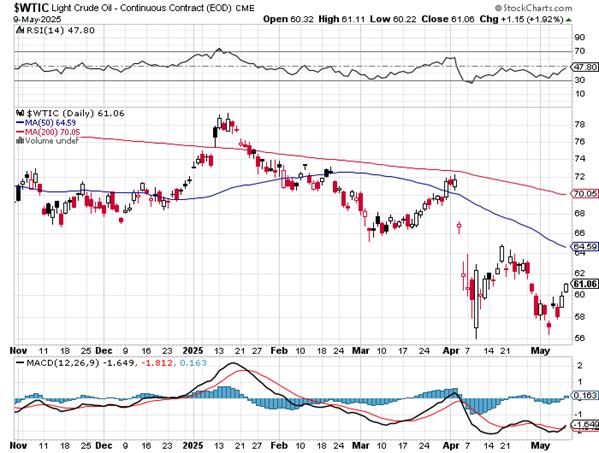
Natural gas [chart included] jumped higher by 19 cents...closing at $3.79/1,000 cubic feet -- and is now back above its 50-day moving average by a bit. WTIC picked up its second decent gain in as many days, as it closed up another $1.15 at $61.06/barrel.
Here are the 6-month charts for the Big 6+1 commodities...courtesy of stockcharts.com as always and, if interested, their COMEX closing prices in their current front months on Friday should be noted. Click to enlarge.
So far in May, only seven business days old, there have only been a total of 48,604 troy ounces of gold shipped into the COMEX...but a hefty 1,930,768 troy ounces have been shipped out... with most of that ending up back in London or Switzerland...as per the article in the Critical Reads section above.
But in silver, it's a different story entirely, as 12.224 million troy ounces have been received at the COMEX -- and 8.821 million troy ounces have been shipped out.
It's been a one-way street for gold so far this month...anything but in silver. This 'churn'/high turnover in silver is certainly indicative of a metal that's in high demand.
To put things in perspective year-to-date...here's Nick's chart showing the rising silver inventories in almost all of the COMEX-approved depositories -- and it's no surprise that JPMorgan is tallest hog at the silver trough by at least an order of magnitude. Click to enlarge.
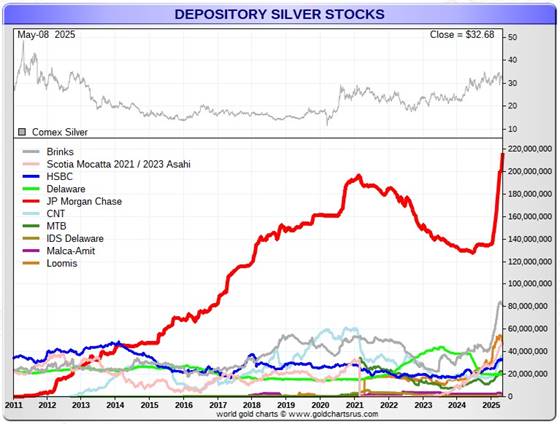
JPMorgan didn't have a silver depository until they opened it about a week before that infamous drive-by shooting began on May 1, 2011...which is just visible on its trace on the above chart. The only other three silver depositories worthy of the name are Brink's, Inc., Loomis International and Asahi. The rest don't count for much.
As far as GLD and SLV are concerned, so far this month about 240,000 ounces of gold have been withdrawn from the former -- and 4.188 million troy ounces of silver have been taken out of the latter.
So where we go from here is unknown. Sooner or later this silver structural deficit in silver will catch up to the market...as will the structural deficits in both platinum and palladium. I suspect that we're getting close to the same situation in gold, especially since various fund managers are now sticking their toes in this market.
Although retail bullion sales have been been very slow for a long while now, it will be the money thrown at it by the big boys...on top of the record amount of gold that the world's central banks are buying...that will send the metals and their associated equities soaring. The HUI is already up big this year so far... 45.19% -- and if 'da boyz' didn't have their foot on the silver price, it and its shares would be up even more than that. But despite this, the Amplify Junior Silver Miners ETF is up 28.20% year-to-date.
Of course -- and as everyone knows, even with those gains, the precious metal shares are vastly underperforming their respective underlying precious metals. But it won't stay that way forever -- and when this market decisively breaks to the upside, the stampede into these two hard assets that are no one else's liability, will be on in earnest.
As always, I'm still "all in" -- and will remain so to whatever end.
See you here on Tuesday.
Ed
About the author

SUBSCRIBE: https://edsteergoldsilver.com/

Ed Steer’s Daily Analysis of the Gold and Silver Markets
After eight years of writing about the precious metals for Casey Research, the folks at Stansberry & Associates—who just recently purchased controlling interest in the company—decided that my ‘niche market’ column didn’t fit into their plans.
Since the time that Casey Research was kind enough to offer me a stand-alone column, it became their most highly-rated blog almost from the outset—and has remained that way up to this date...