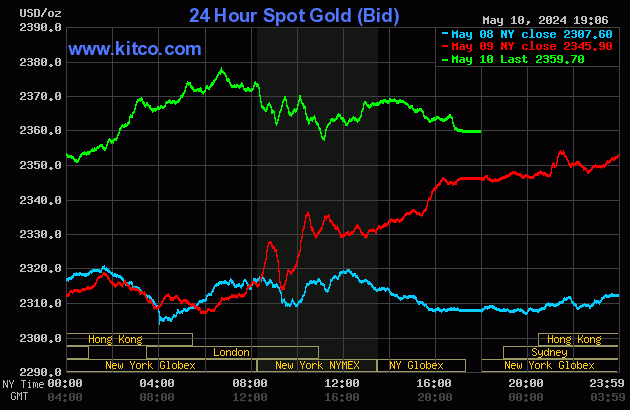
The gold price began to wander quietly higher in early Globex trading in the Far East on their Friday -- and that pace quickened staring around 12:20 p.m. China Standard Time on their Friday afternoon. That very decent rally ran into 'something' around 11:45 a.m. in London -- and it was sold lower from there until its low tick was set a couple of minutes after the 11 a.m. EDT London close. It ensuing choppy rally was rolled over at 2 p.m. in after-hours trading -- and that engineered sell-off ended right at 5:00 p.m. close of trading.
The high and low ticks in gold were recorded by the CME Group as $2,385.30 and $2,352.00 in the June contract. The June/August price spread differential in gold at the close in New York yesterday was $22.70...August/October was also $22.70 -- and October/December was $23.00 an ounce.
Gold was closed on Friday afternoon in New York at $2,359.70 spot, up $13.80 on the day -- and 20 or so bucks off its Kitco-recorded high tick. Net volume was certainly on the heavier side at 193,000 contracts -- and there were a bit under 82,500 contracts worth of roll-over/switch volume out of June and into future months...mostly August, but with notable amounts into October and December as well.
I saw that 126 gold, plus 75 silver contracts were traded in May on Friday -- and it remains to be seen what amounts show up in this evening's Daily Delivery and Preliminary Reports.
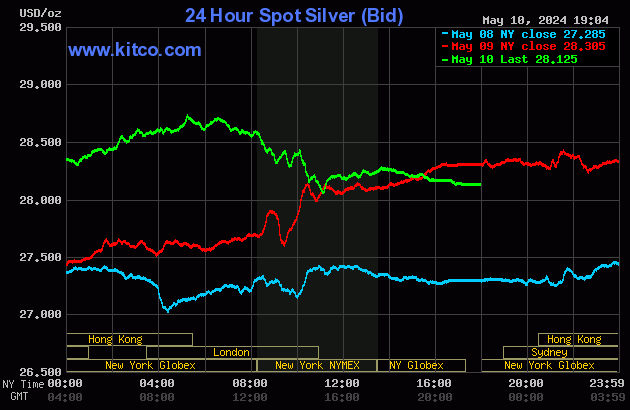
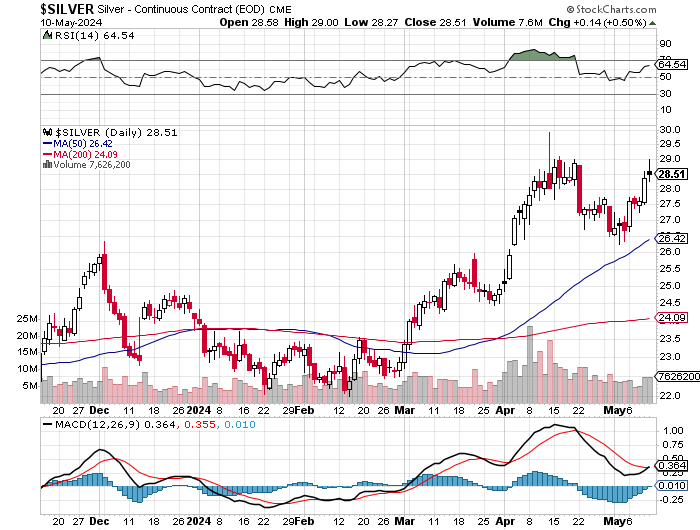
Silver's quiet rally didn't really get started until around 10:45 a.m. in Globex trading in Shanghai on their Friday morning -- and that ran into 'something' around 10:10 a.m. in London. 'Da boyz' set its low tick at the same time as gold's...a couple of minutes after the 11 a.m. EDT London close -- and also like gold, had a quiet up/down move...except centered around 1:40 p.m....which lasted until minutes before trading ended at 5:00 p.m. EDT.
The high and low ticks in silver were reported as $29.00 and $28.27 in the July contract. The May/July price spread differential in silver at the close in New York yesterday was 23.1 cents...July/September was 29.3 cents -- and September/December was 40.3 cents an ounce.
Silver was closed on Friday afternoon at $28.13 spot...down 18 cents from Thursday -- and about 60 or so cents off its Kitco-recorded high tick. Net volume was a bit on the heavier side at a bit over 73,000 contracts -- and there were around 5,200 contracts worth of roll-over/switch volume in this precious metal...almost all into September and December.
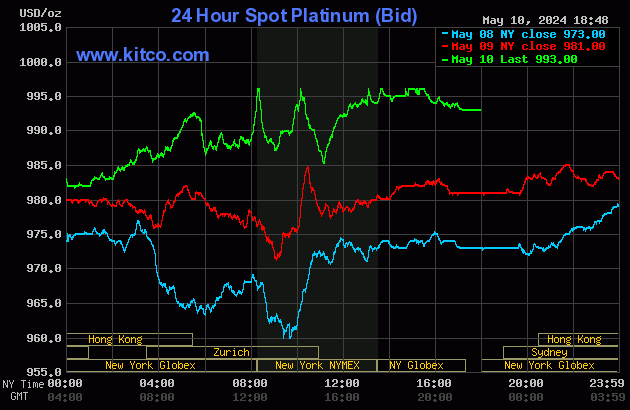
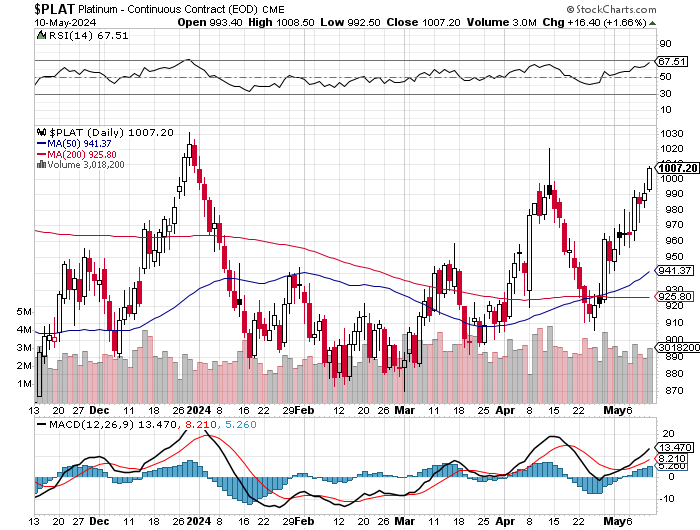
Platinum wandered sideways to a hair higher until a rally of some note commenced minutes after 1 p.m. China Standard Time on their Friday afternoon. That ran into three separate 'obstacles' along the way until the COMEX close in New York -- and was then sold a couple of dollars lower in after-hours trading. Platinum was closed at $993 spot up 12 dollars from Thursday.
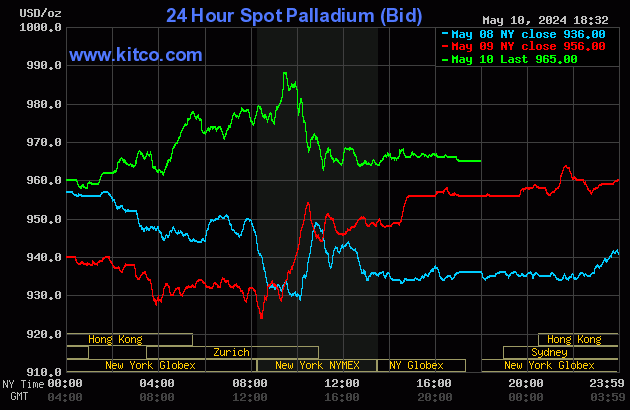
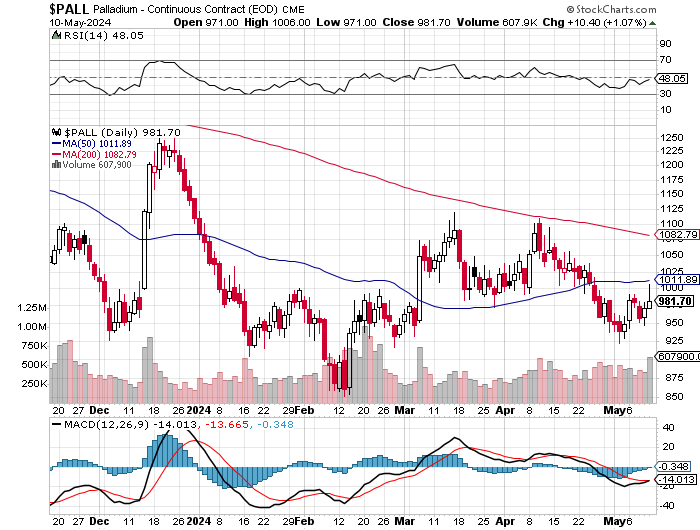
Palladium's price path was mostly similar to platinum's...except its very early afternoon rally in Globex trading was somewhat more impressive-- and also didn't run into as many obstacles. That ended about 9:20 a.m. in COMEX trading in New York -- and a short seller of last resort appeared, selling it lower until a few minutes after the 11 a.m. EDT Zurich close. It didn't do much after that. Palladium was closed at $965 spot...up 9 bucks on the day.
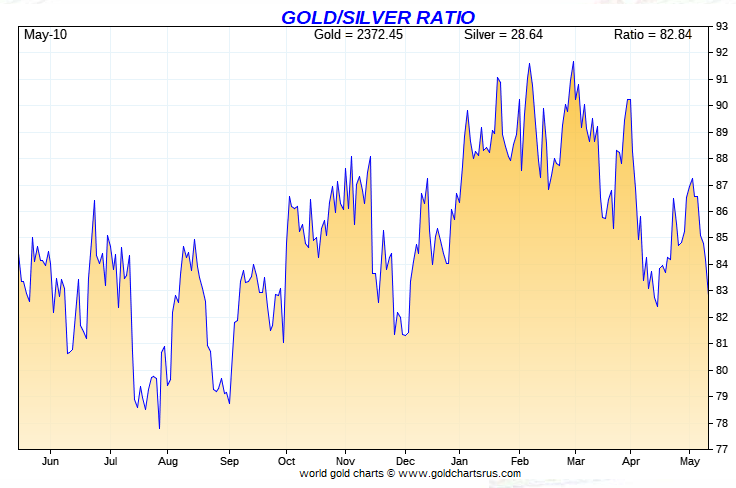
Based on the kitco.com spot closing prices in silver and gold posted above, the gold/silver ratio worked out to 83.9 to 1 on Friday...compared to 82.9 to 1 on Thursday.
Here's the 1-year Gold/Silver Ratio Chart...courtesy of Nick Laird. Click to enlarge.
![]()
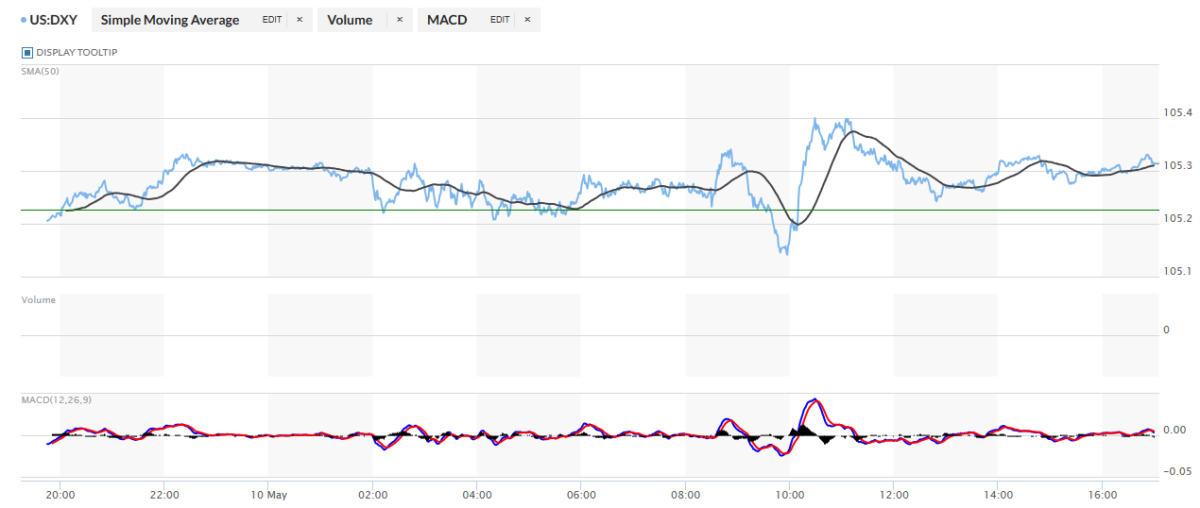
The dollar index closed very late on Thursday afternoon in New York at 105.23 -- and then opened lower by 2 basis points once trading commenced at 7:45 p.m. EDT on Thursday evening, which was 7:45 a.m. China Standard Time on their Friday morning. It edged a bit unevenly higher from there until 10:25 a.m. CST -- and then chopped quietly lower until 8:30 a.m. in New York. From that juncture it had a fairly erratic up/down/up/down move between then and 12:50 p.m. -- and from that point it chopped very quietly higher until trading ended at 5:00 p.m. EDT.
The dollar index finished the Friday trading session in New York at 105.30...up 7 basis points from its close on Thursday.
Here's the DXY chart for Friday...thanks to marketwatch.com as usual. Click to enlarge.
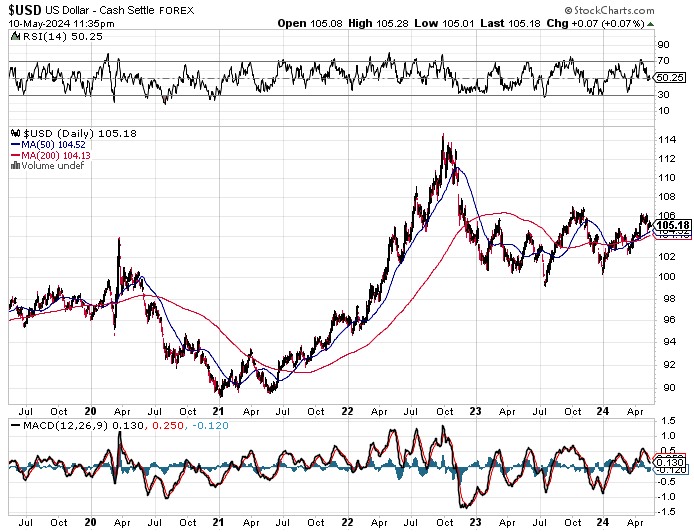
And here's the 5-year U.S. dollar index chart that appears in this spot every Saturday, courtesy of stockcharts.com as always. The delta between its close...105.18...and the close on the DXY chart above, was 12 basis points below its spot close. Click to enlarge.
Here's the 5-year 10-year U.S. Treasury chart from the yahoo.com Internet site -- which puts the yield curve into a somewhat longer-term perspective. Click to enlarge.
As it's been recently, there was less than zero correlation between the currencies and precious metal prices on Friday -- and that was particularly the case in the COMEX futures market in New York. It was all paper trading once again.
U.S. 10-year Treasury: 4.5040%...up 0.0550/(+1.24%)...as of the 1:59 p.m. CDT close.
Here's the 5-year 10-year U.S. Treasury chart from the yahoo.com Internet site -- which puts the yield curve into a somewhat longer-term perspective. Click to enlarge.
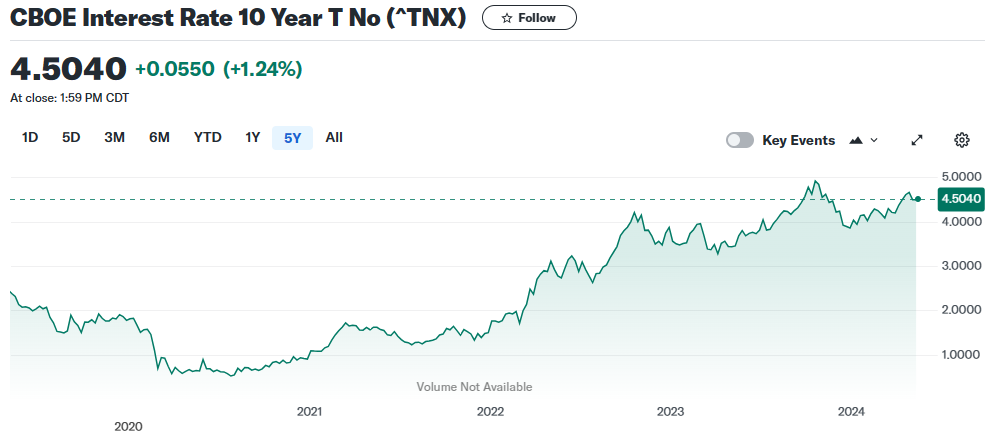
It will be interesting to see if the Fed allows the 10-year above 5% again -- and with the chance rate cuts coming both abroad and in the U.S. during the summer, it's entirely possible that the Fed will have resort to full-blown yield curve control at some point once inflation begins to run out control again, as it most surely will.
![]()
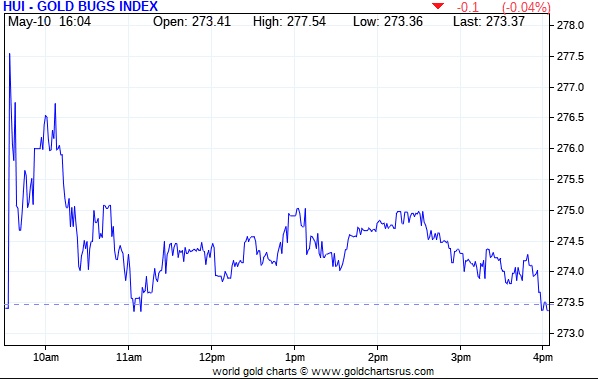
The gold stocks spiked higher in the first couple of minutes of trading once it commenced at 9:30 a.m. in New York on Friday morning. They were sold unevenly lower from that point until minutes after 11 a.m. EDT. From there they had a quiet and choppy up move until 2:30 p.m. -- and when the gold price was rolled over at that point the shares followed. The HUI closed down 0.04 percent.
Here's Nick's new 1-year Silver Sentiment Index chart, updated with Friday's candle -- and with silver getting closed down on the day, the index gave up some of Thursday big gain, closing lower by 1.62 percent. Click to enlarge.
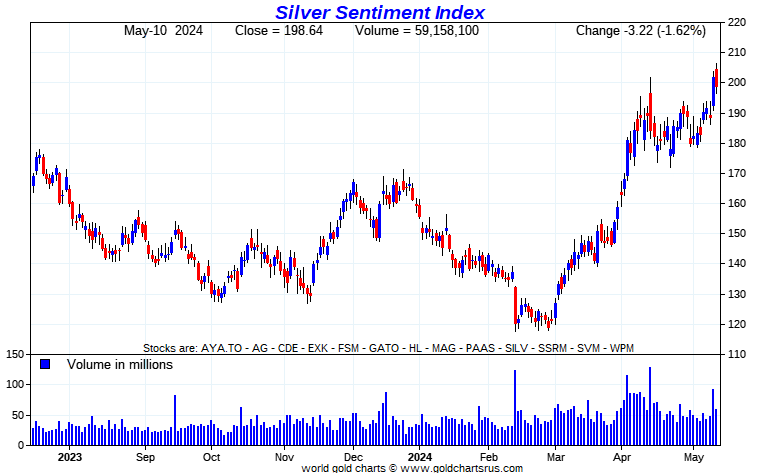
The star yesterday was Silvercorp Metals, closing higher by 2.51 percent -- and two other silver stocks closed up small fractions of one percent as well... Aya Gold & Silver -- and Fortuna Silver. The biggest underperformer was Coeur Mining, as it closed down 3.64 percent.
I didn't see any company-specific news in any of the Silver Sentiment Index shares on Friday.
The reddit.com/Wallstreetsilver website, now under 'new' but not improved management, is linked here. The link to two other silver forums are here -- and here.
![]()
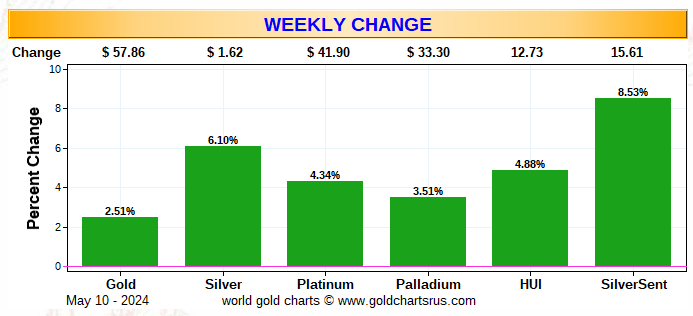
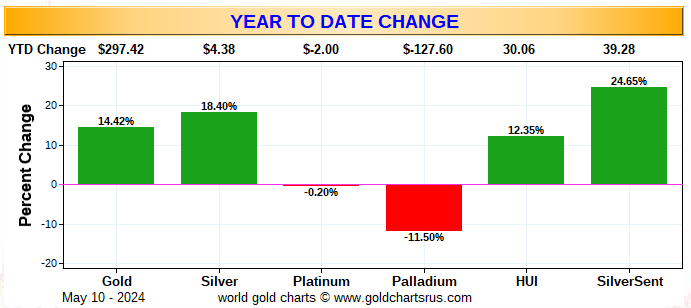
Here are the usual three charts that appear in every weekend missive. They show the changes in gold, silver, platinum and palladium in both percent and dollar and cents terms, as of their Friday closes in New York — along with the changes in the HUI and the new Silver Sentiment Index.
Here's the weekly chart -- and it's back to wall-to-wall green. Although the silver equities are outperforming the gold stocks on an absolute basis, on a relative basis, the gold shares are doing better. Click to enlarge.
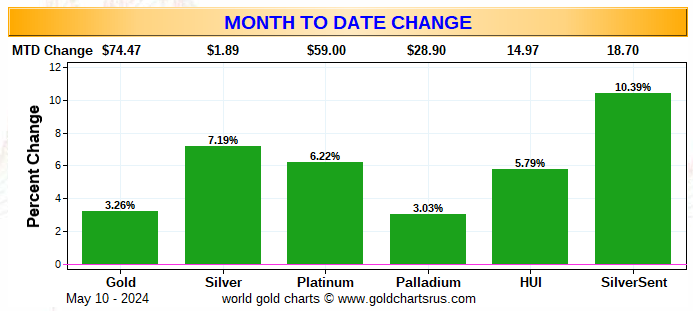
Here's the month-to-date chart -- and the same can be said about it regarding gold and silver vs. their underlying equities that I just stated about the weekly chart. Click to enlarge.
Here's the year-to-date chart -- with both gold and silver still solidly in positive territory...unless 'da boyz' have more pain in store. With 13 stocks in the Silver Sentiment Index going forward, instead of the old 7...the big loss by SSR Mining earlier this year is now down to a tiny percentage. The underperformance of the precious metal shares is the most evident here... especially the gold stocks. At some point investor interest will return with a vengeance, but exactly when...like I keep saying...is the $64,000 question. Click to enlarge.
Of course -- and as I mention in this spot every Saturday -- and will continue to do so...is that if the silver price was sitting close to its all-time high, like gold is currently...it's a given that the silver equities would be outperforming their golden cousins by many more orders of magnitude.
![]()
The CME Daily Delivery Report for Day 9 of May deliveries showed that 116 gold -- and 66 silver contracts were posted for delivery within the COMEX-approved depositories on Tuesday.
In gold, the only one of the two short/issuers that mattered was Wells Fargo Securities, issuing 112 contracts out of its house account. There were four long/stoppers in total -- and the two largest were BofA Securities and Advantage, picking up 93 and 12 contracts...BofA for their house account.
In silver, the two short/issuers were Advantage and BofA Securities, issuing 61 and 5 contracts out of their respective client accounts -- and the only two long/stoppers of the five in total that mattered were BofA Securities and ADM, picking up 54 and 8 contracts...BofA for their own account.
In platinum, there were 6 contracts issued and stopped -- and all issued by British bank Standard Chartered out of its house account.
The link to Friday's Issuers and Stoppers Report is here.
Month-to-date shows that 1,922 gold, plus 5,610 silver contracts have been issued/reissued and stopped since the May delivery month began. In platinum that number is 116 contracts -- and in palladium it's 6.
The CME Preliminary Report for the Friday trading session showed that gold open interest in May increased by 114 contracts, leaving 142 still around, minus the 116 contracts mentioned a bunch of paragraphs ago. Thursday's Daily Delivery Report showed that 1 lonely gold contract was posted for delivery on Monday, so that means that 114+1=115 more gold contracts just got added to May deliveries.
Silver o.i. in May dropped by 219 COMEX contracts, leaving 151 still open, minus the 66 contracts mentioned a bunch of paragraphs ago. Thursday's Daily Delivery Report showed that 284 silver contracts were actually posted for delivery on Monday, so that means that 284-219=65 more silver contracts just got added to the May delivery month.
Total gold open interest on Friday decreased by a net 9,087 COMEX contracts -- but total silver o.i. rose, it by a net 960 contracts. Both numbers are subject to some minor revisions by the time the CME gets around to posting the final figures on their Internet site later on Monday morning CDT.
![]()
After two days of no activity, there was finally a deposit into GLD, as an authorized participant deposited 46,910 troy ounces of gold. But there was yet another withdrawal from SLV, the second in as many days, as an a.p. removed a further 1,005,295 troy ounces of silver.
In other gold and silver ETFs and mutual funds on Planet Earth on Friday, net of any changes in COMEX, GLD and SLV inventories, there were a net 41,608 troy ounces of gold taken out, but a net 365,091 troy ounces of silver were added, involving six different depositories.
And still no sales report from the U.S. Mint -- and nothing month-to-date, either.
![]()
After little in/out activity in gold over at the COMEX-approved depositories on the U.S. east coast on either Tuesday or Wednesday, there was none at all on Thursday -- and no paper activity, either.
It was another very busy day in silver, as 1,145,629 troy ounces/two truckloads were reported received -- and 1,061,867 troy ounces were shipped out.
In the 'in' category, the biggest truckload...598,727 troy ounces...arrived a Loomis International -- and the other truckload...546,901 troy ounces...was dropped off at Manfra, Tordella & Brookes, Inc.
All of the 'out' activity happened over at Brink's, Inc.
There was a tiny bit of paper activity as 4,961 troy ounces/one COMEX contract was transferred from the Registered category and back into Eligible over at JPMorgan -- and 3,919 troy ounces/three good delivery bars made that trip in the opposite direction over at Manfra, Tordella & Brookes, Inc.
The link to silver's considerable COMEX action on Thursday, is here.
And there was no in/out activity over at the COMEX-approved gold kilobar depositories in Hong Kong on their Thursday.
![]()
Here are the usual 20-year charts that show up in this space in every weekend column. They show the total amounts of physical gold and silver held in all know depositories, ETFs and mutual funds as of the close of business on Friday.
During the week just past, there were a net 178,000 troy ounces of gold added for a change -- and a net 540,000 troy ounces of silver were taken out. Click to enlarge.
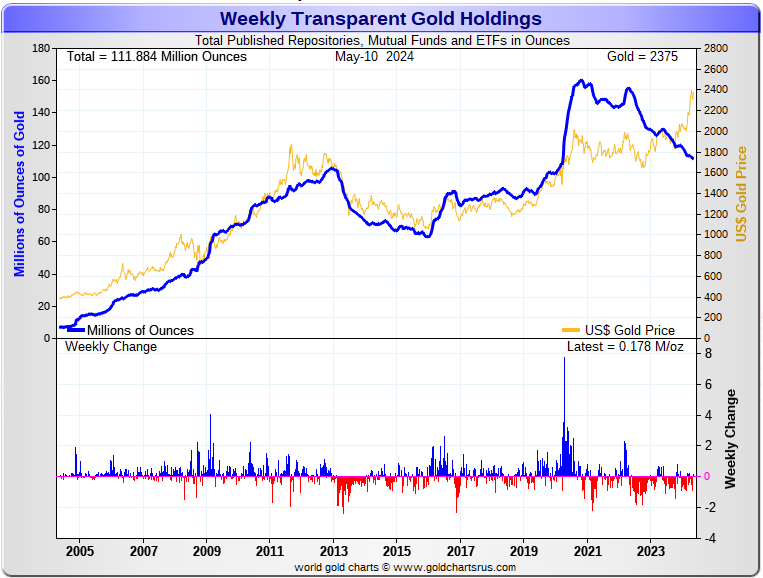
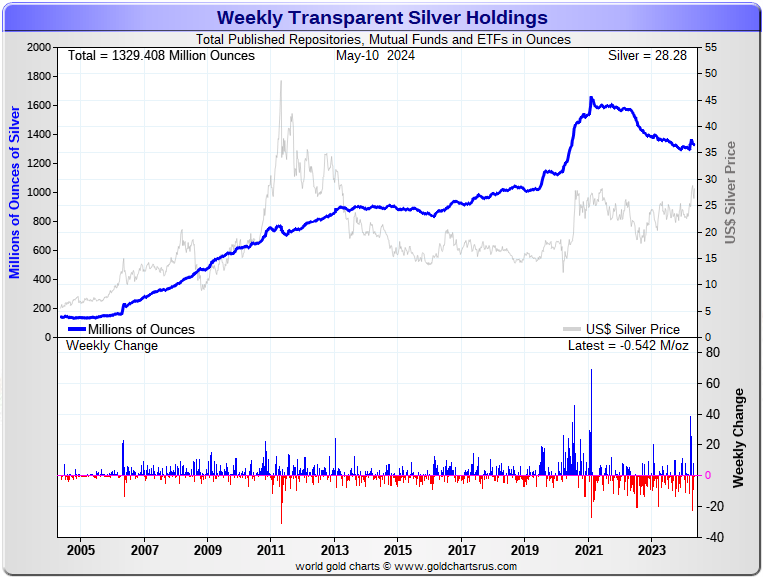
According to Nick Laird's data on his website, there were a net 714,000 troy ounces of gold removed -- and a net 15.877 million troy ounces of silver were taken out as well from all the world's known depositories, mutual funds and ETFs during the last four weeks.
The fact that there have been net withdrawals of these amounts in both gold and silver over the last four weeks during this current big run-up in their prices, shows just how much physical demand for gold there is in London by China. I suspect that all the silver disappearing from Western ETFs and mutual funds for the last while is now in India, plus other Far East and Middle East countries.
Retail bullion sales have picked up a bit, but are nothing special. Premiums vary. They're very high at Kitco...but much lower in other places. That will most likely change if gold and silver continue to power higher from here -- and physical shortages return. But we're a very long way from that at this point.
Then there's the huge quantities of silver that will be required by all the silver ETFs and mutual funds once institutional buying finally kicks in....which it has yet to do...as there have been nothing but net withdrawals as far as the eye can see. Adding to that demand will be the silver required to cover some or all of the short position in SLV...mentioned in more detail a bit further down.
And as Ted stated very recently, it would appear that JPMorgan has parted with well over 500 million troy ounces of the at least one billion troy ounces that they'd accumulated since 2011.
If they continue in this vein, they are going to have to cough up more ounces to feed this year's deficit...another 215 million of them according to that latest report from The Silver Institute...plus the almost 120+ million ounces that India has purchased so far this year that we know of.
The physical demand in silver at the wholesale level continues unabated -- and that was on display again this week. The amount of silver being physically moved, withdrawn or changing ownership seems to be hitting new heights with each passing week.
New silver has to be brought in from other sources [JPMorgan] to meet the ongoing demand for physical metal. This will continue until available supplies are depleted...which will be the moment that JPMorgan & Friends stop selling into the deepening structural deficit.
The vast majority of precious metals being held in these depositories are by those who won't be selling until the silver price is many multiples of what it is today.
Sprott's PSLV is the third largest depository of silver on Planet Earth with 170 million troy ounces -- and some distance behind the COMEX, where there are 298 million troy ounces being held...minus the silver mentioned in the next paragraph.
It's now been proven beyond a shadow of a doubt that 103 million troy ounces of that amount in the COMEX is actually held in trust for SLV by JPMorgan according to a letter Ted received from the CFTC some months ago now. That brings JPMorgan's actual silver warehouse stocks down to around the 27 million troy ounce mark...quite a bit different than the 129.6 million they indicate they have.
But PSLV is still some distance behind SLV, as they are the largest silver depository, with 421 million troy ounces as of Friday's close.
The latest short report from Thursday, May 9 showed that the short position in SLV decreased by a chunky 35.94 percent...from 28.92 million shares sold short...down to 18.52 million shares sold short. BlackRock issued a warning a few years ago to all those short SLV, that there might come a time when there wouldn't be enough metal for them to cover. That would only be true if JPMorgan decides not to supply it to whatever entity requires it...which is most certainly a U.S. bullion bank, BofA perhaps?
The next short report will be posted on The Wall Street Journal's website on Friday, May 24.
Then there's that other little matter of the 1-billion ounce short position in silver held by Bank of America in the OTC market...with JPMorgan & Friends on the long side. Ted says it hasn't gone away -- and he's also come to the conclusion that they're also short around 25 million ounces of gold with these same parties as well. The latest report for the end of Q4/2023 from the OCC came out a bit over a month ago now -- and Ted says that very little, if anything, has changed.
![]()
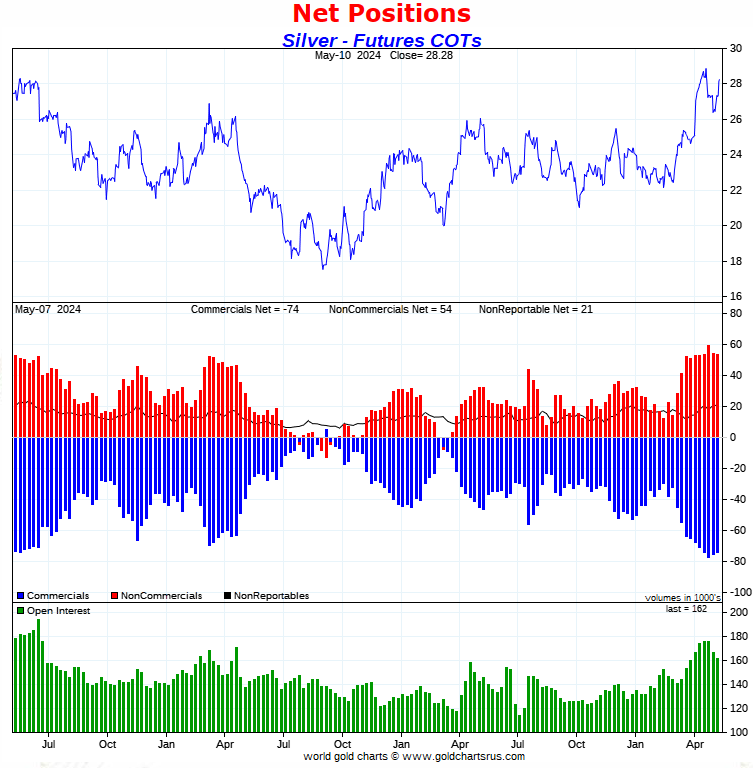
The Commitment of Traders Report, for positions held at the close of COMEX trading on Tuesday, showed a small and unexpected decline in the Commercial net short position in silver, but that was only because Ted's raptors were buying longs to cover some of their short positions. The Big 4 shorts added to their short position once more, which I'll get into in a bit.
There was also a small decline in the commercial net short position in gold, but the Big 4 added to their short position as well, with the other commercials being buyers.
In silver, the Commercial net short position declined by a smallish 781 COMEX contracts, or 3.905 million troy ounces.
They arrived at that number by reducing their long position by 1,520 contracts, and also reduced their short position by 2,301 COMEX contracts. It's the difference between those two numbers that represents their change for the reporting week.
With such a small change in the headline number, there weren't big changes under the hood in the Disaggregated COT Report. The Managed Money traders increased their net long position by 308 COMEX contracts...which they accomplished by selling 950 long contracts, but also covered 1,258 short contracts.
The Nonreportable/small traders also increased their net long position, them by a scant 61 contracts...which meant that the Other Reportables were net sellers. They were...reducing their net long position by 1,150 COMEX contracts.
Doing the math: 1,150 minus 308 minus 61 equals 781 COMEX contracts, the change in the Commercial net short position.
And as mentioned further up, the Big 4 shorts...all mostly bullion banks...increased their net short position by a further 639 contracts, up to 49,369 contracts during the reporting week...from the 48,730 contracts they were short in last Friday's COT Report. This was not all welcomed, but expected. This is the fifth week in a row that the Big 4 have increased their short position. Back on April 7, they were short 'only' 43,707 COMEX contracts.
The Big '5 through 8' shorts decreased their net short position for the second week in a row...but only by an insignificant 137 contracts...from the 23,284 contracts in last week's report, down to 23,147 contracts in this week's COT Report. This is still a very bearish number for them.
So that means that the Big 8 commercial shorts in total increased their overall net short position from 72,014 contracts, up to 72,516 COMEX contracts week-over-week...an increase of 639-137=502 COMEX contracts.
I'm assuming that the one managed money trader is still there in the Big 8 commercial category -- and remain short around 8,000 COMEX contract -- and that they obviously didn't do much, if anything.
To make up the difference between the change in the Commercial net short position and what the Big 8 shorts did, Ted's raptors, the small commercial traders other than the Big 8, bought back around 1,300 short contracts -- but remain net short silver a bit under 10,000 COMEX contracts.
I'm still taken aback by the fact that this group of traders is this short.
So it was mostly because of Ted's raptors buying long positions that caused the decrease in the Commercial net short position this week...the same as what occurred last week.
Here's Nick's 3-year COT chart for silver, updated with the above data. Click to enlarge.
The only good thing I can say about this COT Report in silver is that it was not as bad as I feared it might be. Yes, the Big 4 did add to their short position once more, but I was expecting a far bigger number than 639 contracts they did go short.
And as I pointed out in this space last week..."there's never been such an outright bearish COMEX futures market set-up like this in silver, this far along in a 'wash, rinse & spin' cycle. In that regard, the jury is still very much out on whether the collusive commercial traders of whatever stripe will be able to flush out the silver market/managed money traders to the downside like they've always done in the past." Nothing has changed in that regard.
If such a process does occur, the Big 8 commercial shorts will be in direct and fierce competition from Ted's raptors for the long positions being puked up by the managed money traders et al. His raptors hold a record short position -- and will certainly be aggressive buyers during any engineered price decline.
But the drumbeat of that structural deficit in silver hasn't gone away -- and won't, regardless of the price shenanigans going forward.
![]()
In gold, the commercial net short position fell by an inconsequential 232 contracts...23,200 troy ounces of the stuff.
They arrived at that number by reducing their long position by 2,026 COMEX contracts -- and also reduced their short position by 2,258 contracts. It's the difference between those two numbers that represents their change for the reporting week.
Under the hood in the Disaggregated COT Report, the category changes were quite a bit larger, as the Managed Money traders reduced their net long position by 8,928 COMEX contracts...which they accomplished by reducing their gross long position by 7,073 contracts -- and also sold 1,855 short contracts.
The other two categories had to be buyers -- and they were. The Other Reportables increased their net long position by 4,285 contracts, mostly through the buyback of short contracts -- and the Nonreportable/small traders increased their net long position by 4,411 contracts...almost all through the addition of long contracts.
Doing the math: 8,928 minus 4,285 minus 4,411 equals 232 COMEX contracts, the change in the commercial net short position.
The commercial net short position in gold now sits at 227,266 COMEX contracts/22.727 million troy ounces of the stuff...down those 232 contracts... from the 227,498 COMEX contracts/22.745 million troy ounces they were short in the May 3 COT Report.
Like in silver, the Big 4 shorts increased their net short position by 4,612 COMEX contracts...from 156,457 contracts, up to 161,069 contracts...which is a very bearish number -- and the most bearish since December 8 of last year.
The Big '5 through 8' shorts decreased their net short by a smallish amount for fifth week in a row...from the 73,290 contracts they held short in the May 3 COT Report, down to 71,528 contracts held short in the current COT Report...a very long way from a bullish number -- and a drop of 1,762 COMEX contracts week-over-week.
The Big 8 short position increased from 229,747 contracts/22.975 million troy ounces, up to 232,597 contracts/23.260 million troy ounces...an increase of 2,850 COMEX contracts -- about the same as the increase last week.
Ted's raptors, the small commercial traders other than the Big 8 shorts, were the big buyers, increasing their net long position from 2,249 COMEX contracts -- up to 5,331 COMEX contracts...an increase of 3,082 contracts.
Don't forget that despite their small size, the raptors are still commercial traders in the commercial category. It was their purchase of long contracts that had the mathematical effect of decreasing the commercial net short position, which really isn't a decrease at all.. Remember, it's only what the Big 4/8 shorts do that matters.
It's obvious from this report that almost the sole reason that the Big 4 had to increase their short position was because of long buying by the Big '5 through 8' shorts, plus Ted's raptors.
Here's Nick Laird's 3-year COT Report chart for gold, updated with the above data. Click to enlarge.
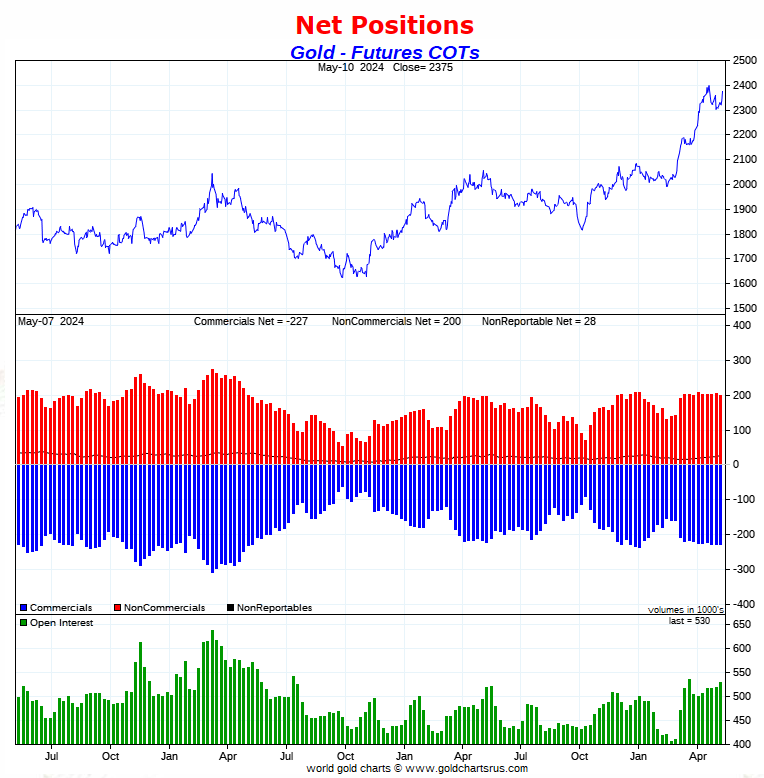
From a COMEX futures market perspective, gold remains in a very bearish configuration -- and the like the COT Report in silver, got a bit more bearish this reporting week. The short holders in gold and silver remain underwater to the tune of around $15 billion according to Ted.
And as bad as gold is in the COMEX futures market, it's also very ugly in Friday's companion Bank Participation Report numbers further down.
But with the huge physical demand in both silver and gold recently, the fight between that and the paper hangers in the COMEX futures market, is reaching a crescendo -- and the paper shorts still have their backs against the wall.
![]()
In the other metals, the Managed Money traders in palladium, decreased their net short position by an insignificant 41 COMEX contracts -- and remain net short palladium by an eye-watering 11,813 contracts...45.9 percent of total open interest. All of the other four categories in the Disaggregated COT Report are now net long palladium...the Swap Dealers in the commercial category in particular.
In platinum, the Managed Money traders decreased their net short position by a fairly hefty 8,720 contracts during the reporting week -- and are now back to being net long platinum by 4,186 contracts. The traders in the Producer/Merchant category are meganet short 24,628 COMEX contracts -- and the Swap Dealers in the commercial category are net long platinum by 6,280 contracts. The traders in both the Other Reportables and Nonreportable/ small traders categories remain net long platinum by very decent amounts ...especially the Other Reportables.
It's the world's banks -- and mostly U.S. banks in the Producer/Merchant category that are 'The Big Shorts' in platinum, as per yesterday's Bank Participation Report, which I'll get into a bit further down.
In copper, the Managed Money traders increased their net long position by 2,843 COMEX contracts -- and are now net long copper by 61,851 COMEX contracts...about 1.546 Billion pounds of the stuff as of yesterday's COT Report...up from the 1.475 Billion pounds they were net long copper in last week's report.
Copper, like platinum, continues to be a wildly bifurcated market in the commercial category. The Producer/Merchant category is net short 89,076 copper contracts/2.227 Billion pounds -- while the Swap Dealers are net long 19,064 COMEX contracts.
Whether this means anything or not, will only be known in the fullness of time. Ted says it doesn't mean anything as far as he's concerned, as they're all commercial traders in the commercial category. However, this bifurcation has been in place for as many years as I can remember -- and that's a lot.
In this vital industrial commodity, the world's banks...both U.S. and foreign ...are net long 8.7 percent of the total open interest in copper in the COMEX futures market as shown in the May Bank Participation Report that came out yesterday...down from the 10.7 percent they were net long in April's. At the moment it's the commodity trading houses such as Glencore and Trafigura et al., along with some hedge funds, that are net short copper in the Producer/ Merchant category, as the Swap Dealers are mega net long, as pointed out above.
The next Bank Participation Report is due out on Friday, June 7.
![]()
Here’s Nick Laird’s “Days to Cover” chart, updated with the COT data for positions held at the close of COMEX trading on Tuesday, May 7. It shows the days of world production that it would take to cover the short positions of the Big 4 — and Big '5 through 8' traders in every physically traded commodity on the COMEX. Click to enlarge.
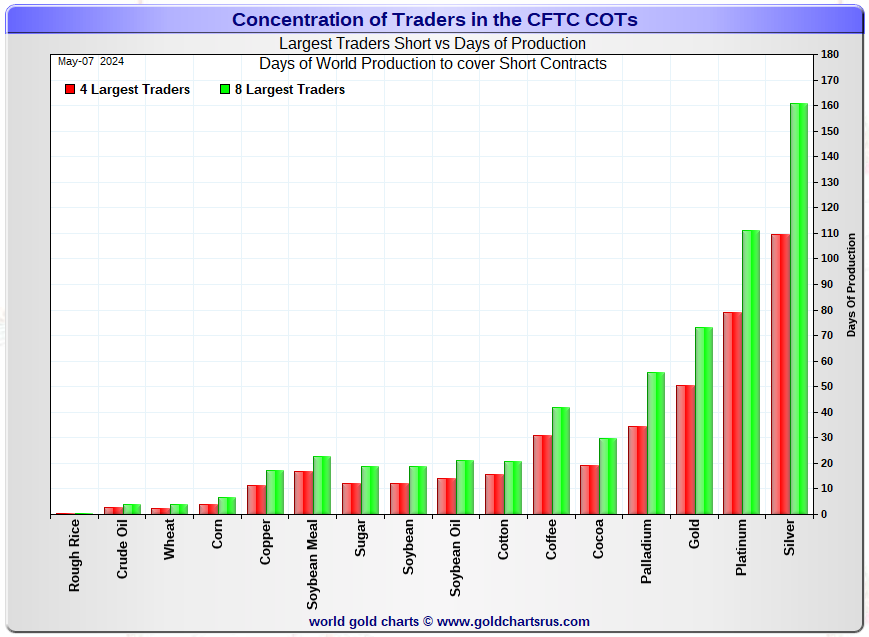
In this week's data, the Big 4 traders are short about 110 days of world silver production...up about 2 days from last week's report. The ‘5 through 8’ large traders are short an additional 51 days of world silver production...down 1 day from last week, for a total of about 161 days that the Big 8 are short -- and up 1 day from last week's report.
Those 161 days that the Big 8 traders are short, represents about 5.4 months of world silver production, or 362.58 million troy ounces/72,516 COMEX contracts of paper silver held short by these eight mostly commercial traders.
Several of the largest of these are now non-banking entities, as per Ted's discovery a year or so ago. May's Bank Participation Report that came out yesterday continues to confirm that this is still the case -- and not just in silver, either.
The small commercial traders other than the Big 8 commercial shorts...are short 10,000 COMEX contracts, or maybe a bit less...down about 1,300 contracts from last week's COT Report.
But that short position has to be bought back at some point...as does the 8,000 contracts short position held by that lone managed money trader that currently [and temporarily] inhabits the Big 8 short category. Whether they cover for a profit on this current 'wash, rinse & spin' cycle, or are forced to cover in a panic, booking big losses on rising prices, is still an unknown.
In gold, the Big 4 are short about 51 days of world gold production...up 2 days from last week's COT Report. The '5 through 8' are short an additional 22 days of world production, down 1 day from last week...for a total of 73 days of world gold production held short by the Big 8 -- and obviously up 1 day from last Friday's COT Report.
The Big 8 commercial traders are short 44.8 percent of the entire open interest in silver in the COMEX futures market as of yesterday's COT Report, up from the 43.3 percent that they were short in the May 3 COT Report -- and something over the 50 percent mark once their market-neutral spread trades are subtracted out. That rather large percentage drop was because of fairly big decrease in silver's total open interest during the week, which affects the calculation -- and was mostly delivery related.
In gold, it's 43.9 percent of the total COMEX open interest that the Big 8 are short, up a bit from the 44.2 percent they were short in the May 3 COT Report -- and a bit over the 50 percent mark once their market-neutral spread trades are subtracted out.
Ted is still of the opinion that Bank of America is short about one billion ounces of silver in the OTC market, courtesy of JPMorgan & Friends. He's also of the opinion that they're short 25 million ounces of gold as well. And with the latest report from the OCC in hand from a month ago, he's still of that opinion.
As reported further up, the short position in SLV now sits at 18.52 million shares as of Thursday's short report...down a hefty 35.94% from the 28.92 million shares sold short in the prior report. The next short report is due out on Friday, May 24.
The situation regarding the Big 4/8 commercial short position in gold and silver remains obscene -- and became even more in yesterday's COT Report...as the Big 4 increased their short position in both by a bit, while the Big '5 through 8' reduced their short positions ever so slightly.
As Ted has been pointing out ad nauseam, the resolution of the Big 4/8 short positions will be the sole determinant of precious metal prices going forward -- which should be totally obvious to all by now, but most remain oblivious to that fact -- and if they are aware of it, are careful never to mention it in the public domain.
![]()
The May Bank Participation Report [BPR] data is extracted directly from yesterday's Commitment of Traders Report. It shows the number of futures contracts, both long and short, that are held by all the U.S. and non-U.S. banks as of this past Tuesday’s cut-off in all COMEX-traded products.
For this one day a month we get to see what the world’s banks have been up to in the precious metals. They’re usually up to quite a bit -- and they certainly were this past month.
[The May Bank Participation Report covers the four-week time period from April 2 to May 7 inclusive]
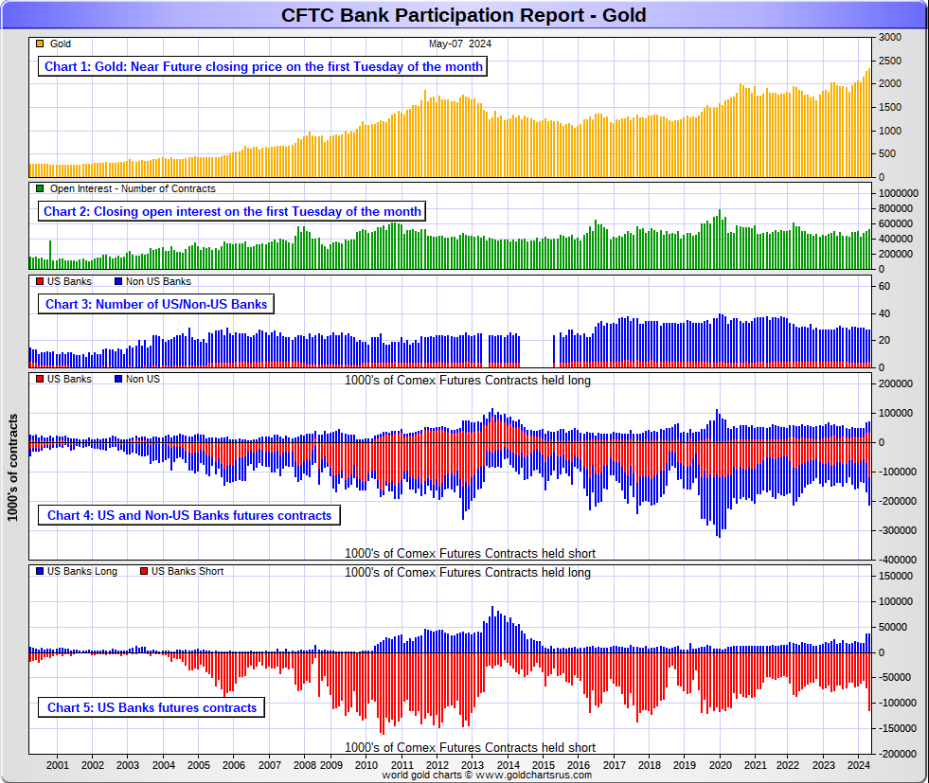
In gold, 5 U.S. banks are net short 78,756 COMEX contracts, up a whopping 46,904 contracts from the 31,852 contracts that 4 U.S. banks were short in April's BPR. This is the largest short position that the U.S. banks have held since May of 2020.
Also in gold, 23 non-U.S. banks are net short 64,680 COMEX contracts, down 2,181 contracts from the 66,861 contracts that 24 non-U.S. banks were short in April's BPR. And except for April's BPR, this is the biggest short position in gold that they non-U.S. banks have held since May 2022.
At the low back in the August 2018 BPR...these same non-U.S. banks held a net short position in gold of only 1,960 contacts -- so they've been back on the short side in an enormous way ever since.
Although some of the largest U.S. and foreign bullion banks are in the Big 8 short category in gold, some of the hedge fund/commodity trading houses are short even more grotesque amounts of gold than the banks. It's also a strong possibility that the BIS could be short gold in the COMEX futures market as well.
As of May's Bank Participation Report, 28 banks [both U.S. and foreign] are net short 27.0 percent of the entire open interest in gold in the COMEX futures market...up from the 19.8 percent that these same banks were net short in the April BPR.
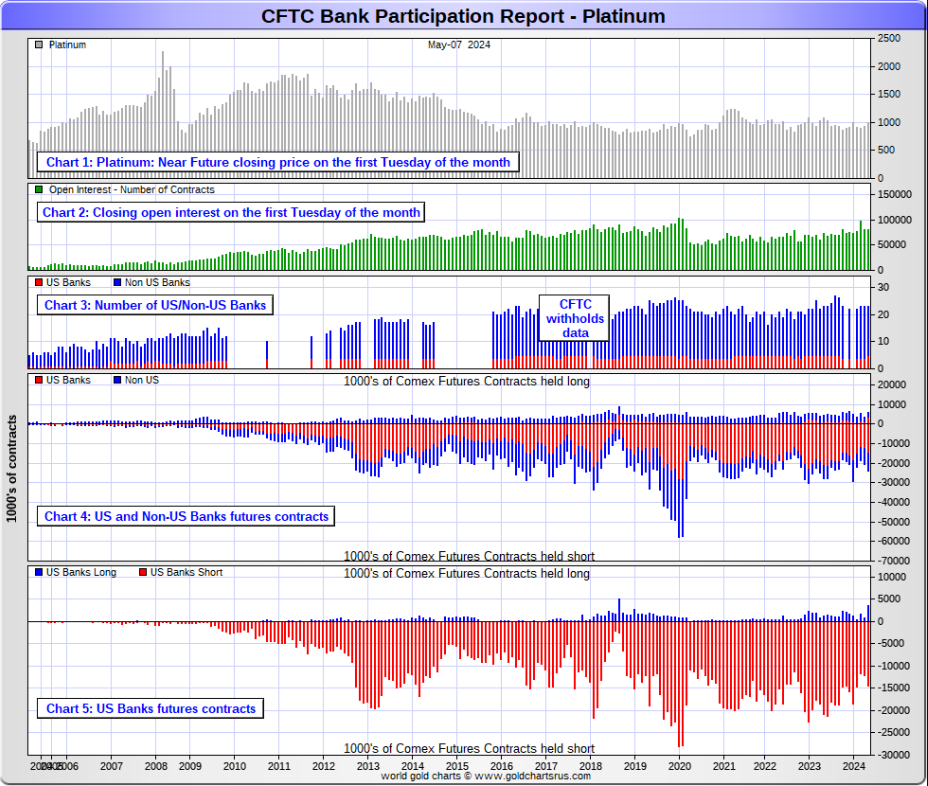
Here’s Nick’s BPR chart for gold going back to 2000. Charts #4 and #5 are the key ones here. Note the blow-out in the short positions of the non-U.S. banks [the blue bars in chart #4] when Scotiabank’s COMEX short position was outed by the CFTC in October of 2012. Click to enlarge.
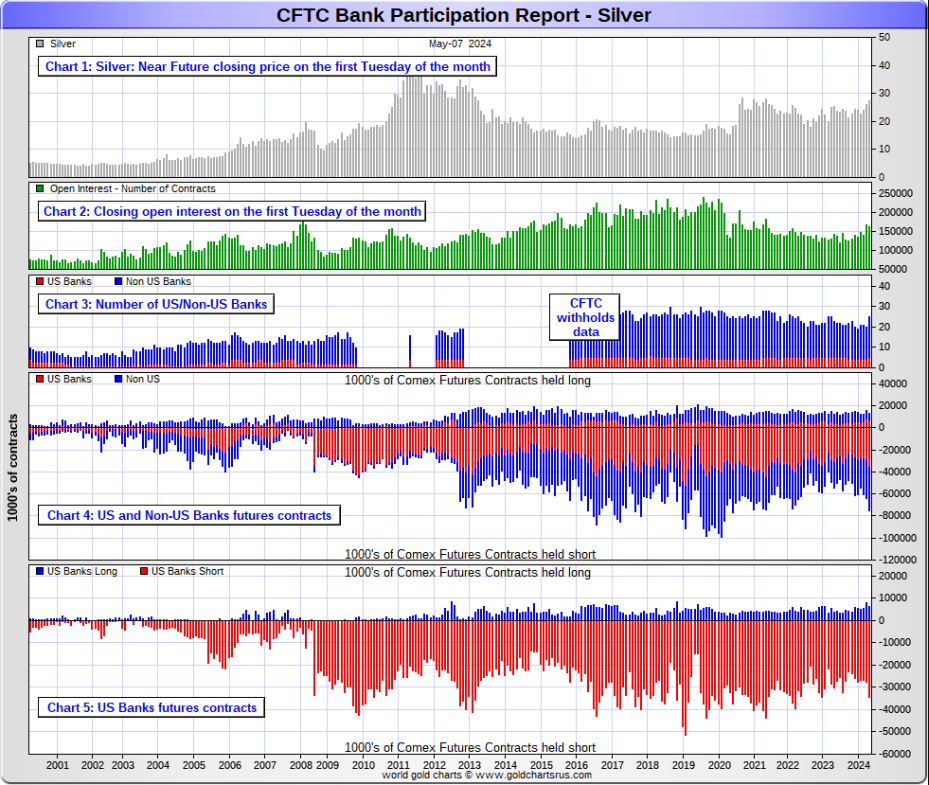
In silver, 5 U.S. banks are net short 28,206 COMEX contracts, up from the 19,302 contracts that 4 U.S. banks were short in the April BPR...the largest short position they've held since April 2023.
The biggest short holders in silver of the four U.S. banks in total, would be Citigroup, Wells Fargo and Bank of America.
And, like in gold, I have my suspicions about the Exchange Stabilization Fund's role in all this...although, also like in gold, not directly.
Also in silver, 20 non-U.S. banks are net short 33,518 COMEX contracts, up 4,280 contracts from the 29,238 contracts that 16 non-U.S. banks were short in the April BPR...their largest short position since March 2020.
I would suspect that HSBC, Barclays and Standard Chartered hold by far the lion's share of the short position of these non-U.S. banks...as do some of Canada's banks as well. And, like in gold, the BIS could also be actively shorting silver as well. The remaining short positions divided up between the other 15 or so non-U.S. banks are immaterial — and have always been so. The same can be said of most of the 23 non-U.S. banks in gold.
As of May's Bank Participation Report, 25 banks [both U.S. and foreign] are net short 38.2 percent of the entire open interest in the COMEX futures market in silver — up from the 29.1 percent that 20 banks were net short in the April BPR.
Here’s the BPR chart for silver. Note in Chart #4 the blow-out in the non-U.S. bank short position [blue bars] in October of 2012 when Scotiabank was brought in from the cold. Also note August 2008 when JPMorgan took over the silver short position of Bear Stearns—the red bars. It’s very noticeable in Chart #4—and really stands out like the proverbial sore thumb it is in chart #5. Click to enlarge.
In platinum, 5 U.S. banks are net short 10,835 COMEX contracts in the May BPR, down a smallish 346 contracts from the 11,181 contracts that 4 U.S. banks were short in the April BPR.
At the 'low' back in September of 2018, these U.S. banks were actually net long the platinum market by 2,573 contracts. So they have a very long way to go to get back to just market neutral in platinum...if they ever intend to, that is. They look permanently stuck on the short side to me, a fact that I point out regularly.
Also in platinum, 18 non-U.S. banks increased their net short position by 763 contracts...up to 6,816 contracts, from the 6,053 contracts that 19 non-U.S. banks were net short in the April BPR. Back in December's BPR, these non-U.S. banks were net short a microscopic 35 platinum contracts...so they're back on the short side in a big way.
Platinum remains the big commercial shorts No. 2 problem child after silver...but a very distant No. 2 down the list. How it will ultimately be resolved is unknown, but most likely in a paper short squeeze, as the known stocks of platinum are minuscule compared to the size of the short positions held -- and that's just the short positions of the world's banks I'm talking about here.
Of course there's now a structural deficit in it as well -- and I'll have more on this in The Wrap.
And as of May's Bank Participation Report, 23 banks [both U.S. and foreign] were net short 21.9 percent of platinum's total open interest in the COMEX futures market, which is almost unchanged from the 21.5 percent that these same 23 banks were net short in April's BPR.
Here's the Bank Participation Report chart for platinum. Click to enlarge.
In palladium, 4 U.S. banks are net long 3,142 COMEX contracts in the May BPR, up 842 contracts from the 2,300 contracts that '3 or less' U.S. banks were net long in the April BPR.
Also in palladium, 14 non-U.S. banks are net long 632 COMEX contracts, up from the 623 contracts that '9 or less' non-U.S. banks were net long in the April BPR.
And as I've been commenting on for almost forever, the COMEX futures market in palladium is a market in name only, because it's so illiquid and thinly-traded. Its total open interest in yesterday's COT Report was only 25,749 contracts...compared to 80,677 contracts of total open interest in platinum...161,868 contracts in silver -- and 529,835 COMEX contracts in gold.
But I should point out that open interest in palladium has been on a slow but steady increase over the last few years, because I remember when it was less than 9,000 contracts.
As I say in this spot every month, the only reason that there's a futures market at all in palladium, is so that the Big 8 commercial traders can control its price. That's all there is, there ain't no more.
As of this Bank Participation Report, 18 banks [both U.S. and foreign] are net long 14.7 percent of the entire COMEX open interest in palladium...virtually unchanged from the 14.8 percent of total open interest that 12 banks were net long in the April BPR.
For the last 3+ years, the world's banks have not been involved in the palladium market in a material way. And with them still net long, it's all hedge funds and commodity trading houses that are left on the short side. The Big 8 commercial traders, none of which are banks, are short 40.0 percent of total open interest in palladium as of yesterday's COT Report.
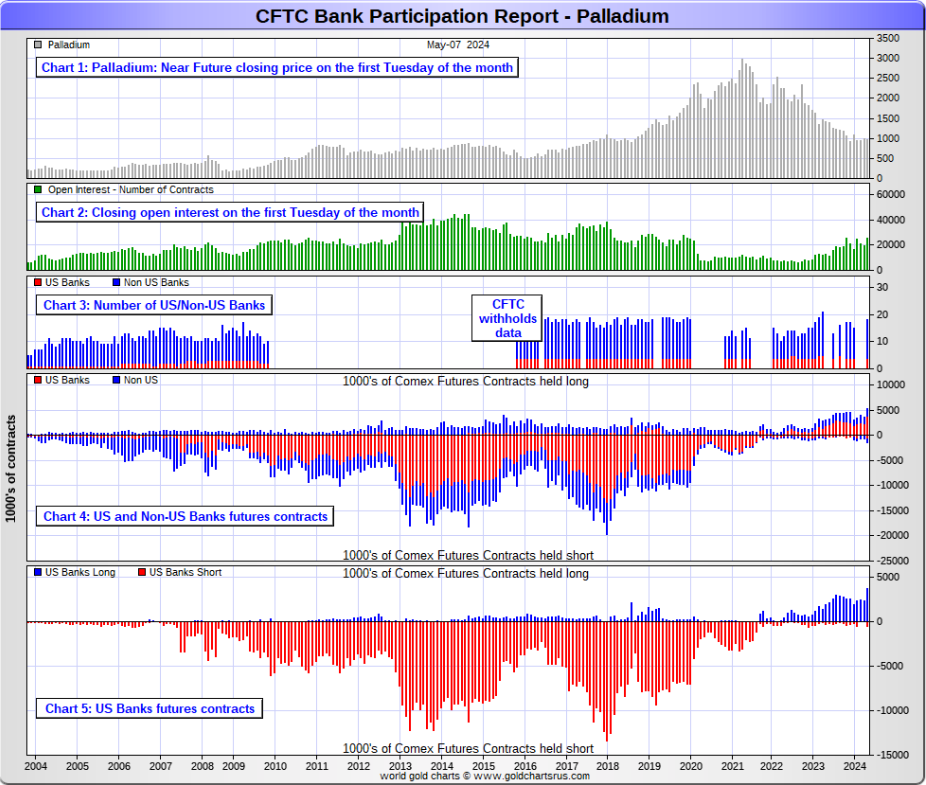
Here’s the palladium BPR chart. Although the world's banks are net long at the moment, it remains to be seen if they return as big short sellers again at some point like they've done in the past. Click to enlarge.
Excluding palladium for obvious reasons, and almost all of the non-U.S. banks in gold, silver and platinum...only a small handful of the world's banks, most likely no more than 5 or so in total -- and mostly U.S.-based...along with the BIS...continue to have meaningful short positions in the other three precious metals.
As I pointed out above, some of the world's commodity trading houses and hedge funds are also mega net short the four precious metals...far more short than the U.S. banks in some cases. They have the ability to affect prices if they choose to exercise it...which I'm sure they're doing at times. But it's still the big and collusive bullion banks at Ground Zero of the price management scheme.
And as has been the case for years now, the short positions held by these Big 4/8 traders, is the only thing that matters...especially the short positions of the Big 4...or maybe only the Big 1 or 2. How this is ultimately resolved [as Ted keeps pointing out] will be the sole determinant of precious metal prices going forward.
The Big 8 commercial traders, along with Ted's raptors...the small commercial traders other than the Big 8 commercial shorts...continue to have an iron grip on their respective prices -- and it will remain that way until they either relinquish control voluntarily, or are told to step aside.
However, considering the current state of affairs of the world's banking and financial system as it stands today -- and the structural deficits in silver and now most likely the other three precious metals as well -- the chance that these big bullion banks and commodity trading houses could get overrun at some point, is not zero -- and certainly within the realm of possibility if things go totally non-linear.
But...as Ted keeps reminding us from time to time, if they do finally get overrun...it will be for the very first time...which obviously wasn't allowed to happen this past week, either.
I don't have all that many stories, articles or videos for you today.
![]()
CRITICAL READS
Consumer sentiment tumbles as inflation fears surge
Consumer sentiment slumped as inflation expectations rose, despite otherwise strong signals in the economy, according to a closely watched survey released Friday.
The University of Michigan Survey of Consumers sentiment index for May posted an initial reading of 67.4 for the month, down from 77.2 in April and well off the Dow Jones consensus call for 76. The move represented a one-month decline of 12.7% but a year-over-year gain of 14.2%.
Along with the downbeat sentiment measure, the outlook for inflation across the one- and five-year horizons increased.
The one-year outlook jumped to 3.5%, up 0.3 percentage point from a month ago to the highest level since November.
Also, the five-year outlook rose to 3.1%, an increase of just 0.1 percentage point but reversing a trend of lower readings in the past few months, also to the highest since November.
“While consumers had been reserving judgment for the past few months, they now perceive negative developments on a number of dimensions,” said Joanne Hsu, the survey’s director. “They expressed worries that inflation, unemployment and interest rates may all be moving in an unfavorable direction in the year ahead.”
This CNBC news item put in an appearance on their Internet site at 10:13 a.m. EDT on Friday morning -- and was updated about an hour later. I thank Swedish reader Patrik Ekdahl for sending it our way -- and another link to it is here.
![]()
Citadel vs. Jane Street -- Doug Noland
I’ve for years warned of mounting liquidity risks, specifically in Treasuries and the ETF complex. Both benefit momentously from the moneyness attribute of perceived liquidity and safety. And especially after the Fed’s unprecedented March 2020 market liquidity bailout, faith in Treasury and ETF liquidity and market function has never been stronger.
Moral hazard is today a greater issue than ever. The likes of Citadel and Jane Street have become too big to fail – and they operate as such. And to see them (and their use of leverage) expand so aggressively corroborates the “Terminal Phase” excess and speculative “melt-up” theses.
For Fed officials to stick with “sufficiently restrictive” is bunk. The Bank Index (BKX) has returned 11.9% y-t-d. A look at first quarter asset growth doesn’t square with “restrictive.” JPMorgan Total Assets ballooned $215 billion, or 22% annualized, during Q1 to $4.091 TN. Bank of American Total Assets grew $93.7 TN, or 12% annualized, to $3.274 TN. Goldman Sachs Total Assets expanded $56.8 billion, or 14% annualized, to $1.698 TN.
Perhaps the more notable growth is with the powerful non-banks, which seem to follow the trajectory of Citadel and Jane Street. KKR Total Assets expanded $22.5 billion, or 28% annualized, during Q1 to $340 billion. Apollo grew $20.6 billion, or 26% annualized, to $334 billion. Intermediating “subprime” corporate debt into annuities with enticing yields is quite the booming (“private Credit”) business.
It was a fitting Friday... FT (Brooke Masters, Harriet Agnew, Jennifer Hughes, Eric Platt, Antoine Gara and Stephen Morris) headline: “‘There’s Money Everywhere’: Milken Conference-Goers Look for a Dealmaking Revival”: “The Hilton and other nearby hotels were heaving, with elevators packed to the gills and every table and chair claimed for rounds of speed dating with potential financial partners. But the big business was done behind closed doors in hotel suites and in the homes of local tycoons. ‘It’s like going to Las Vegas,’ the co-founder of one alternative asset manager said. ‘There’s money everywhere. Everyone is looking around, seeing who else can I talk to.’ The conference was the largest it has been since the return to in-person events after the pandemic.”
I’ve studied enough market history – including the fateful “Roaring Twenties” period – to be uncomfortable with much of what I observe these days.
Doug's weekly commentary is worth reading -- and another link to it is here. Gregory Mannarino's post market close rant for Friday is linked here -- and runs for 22 minutes.
![]()
Ukraine Approaching Complete Collapse and NATO in Panic -- an interview with Scott Ritter
Scott Ritter is a former Marine intelligence officer who served in the former Soviet Union, implementing arms control agreements, and on the staff of General Norman Schwartzkopf during the Gulf War, where he played a critical role in the hunt for Iraqi SCUD missiles. From 1991 until 1998, Mr. Ritter served as a Chief Inspector for the United Nations in Iraq, leading the search for Iraq’s proscribed weapons of mass destruction. Mr. Ritter was a vocal critic of the American decision to go to war with Iraq. His new book, Disarmament in the Time of Perestroika: Arms Control and the End of the Soviet Union, is his ninth.
I haven't had time to watch all of this 1 hour and 11 minute video interview, but will certainly find the time over the weekend. It was posted on the youtube.com Internet site on Friday morning -- and I thank Roy Stephens for sharing it with us. Another link to it is here.
![]()
Visualizing the Copper Investment Opportunity in One Chart
Copper is essential for clean energy applications such as solar panels, wind turbines, and electric vehicles (EVs), as well as for expanding electrical grids.
The surge in demand for the metal, driven by the growing adoption of these technologies, presents a unique investment opportunity for early investors in copper mining companies.
Visual Capitalist's Bruno Venditti introduces this chart by Sprott exploring the growing gap between copper supply and demand until 2050, based on projections from BloombergNEF’s Transition Metals Outlook 2023.
This rather brief 1-chart article was posted on the Zero Hedge website at 8:40 a.m. on Thursday morning EDT -- and I thank Richard Saler for pointing it out. Another link to it is here.
![]()
Physical demand is breaking gold and silver manipulation, Eric Sprott says
Mining entrepreneur Eric Sprott, interviewed this week by the TF Metals Report's Craig Hemke on Sprott Money's "Ask the Expert" program, says demand from China and India for real metal is starting to break the longstanding Western-based manipulation of gold and silver prices.
Many people, Sprott says, are realizing that "currencies aren't to be trusted" anymore. He believes that declines in the major gold and silver exchange-traded funds do not signify investor selling but rather shorting raids by bullion dealers exchanging the shorted ETF shares for real metal so they can meet some very inconvenient demands for delivery.
Sprott says he is most bullish about silver -- and again credits silver market analyst Ted Butler of Butler Research for his many years of work exposing silver market manipulation.
While he feels that major gold producers "have failed us," Sprott says intermediate and small gold mining companies are showing signs of life and have great potential and soon will attract much more interest. The last bull run in the monetary metals, he notes, produced mining share gains of hundreds of percent.
This 32-minute long must watch video interview was conducted earlier in the week -- and is embedded in a GATA dispatch. Another link to it is here.
![]()
QUOTE of the DAY
![]()
The WRAP
"Understand this. Things are now in motion that cannot be undone." -- Gandalf the White
![]()
Today's pop 'blast from the past' dates from 1967...but was composed by American singer-songwriter Michael Nesmith in 1964. It was first recorded by the northern bluegrass band The Greenbriar Boys -- and was included on their 1966 album Better Late than Never! It went nowhere. But then up-and-coming 21-year old singer named Linda Ronstadt got hold of it -- and the rest, as they say, is history. The link is here. Of course there's a bass cover to this -- and it's far 'busier' that I expected. That's linked here.
I've got two short classical 'blasts from the past' for you today -- and both by French composer Camille Saint-Saëns. The first his fiery "Introduction and Rondo Capriccioso" in A minor for violin and orchestra. It was dedicated to the virtuoso violinist Pablo de Sarasate, who performed the solo violin part at its premiere in April 1867. Here's Ray Chen tossing it off, accompanied by the Malta Philharmonic Orchestra. The link is here.
The second is the penultimate movement from his humorous musical suite "The Carnival of the Animals" composed in 1886. No two pieces from the same composer could be more radically different. Here are Yo-Yo Ma and Kathryn Stott serving it up exactly right -- and the link to that is here. And as wonderful as that performance is...try this version as performed on the theremin, linked here.
![]()
It was pretty obvious that the commercial traders of whatever stripe/the powers-that-be weren't going to allow the precious metals to run away to the upside in New York, the way they were going before 'da boyz' stepped in in London.
Although gold was allowed to close higher on the day, that didn't help their shares, as they closed basically unchanged. Even though silver was closed a long way off its London high tick -- and down on the day by 18 cents, the shares didn't sell off all that much.
And it should be carefully noted that silver's price was capped the moment it hit $29.00 in the July contract, its current front month.
Platinum was allowed to close higher, but a quick glance at its Kitco chart at the top of today's column shows that its price would have blown sky high on at least two different occasions during the COMEX trading session in New York. Of course palladium had no chance either once the not-for-profit sellers put in an appearance around 9:15 a.m. EDT. Both were closed well of their highs, especially palladium.
Any attempt by the precious metals to find their free-market prices are being firmly dealt with currently -- and I'll have more on this in The Wrap.
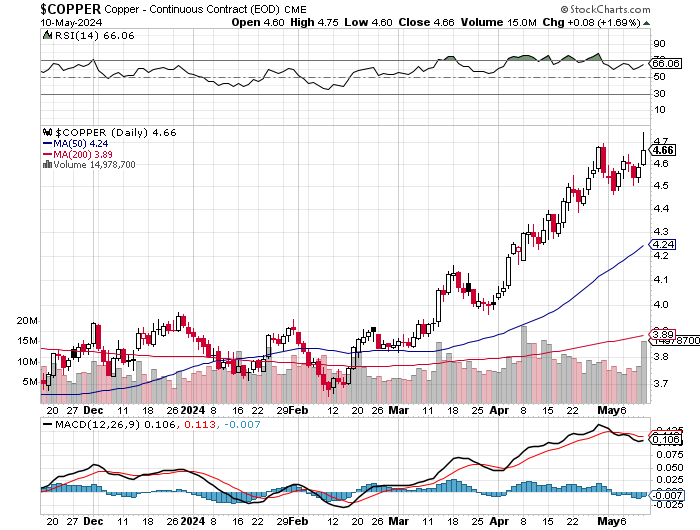
Copper had a big day, closing up 8 cents at $4.66/pound...but 9 cents off its high tick in its current front month. This is another commodity whose price is being suppressed despite the supply/demand fundamentals in it.
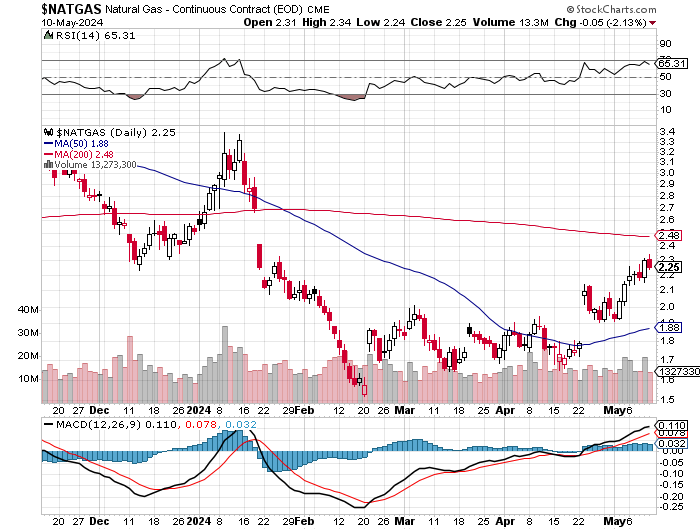
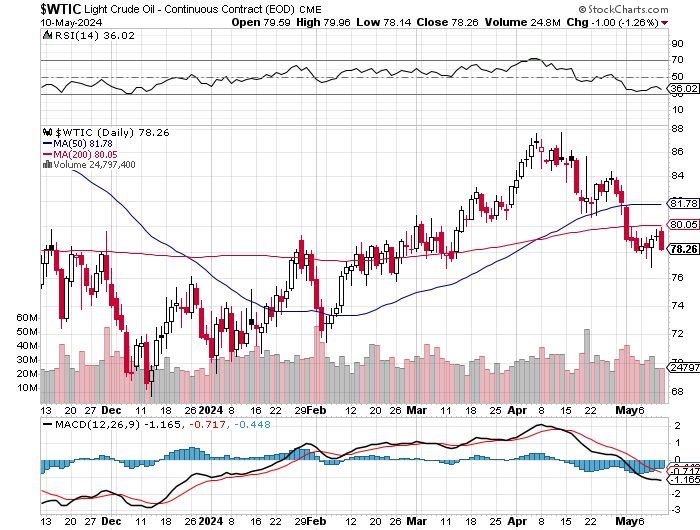
Natural gas [chart included] closed lower by 5 cents at $2.25/1,000 cubic feet...after touching the overbought mark on its RSI trace on Thursday. WTIC got clocked by $1.00...giving back almost its entire week's gains in the process...finishing the Friday session at $78.26/barrel -- and is comfortably back below any moving average that matters.
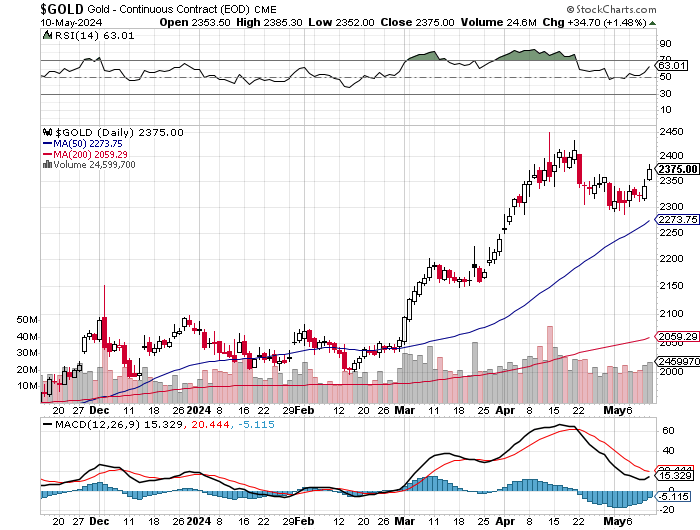
Here are the 6-month charts for the Big 6+1 commodities...courtesy of stockcharts.com as always and, if interested, their COMEX closing prices in their current front months on Friday should be noted. Click to enlarge.
So, in the COMEX corner in the paper market, we have the butt-ass ugly commercial net short positions in gold, silver and platinum that would choke a horse...coupled with the most negative Bank Participation Report in years. And in the other corner we have west to east physical off-take in both silver and gold that's draining the depositories, ETFs and mutual funds at an alarming rate.
This is a fight to the finish, as the commercial traders, mostly bullion banks, haven't given an inch so far...continuing to go short against all comers. It's not an exaggeration to say the stakes involved are incalculable. Paper may triumph in the very short term, but in the end the structural deficits will trump all.
It was another week of manic inflows and outflows of silver from the COMEX and SLV...plus other ETFs and mutual funds. As Ted continues to point out, this hand-to-mouth situation indicates that the structural deficit in silver continues to deepen...with efforts to meet physical demand, growing ever more frantic.
Despite the big rally in gold that began back at the end of February, gold continue to get drained from mutual funds and ETFs as well -- and is almost certainly an indication that these raids on their stocks are solely to satisfy demand from the east...something that Ted pointed out recently. The fact that gold funds are now being raided, is a sure indication that whatever gold there is in London or in New York is already in the strongest of hands.
The structural deficit in silver is already well established and ongoing -- and as just mentioned, there are signs of it showing up in gold as well.
To add to that -- and in yesterday's column, there was the link to this Reuters article that shows structural deficits in both platinum and palladium.
But the metal that's getting the most press these days -- and isn't even in a structural deficit at this point, is copper. Its price is beginning to reflect that. But despite that fact, the commercial traders in the Producer/Merchant category, continue to go short against all comers in it as well. And as stated further up in today's missive, they are "net short 89,076 copper contracts/2.227 Billion pounds" of the stuff, as what's left of world inventories continues to dwindle.
As British economist Peter Warburton stated in his classic April 2001 essay..."The Debasement of World Currencies: It is inflation, but not as we know it"...
"What we see at present is a battle between the central banks and the collapse of the financial system fought on two fronts. On one front, the central banks preside over the creation of additional liquidity for the financial system in order to hold back the tide of debt defaults that would otherwise occur. On the other, they incite investment banks and other willing parties to bet against a rise in the prices of gold, oil, base metals, soft commodities or anything else that might be deemed an indicator of inherent value. Their objective is to deprive the independent observer of any reliable benchmark against which to measure the eroding value, not only of the U.S. dollar, but of all fiat currencies. Equally, they seek to deny the investor the opportunity to hedge against the fragility of the financial system by switching into a freely traded market for non-financial assets.
It is important to recognize that the central banks have found the battle on the second front much easier to fight than the first. Last November I estimated the size of the gross stock of global debt instruments at $90 trillion for mid-2000. How much capital would it take to control the combined gold, oil, and commodity markets? Probably, no more than $200 billion, using derivatives. Moreover, it is not necessary for the central banks to fight the battle themselves, although central bank gold sales and gold leasing have certainly contributed to the cause. Most of the world's large investment banks have over-traded their capital [bases] so flagrantly that if the central banks were to lose the fight on the first front, then the stock of the investment banks would be worthless. Because their fate is intertwined with that of the central banks, investment banks are willing participants in the battle against rising gold, oil, and commodity prices.
Central banks, and particularly the U.S. Federal Reserve, are deploying their heavy artillery in the battle against a systemic collapse. This has been their primary concern for at least seven years. Their immediate objectives are to prevent the private sector bond market from closing its doors to new or refinancing borrowers and to forestall a technical break in the Dow Jones Industrials. Keeping the bond markets open is absolutely vital at a time when corporate profitability is on the ropes. Keeping the equity index on an even keel is essential to protect the wealth of the household sector and to maintain the expectation of future gains. For as long as these objectives can be achieved, the value of the U.S. dollar can also be stabilized in relation to other currencies, despite the extraordinary imbalances in external trade."
What he forecast 23 years ago, has now reached its end game -- and everything Warburton spoke of has developed exactly as he predicted back then. But the financial system, led by the Federal Reserve, are desperate to keep the paper game going -- and most likely won't survive the impending rush from all things paper, to all things physical.
The structural deficits in all these metals, plus other hard and soft commodities are not going to go away, even if we get higher prices tomorrow.
But as Eric Sprott pointed out in his interview in the Critical Reads section further up...will the powers-that-be allow this price reset to happen, even though everything is set up for it -- and the supply/demand fundamentals require it. Will things get draconian if the precious metals and other commodities really start to run away to the upside and the commercial shorts on the COMEX get overrun? A good question with no answer. But I've always said that they would close the COMEX and save all the shorts. Will that happen? Who knows...but that's the only way out for the shorts unless the Fed and/or the Exchange Stabilization Fund steps in -- and backstops the 'too big to fail' banks and brokerage houses.
Even if they 'save' the big boys, there will more than enough shorts left to cover that it will drive their respective prices to the moon regardless. It's a 'Catch 22' situation if there ever was one.
Eric also spoke of his concern about David Rogers Webb's "The Great Taking"...which includes crashing the current 'everything bubble'...the biggest financial bubble the world has ever known. He probably has more skin in the precious metals game than the rest of us combined. He has a right to be worried -- and I certainly haven't forgotten about it, either. Neither should you.
This fight is not just a financial one...it's a fight between the West and the rest of the world. There's a power transfer going on from West to East that started when the U.S. took itself off the gold exchange standard in 1971...leaving us with the debt-based fiat currency system that we have today. As you know, none in recorded history have survived -- and this one won't, either.
The west is fighting hammer and tong to avoid the consequences of that, as per Warburton's three famous paragraphs above state. It's now 50+ years since that event -- and they've finally run out of road.
The financial powers-that-be, including the globalist power elite in the west, would not hesitate to sacrifice all of humanity to further their cause and remain in control...burning the current financial system to the ground -- and the world economy with it in the process.
This is the end-game scenario playing away in the back of my mind all the time now and, like you, I'm hoping to just survive it.
As always, I'm still 'all in'...but have my eyes wide open...and will remain so to whatever end.
I'm done for the day -- and the week -- and I'll see you here on Tuesday.
Ed
About the author

SUBSCRIBE: https://edsteergoldsilver.com/

Ed Steer’s Daily Analysis of the Gold and Silver Markets
After eight years of writing about the precious metals for Casey Research, the folks at Stansberry & Associates—who just recently purchased controlling interest in the company—decided that my ‘niche market’ column didn’t fit into their plans.
Since the time that Casey Research was kind enough to offer me a stand-alone column, it became their most highly-rated blog almost from the outset—and has remained that way up to this date...