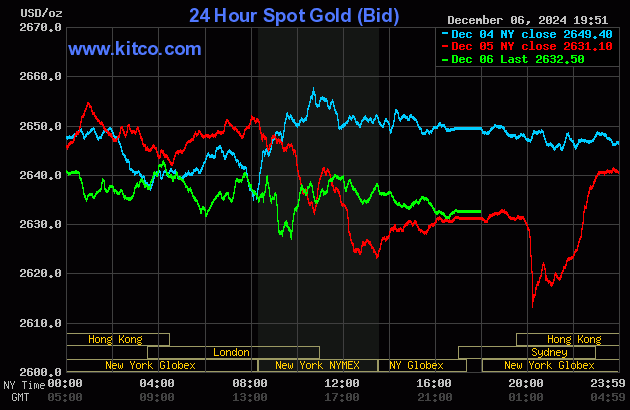
The gold price didn't do anything in the first hour or so of Globex trading in New York on Thursday evening, but began to creep lower starting just before the 9:00 a.m. Shanghai open. It was light's out at that point, with its low tick set minutes later. Gold came roaring back, but was capped the moment it broke above $2,640 spot -- and every time it broke above that mark up to and including its last time at noon in COMEX trading in New York, it got tapped lower. From noon EST it was sold unevenly lower until about thirty minutes before trading ended at 5:00 p.m.
The low and high ticks in gold were reported as $2,635.60 and $2,667.90 in the February contract...an intraday move of about 32 bucks. The February/ April price spread differential in gold at the close in New York yesterday was $20.70...April/June was $21.20 -- and June/August was $19.70 an ounce.
Gold was closed on Friday afternoon in New York at $2,632.50 spot...up $1.40 on the day. Net volume was certainly on the lighter side at around 146,500 contracts -- and there were about 20,500 contracts worth of roll-over/switch volume on top of that.
I saw that 571 gold, plus 35 silver contracts were traded in December yesterday -- and I'll find out tonight if any of that shows up in either the Daily Delivery or Preliminary Reports later tonight.
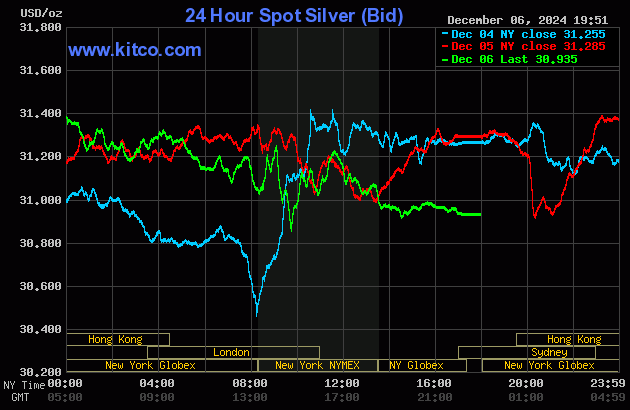
Silver's price path was engineered in a similar fashion as gold's up until shortly after 12 o'clock noon in Shanghai on their Friday morning -- and about an hour later the price pressure began -- and it was sold/engineered quietly and very unevenly lower until 2:30 p.m. in after-hours trading in New York. It had a quiet up/down move from that juncture until the market closed at 5:00 p.m. EST.
The low and high ticks in silver were recorded by the CME Group as $31.935 and $31.32 in the March contract...an intraday move of 61.5 cents...two percent. The March/May price spread differential in silver at the close in New York yesterday was 26.0 cents...May/July was also 26.0 cents -- and July/ September was 25.4 cents an ounce.
Silver was closed in New York on Friday afternoon at $30.935 spot...down 35 cents on the day -- and 46.5 cents off its Kitco-recorded high tick. Net volume was nothing really special at about 56,500 contracts -- and there were around 5,100 contracts worth of roll-over/switch volume in this precious metal.
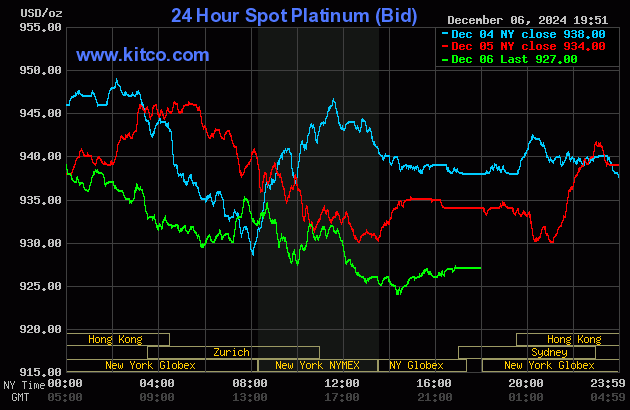
Platinum's price path was mostly similar to both silver and gold until noon China Standard Time on their Friday afternoon -- and from that juncture it was engineered two very broad and uneven steps lower until its low tick was set around 2:15 p.m. in after-hours trading in New York. It then crawled a few dollars higher until the market closed at 5:00 p.m. EST. Platinum was closed down a further 7 dollars on the day at $927 spot.
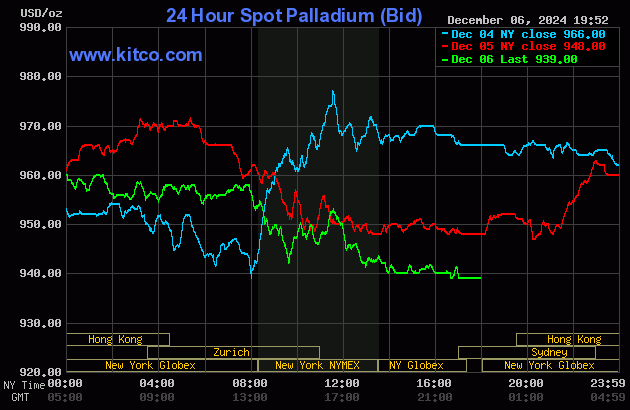
With some minor variations, palladium's price was managed in a similar fashion as platinum's -- and its uneven engineered price decline ended at 2 p.m. in after-hours trading in New York. It didn't do much of anything after that. Palladium was closed lower by a further 9 bucks at $939 spot.
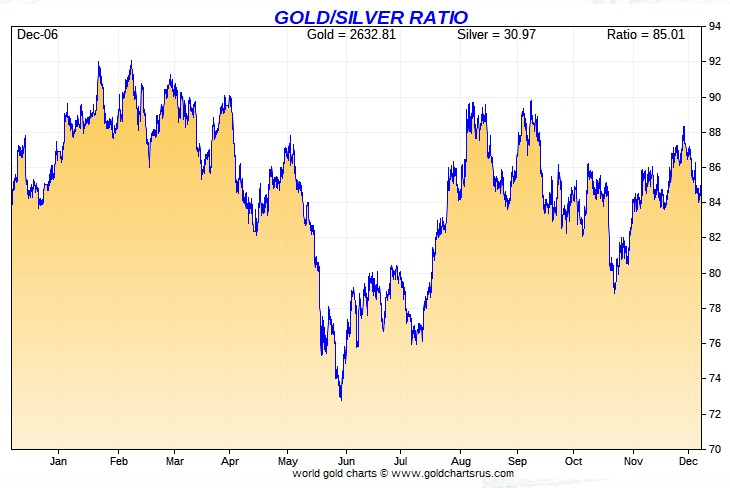
Based on the kitco.com spot closing prices in silver and gold posted above, the gold/silver ratio worked out to 85.1 to 1 on Friday...compared to 84.1 to 1 on Thursday.
Here's the 1-year Gold/Silver Ratio Chart...courtesy of Nick Laird. Click to enlarge.
![]()
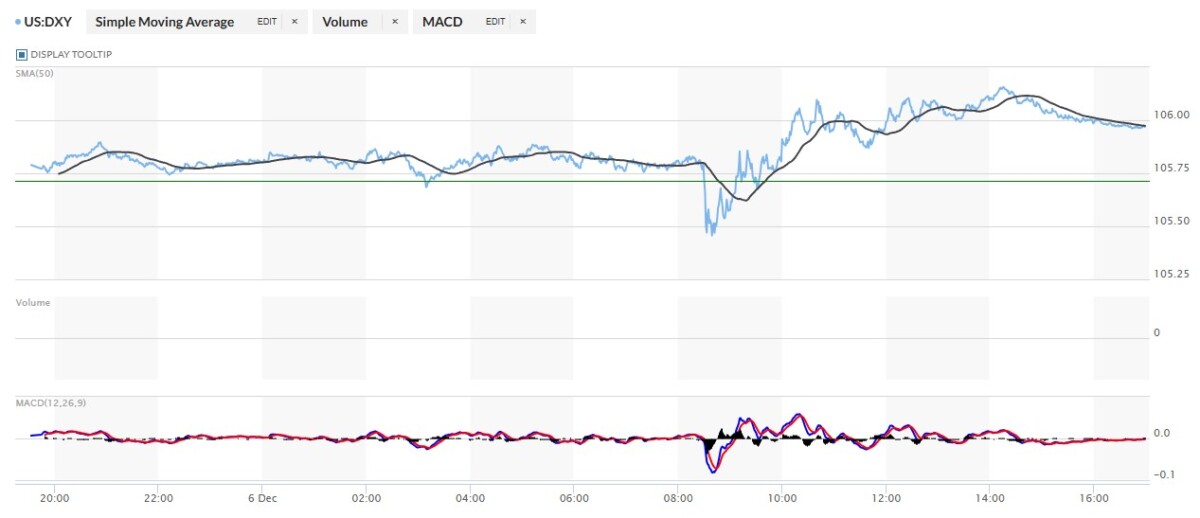
The dollar index closed very late on Thursday afternoon in New York at 105.71 -- and then opened higher by 8 basis points once trading commenced at 7:33 p.m. EST on Thursday evening, which was 8:33 a.m. China Standard Time on their Friday morning. It wandered very quietly and broadly sideways until that non-farm payroll number hit the tape at 8:30 a.m. in New York. A trap door opened under it, but the usual 'gentle hands' were there in an instant -- and from that point it chopped quietly higher at an ever-decreasing rate until around 2:15 p.m. EST. It then edged quietly lower until the market closed at 5:00 p.m.
The dollar index finished the Friday trading session in New York at 106.06...up 35 basis points from its close on Thursday.
Here's the DXY chart for Friday...thanks to marketwatch.com as usual. Click to enlarge.
Here's the 6-month U.S. dollar index chart, courtesy of stockcharts.com as usual. The delta between its close...106.04..and the close on DXY chart above, was 2 basis points below that. Click to enlarge.
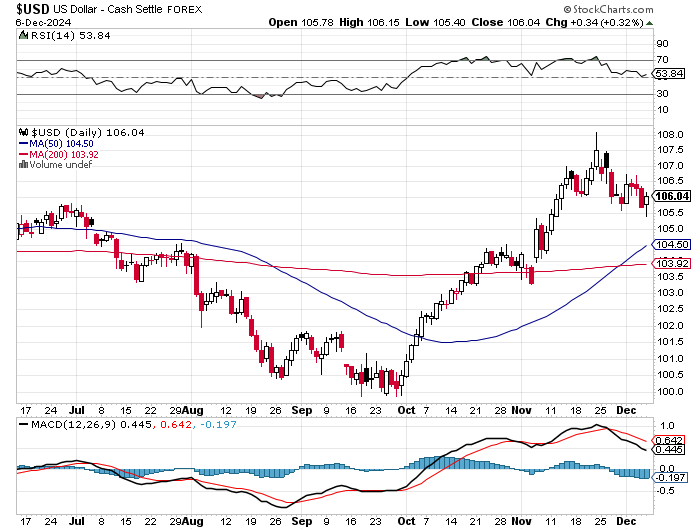
One would have to be mentally creative to see any correlation between the dollar index and precious metal prices on Friday -- and it's obvious that the powers-that-be stepped in to save the DXY from crashing at 8:30 a.m. in New York.
U.S. 10-year Treasury: 4.1510%...down 0.0290/(-0.69%)...as of the 1:59 p.m. CST close
Here's the 5-year 10-year U.S. Treasury chart from the yahoo.com Internet site -- which puts the yield curve into a somewhat longer-term perspective. Click to enlarge.
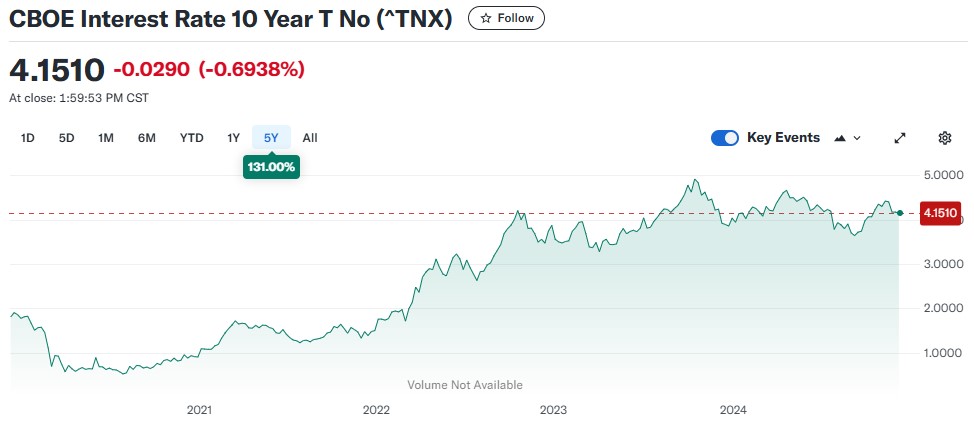
For the week, the ten-year was down about 7 basis points...but at its high on Wednesday, it was up about 5 basis points -- and it's obvious from its 5-day chart that Fed forcefully intervened from that point until trading ended on Friday.
![]()
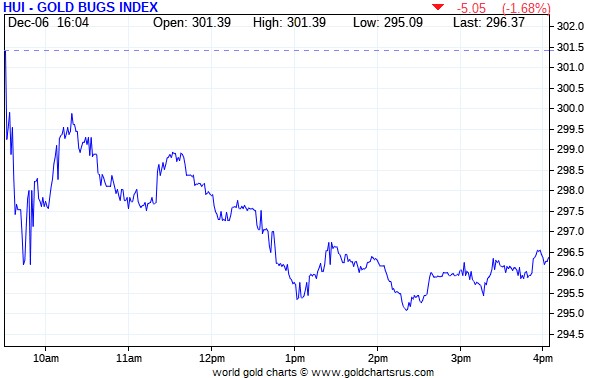
The gold stocks headed lower right out of the gate at the 9:30 opens in New York on Friday morning -- and bottomed out about fifteen minutes later. They then rallied a bit until 10:15 a.m. -- and then wandered unevenly lower until 2:20 p.m. EST. Then, despite the fact that gold continued to crawl lower in price, the shares chopped a bit higher until trading ended at 4:00 p.m. The HUI closed down 1.68 percent.
Although silver got smacked pretty good in the spot market, Nick Laird's 1-year Silver Sentiment Index closed lower by only 1.60 percent. Click to enlarge.
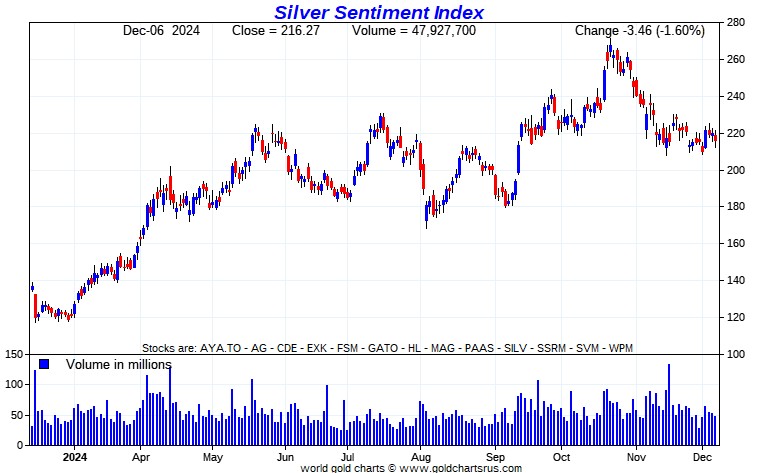
The hands-down star yesterday was SSR Mining, as it closed up 4.27 percent on this news. Aya Gold & Silver also closed higher by 1.12 percent. The biggest underperformer was Fortuna Silver, as it closed down 3.67 percent.
There was also this news from Wheaton Precious Metals yesterday.
The silver price premium in Shanghai over the U.S. price on Friday was 6.82 percent.
The reddit.com/Wallstreetsilver website, now under 'new' but not improved management, is linked here. The link to two other silver forums are here -- and here.
![]()
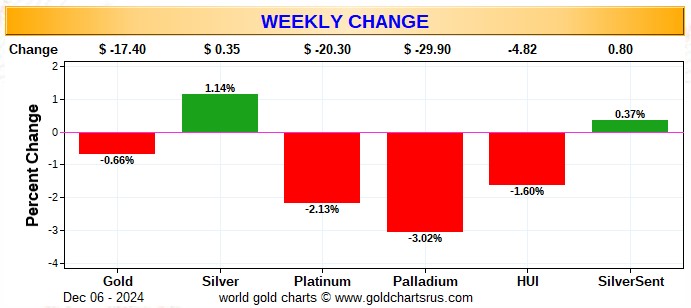
Here are two of the usual three charts that appear in this spot in every weekend missive. They show the changes in gold, silver, platinum and palladium in both percent and dollar and cents terms, as of their Friday closes in New York — along with the changes in the HUI and the new Silver Sentiment Index.
Here's the weekly chart, which also does double-duty as the month-to-date chart for this one week only. Everything silver outperformed everything gold by a bit -- and that's all because of that big jump higher in everything silver-related on Tuesday. However, not much should be read into this data. Click to enlarge.
Here's the year-to-date chart -- and here's where the outperformance of everything silver-related is clearly visible...although nothing to write home about. As I say every week, the most glaring thing about this chart [as it has been all year] is the ongoing and huge underperformance of the precious metal equities vs. the gains posted by their underlying precious metals. This is particularly true of the gold stocks. I'm sure that will change over time...but as for how much time that will be, is anyone's guess. However, I'm sure the lack of big institutional buying hasn't helped. It's also noteworthy that platinum and palladium have been down all year -- and I have no idea why 'da boyz' are keeping their respective prices in the dirt...but they are. Click to enlarge.
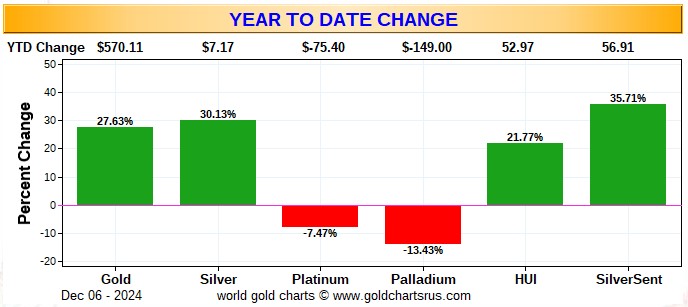
Of course -- and as I mention in this spot every Saturday -- and will continue to do so...is that if the silver price was sitting close to a new all-time high of $50+ dollars an ounce, like gold is close to its new all-time high of $2,800 the ounce...it's a given that the silver equities would be outperforming their golden cousins by far more than they are already...both on a relative and absolute basis.
![]()
The CME's Daily Delivery Report for Day 7 of December deliveries shows that 468 gold -- and only 2 silver contracts were posted for delivery within the COMEX-approved depositories on Tuesday.
In gold, the two largest short/issuers by far were Wells Fargo Securities and British bank HSBC, issuing 200 and 123 contracts respectively...the former from their house account. In very distant third and fourth place were Canada's Scotia Capital/Scotiabank and JPMorgan, issuing 70 and 40 contracts...the former out of their house account. There was another big list of long/stoppers -- and the two biggest by far were BofA Securities and Citigroup...picking up 197 and 115 contracts respectively...BofA for their house account -- and all but 4 contracts that Citigroup stopped were for their own account as well.
In silver, Stonex Financial and ADM issued one contract each out of their respective client accounts -- and Wells Fargo Securities picked up both for their house account.
The link to yesterday's Issuers and Stoppers Report is here.
So far in December, there have been 17,102 gold contracts issued and stopped -- and that number in silver is 6,917. In platinum it's 84 contracts -- and in palladium...52.
The CME Preliminary Report for the Friday trading session showed that gold open interest in December rose by 188 contracts, leaving 1,355 still open, minus the 468 contracts mentioned a few paragraphs ago. Thursday's Daily Delivery Report showed that 133 gold contracts were actually posted for delivery on Monday, so that means that 188+133=321 more gold contracts just got added to the December delivery month.
Silver o.i. in December dropped by 169 COMEX contracts, leaving 480 still around, minus the 2 contracts mentioned a bunch of paragraphs ago. Thursday's Daily Delivery Report showed that 180 silver contracts were actually posted for delivery on Monday, so that means that 180-169=11 more silver contract were added to December deliveries.
Total gold open interest fell by 519 contracts -- but total silver o.i. rose by 1,407 COMEX contracts.
Both these numbers are subject to some revision by the time the final figures are posted on the CME's website later on Monday morning CST -- and I'll be reporting on these 'revisions' only if they're out of line.
[I checked Thursday's final total open interest numbers -- and the revision in gold was down a bunch...from +3,233 contracts, down to +627 contracts...the more the better. But once again the adjustment in silver was negligible. The change in open interest from the Preliminary Report went from +2,567 contracts...down to +2,507 contracts in the final.]
![]()
There were no reported changes in GLD on Friday...however, there were 37,648 troy ounces of gold taken out of GLDM. But after that 4.329 million troy ounces of silver were added to SLV on Thursday, an authorized participant removed 1,366,953 troy ounces of silver from SLV yesterday.
In other gold and silver ETFs and mutual funds on Planet Earth on Friday, net of any changes in COMEX, GLD, GLDM and SLV activity, there were a net 7,593 troy ounces of gold removed...however, a net 281,531 troy ounces of silver were added.
There was no sales report from the U.S. Mint yesterday -- and none so far this month. As I pointed out in this spot last week, I don't expect much if anything more from the mint for the rest of this calendar year.
![]()
The only activity in gold over at the COMEX-approved depositories on the U.S. east coast on Thursday were the 11,817 troy ounces that ended up at Brink's, Inc.'s 'Enhanced Delivery' sub-depository. Nothing was shipped out -- and there was no paper activity, either. The link to this is here.
It was very quiet in silver as well. The only activity there were the 116,115 troy ounces that got dropped off at Brink's, Inc. But there was some activity in the paper department, as 883,478 troy ounces were transferred from the Registered category and back into Eligible...614,546 troy ounces at Asahi, with the remaining 268,932 troy ounces making that same trip over at Manfra, Tordella & Brookes, Inc. The link to all this is here.
There wasn't much going on over at the COMEX-approved gold kilobar depositories in Hong Kong on their Thursday, either -- and what there was, happened over at Brink's, Inc. as usual. They reported receiving 120 kilobars -- and shipped out 359 of them. The link to this, in troy ounces, is here.
The Shanghai Futures Exchange reported that a net 388,642 troy ounces of silver were added to their inventories on their Friday, which now stands at 42.116 million troy ounces.
![]()
Here are the usual 20-year charts that show up in this space in every weekend column. They show the total amounts of physical gold and silver held in all known depositories, ETFs and mutual funds as of the close of business on Friday.
During the week just past, there were a net 392,000 troy ounces of gold removed -- and a net 385,000 troy ounces of silver were withdrawn as well. Click to enlarge.
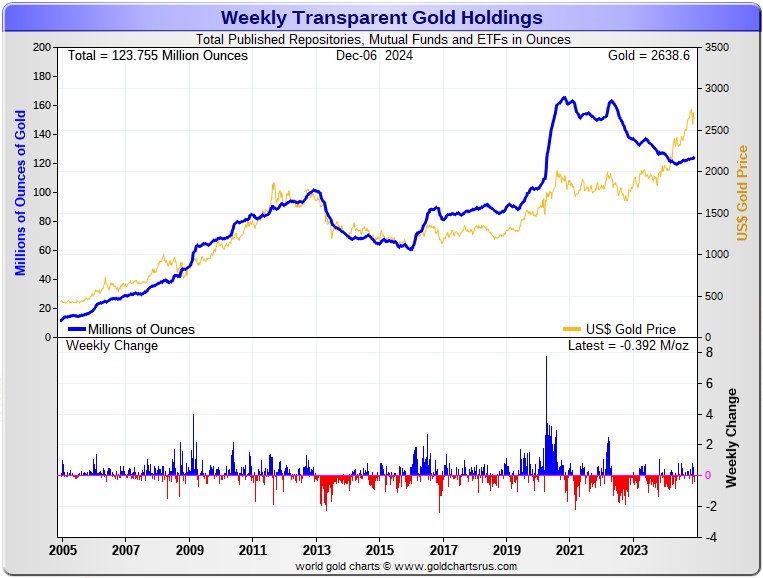
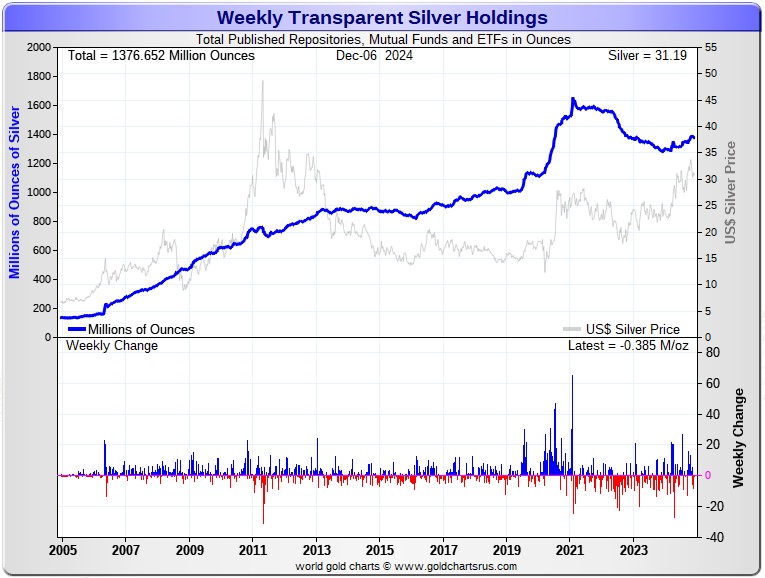
According to Nick Laird's data on his website, a net 52,000 troy ounces of gold were removed from all the world's known depositories, mutual funds and ETFs during the last four weeks. -- and a net 13.683 million troy ounces of silver were withdrawn during that same time period as well. One has to suspect that some of that silver removed was used to plug the ongoing structural deficit.
Retail bullion sales are back to being comatose once again, which is not entirely surprising. Premiums remain the the lowest they've been in ages -- and I haven't seen any sign that they've been raising them much, if at all. There are some really great deals to be had out there.
At some point there will be ever larger quantities of silver required by all the ETFs and mutual funds once serious institutional buying really kicks in -- but since 'da boyz' stepped into the market when silver hit $35 bucks six or so weeks ago...that demand has dried up.
But the really big buying lies ahead of us when the silver price is finally allowed to rise substantially, which I'm sure is something that keeps the powers-that-be in the silver world awake at night -- and why they're desperate in their attempts to keep it from rising faster than it already is. Their efforts were on full display again this past week.
Then you have to add in that now-back-to-gargantuan 31.29 million troy ounces sold short in SLV. The physical metal has to be found to cover that...or those short this ETF have to buy back their short positions through the purchase of SLV shares...either of which scenario will have the effect of driving the silver price even higher.
And as Ted stated a while ago now, it would appear that JPMorgan has parted with most of the at least one billion troy ounces that they'd accumulated since the drive-by shooting that commenced at the Globex open at 6:00 p.m. EDT on Sunday, April 30, 2011. They had to part with more again this past week, as the frantic in/out movement in silver at the COMEX and in SLV remains ongoing...particularly in the latter.
They have to continue coughing up even more ounces to feed this year's ongoing structural deficit...another now 182 million troy ounces according to that last report from The Silver Institute...which I'm sure didn't include the approximately 120 million ounces that India purchased during Q1/2024...plus the 71.8 million ounces they've imported since...which includes the 10.7 million oz. they bought in October. Then there's the 13.9 million ounces that China imported in June -- and all the silver that's gone into all these silver ETFs and mutual funds so far this year. Once also has to suspect that India, amongst others, were big buyers in November...however none of that data will be available for a while.
The physical demand in silver at the wholesale level continues unabated -- and was very chunky again this past week in both COMEX and SLV inventories...as I pointed out above. The amount of silver being physically moved, withdrawn, or changing ownership continued unabated. This frantic in/out activity, as Ted had been pointing out for years, is a sure sign that 1,000 oz. good delivery bars are getting ever harder to come by. That has been on prominent display during the December delivery month so far as well.
New silver has to be brought in from other sources [JPMorgan] to meet the ongoing demand for physical metal. This will continue until available supplies are depleted...which will be the moment that JPMorgan & Friends stop providing silver to feed this deepening structural deficit, now coming up on its fifth year.
The vast majority of precious metals being held in these depositories are by those who won't be selling until the silver price is many multiples of what it is today.
Sprott's PSLV is the third largest depository of silver on Planet Earth with 180.3 million troy ounces...unchanged for the last little while --and some distance behind the COMEX, where there are 306.7 million troy ounces being held...down 1.3 million troy ounces on the week...but minus the 103 million troy ounces being held in trust for SLV by JPMorgan.
That 103 million ounce amount brings JPMorgan's actual silver warehouse stocks down to around the 31.4 million troy ounce mark...quite a bit different than the 134.40 million they indicate they have...unchanged for the last month.
But PSLV is a long way behind SLV, as they are the largest silver depository, with 473.7 million troy ounces as of Friday's close...up about 800,000 troy ounces on the week.
As touched on a few paragraphs ago, the latest short report from ten days ago showed that the short position in SLV blew out by 42.18%...from 22.01 million shares sold short in the prior short report...up to 31.29 million shares in this latest report. This is back into grotesque territory -- and I'm sure that Ted would not be amused.
BlackRock issued a warning several years ago to all those short SLV, that there might come a time when there wouldn't be enough metal for them to cover. That would only be true if JPMorgan decides not to supply it to whatever entity requires it...which is most certainly a U.S. bullion bank, or perhaps more than one.
The next short report will be posted on The Wall Street Journal's website on Tuesday evening, December 10.
Then there's that other little matter of the 1-billion ounce short position in silver held by Bank of America in the OTC market...with JPMorgan & Friends on the long side. Ted said it hadn't gone away -- and he'd also come to the conclusion that they're short around 25 million ounces of gold with these same parties as well.
The latest report for the end of Q2/2024 from the OCC came out about two months ago now -- and after carefully scrutiny, I noted that the dollar value of their derivative positions were up just under 20 percent...but suspect that it was entirely due to the price increases in both since the prior report came out.
![]()
The Commitment of Traders Report, for positions held a the close of COMEX trading on Tuesday, showed a smallish increase in the Commercial net short position in silver, but rather large one in gold.
In silver, the Commercial net short position rose by 861 COMEX contracts, or 4.350 million troy ounces of the stuff. However, the bad news was that the Big 4/8 commercial traders piled further on the short side, which I'll get into in a bit.
They arrived at that number by reducing their long position by 412 contracts -- and also sold 449 short contracts. It's the sum of those two numbers that represents their change for the reporting week.
With only a small change in the headline number in the above legacy COT Report, the changes under the hood in the Disaggregated COT Report weren't overly large, either. The Managed Money traders increased their net long position by 1,227 COMEX contracts...which they accomplished by adding 610 long contracts -- and also bought back 617 short contracts.
The traders in the Nonreportable/small trader category were also net buyers, increasing their net long position by 384 COMEX contracts. This meant that the traders in the Other Reportables category had to have been net sellers -- and they were...reducing their net long position by 750 contracts.
Doing the math: 1,227 plus 384 minus 750 equals 861 COMEX contracts, the change in the Commercial net short position.
The Commercial net short position in silver now stands at 62,019 COMEX contracts/310.095 million troy ounces...up those 861 contracts from the 61,158 COMEX contracts/305.790 million troy ounces they were short in Monday's COT Report.
The Big 4 shorts increased their net short position by a hefty 1,959 contracts...up to 50,680 contracts during the reporting week...from the 48,721 contracts they were short in Monday's COT Report...which is obviously still very bearish. But this is their smallest net short position since May 17...when they were net short 50,897 COMEX contracts.
The Big '5 through 8' shorts also increased their net short position, them by 1,680 contracts...from the 16,151 contracts in Monday's COT Report, up to 17,831 contracts in yesterday's COT Report. That's about 5,000 contracts more than they 'normally' hold short...which is still a bit on the bearish side, but vastly improved from the 27,727 contracts they were short earlier in the year.
The Big 8 commercial shorts in total increased their overall net short position from 64,872 contracts, up to 68,511 COMEX contracts week-over-week...an increased of 68,511-64,872=3,639 COMEX contracts.
But since the Commercial net short position rose by only 861 contracts in yesterday's COT Report -- and the Big 8 increased their short position by 3,639 contracts, this meant that Ted's raptors...the small commercial traders other than the Big 8...had to have been buyers -- and they were...increasing their net long position by 3,639-861=2,778 COMEX contracts.
That increased their net long position from 3,714 COMEX contracts, up to 6,492 contracts.
Here's Nick's 9-year COT chart for silver. Click to enlarge.
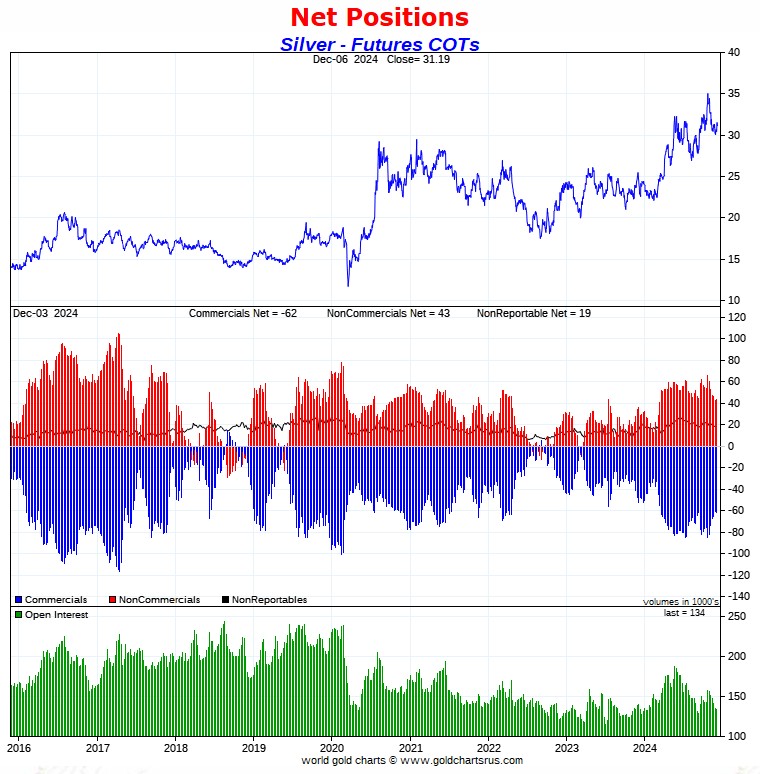
For the second week in a row Ted's raptors, the small commercial traders other than the Big 8, were aggressive buyers...so aggressive in fact that their partners-in-crime in the Big 8 category were forced to go short against them to prevent the silver price from exploding higher.
During the last two weeks these raptors have added 5,592 long contracts... contracts that the Big 8 would have dearly loved to have purchased themselves...but these small commercial traders are much faster/quicker than the traders in the Big 8 category -- and the reason that Ted called them raptors.
At the moment, the Big 8 collusive commercial shorts are net short 51.1 percent of the entire open interest in silver...up from the 48.2 percent they were short in Monday's COT Report.
And with the Managed Money traders now net long 24,332 contracts, I still consider the set-up in silver very bearish from a COMEX futures market perspective...but vastly improved from what it was six months ago.
That doesn't mean that the silver price can't rise from here, as it certainly can...but that will only happen if it's allowed -- and it obviously wasn't again on Friday...as the Big 8 continue to go short against all comers.
However, nothing has changed in regards to that ongoing and deepening structural deficit in the physical market. The price action this past week indicated that silver wants to rise to reflect that, but it's not being allowed at the moment.
![]()
In gold, the commercial net short position rose by a further 13,755 COMEX contracts, or 1.376 million troy ounces of the stuff.
They arrived at that number by reducing their long position by 9,126 contracts -- and also sold 4,629 short contracts. It's the sum of those two numbers that represents their change for the reporting week.
Under the hood in the Disaggregated COT Report, all three categories were buyers. The Managed Money traders by the least, increasing their net long position by only 1,445 COMEX contracts. That meant that the traders in the Other Reportables and Nonreportable/small traders category had to have been the big buyers during the reporting week -- and there were, as the former increased their net long position by 7,953 contracts -- and the latter by 4,357 COMEX contracts.
Doing the math: 1,445 plus 7,953 plus 4,357 equals 13,755 COMEX contracts, the change in the commercial net short position.
The commercial net short position in gold now sits at 286,275 contracts/ 28.628 million troy ounces of the stuff...up those 13,755 contracts from the 272,520 contracts/27.252 million troy ounces they were short in Monday's COT Report -- and obviously even more bearish that it was in Monday's COT Report.
The Big 4 shorts in gold increased their net short position by a further 13,124 contracts...from 176,774 contracts they were short in Monday's report, up to 189,898 contracts in yesterday's report -- and obviously wildly bearish.
The Big '5 through 8' shorts also increased their net short position during the reporting week, them by 6,023 contracts...from the 60,973 contracts they were short in Monday COT Report, up to 66,996 contracts held short in the current COT Report.
The Big 8 short position in total increased from 237,747 contracts/23.775 million troy ounces in Monday's COT Report...up to 256,894 COMEX contracts/ 25.689 million troy ounces in yesterday's...an increase of 19,147 COMEX contracts -- and still hugely bearish.
But since the commercial net short position rose by only 13,755 COMEX contracts during the reporting week -- and the Big 8 commercial short position rose by 19,147 COMEX contracts, that meant that Ted's raptors...the small commercial traders other than the Big 8...were buyers during the reporting week just past. They decreased their grotesque short position by 19,147-13,755=5,392 COMEX contracts. Their short position is now down to 29,381 contracts...down from the 34,773 contracts they were short in Monday's COT Report.
But despite this improvement, I cannot overemphasize just how grotesque their short position is on an historical basis.
Here's Nick Laird's 9-year COT Report chart for gold...updated with the above data. Click to enlarge.
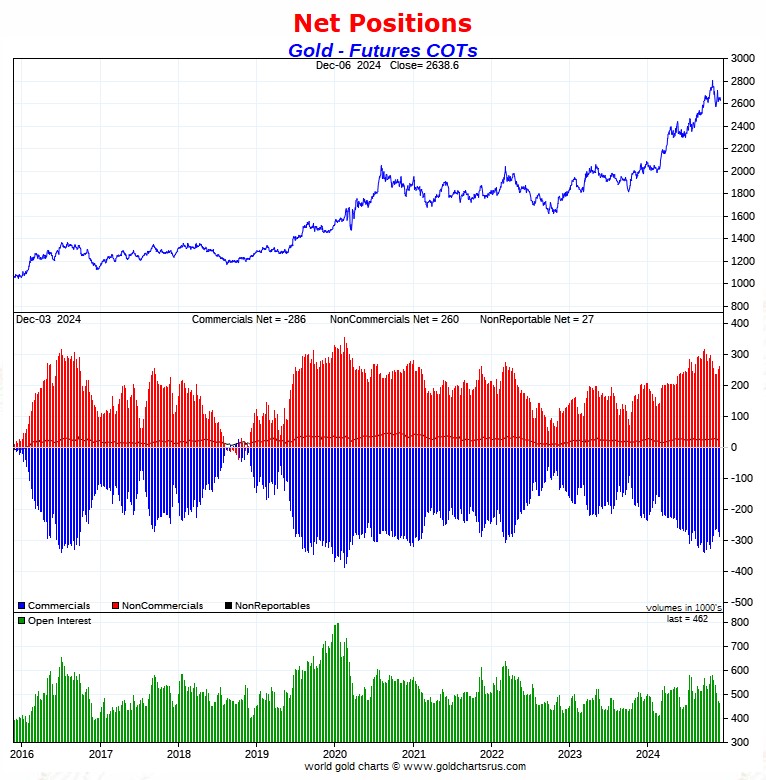
Well, it was all up to the Big 8 collusive commercial shorts in gold this week. Not only did they have to go short against all the long-buying by the Managed Money traders, et al...but also against the aggressive long-buying by the small commercial traders as well.
The short position held by the Big 8 is back to where it was around the end of October.
But from a total commercial net short position perspective, back on October 20, 2023...the commercial net short position in gold was only 128,000 contracts. In yesterday's report it was 286,275 contracts...well over double that amount.
The reason for that huge disparity...besides the 65,000 contracts more short the Big 8 are at the moment...Ted's raptors were net long 68,933 contracts in gold back on that date...vs. being net short 29,381 contracts in yesterday's COT Report. That's a 98,314 contract swing...9.831 million paper ounces of gold.
How low would these collusive commercial traders have to engineer the gold price to cover all these shorts mentioned in the previous paragraph, you ask? Well below its 200-day moving average -- and it just ain't going to happen.
Total gold open interest fell by a further 10,620 COMEX contracts during the reporting week just past...with all of that amount, plus a bit more, being those uneconomic and market-neutral spread trades being removed as the roll out of December ended...mostly by the traders in the Swap Dealers and Other Reportables category.
The Big 8 collusive commercial traders are short 55.6 percent of total open interest in the COMEX futures market...up from the 50.3 percent they were short in Monday's COT Report -- and that was partly due to that drop in total open interest mentioned in the previous paragraph.
But once you add in the 29,381 contracts currently held short by Ted's raptors, the commercial net short position in gold works out to 62.0 percent of total open interest, up from the 57.7 percent they were short in the prior COT Report....which is grotesque and obscene beyond description.
Can gold rally from here? Of course. But as I said about silver's rally potential ...it will only come about if the big commercial shorts allow it and, also like it silver, that wasn't allowed again yesterday, either.
![]()
In the other metals, the Managed Money traders in palladium decreased their net short position by a further 527 COMEX contracts -- and are now net short palladium by 7,160 contracts. The only other category that's net short palladium at the moment are the Producer/Merchants in the commercial category -- and them, not by much. The Swap Dealers are mega net long.
In platinum, the Managed Money traders increased their net long position by 584 COMEX contracts during the reporting week -- and are net long platinum by 7,552 COMEX contracts. The commercial traders in the Producer/Merchant category are mega net short a knee-wobbling 30,819 COMEX contracts -- and the Swap Dealers in the commercial category are net long platinum by 2,101 contracts. The traders in both the Other Reportables and Nonreportable/ small traders categories remain net long platinum by very hefty amounts... especially the trades in the Other Reportables category.
It's mostly the world's banks in the Producer/Merchant category that are 'The Big Shorts' in platinum in the COMEX futures market, as per yesterday's Bank Participation Report...which I'll get into in a bit.
In copper, the Managed Money traders increased their their net long position by 2,468 COMEX contracts -- and remain net long copper by 9,219 COMEX contracts...about 292 million pounds of the stuff as of yesterday's COT Report ...up from the 230 million pounds they were net long copper in Monday's COT report.
Copper, like platinum, continues to be a wildly bifurcated market in the commercial category. The Producer/Merchant category is net short 40,052 copper contracts/1.001 billion pounds -- while the Swap Dealers are net long 25,269 COMEX contracts/631 million pounds of the stuff.
Whether this means anything or not, will only be known in the fullness of time. Ted said it didn't mean anything as far as he was concerned, as they're all commercial traders in the commercial category. However, this bifurcation has been in place for as many years as I can remember -- and that's a lot.
In this vital industrial commodity, the world's banks...both U.S. and foreign... are net long 8.9 percent of the total open interest in copper in the COMEX futures market as shown in the December Bank Participation Report that came out yesterday...down a hair from the 9.0 percent they were net long in November's Bank Participation Report.
At the moment it's the commodity trading houses such as Glencore and Trafigura et al., along with some hedge funds, that are net short copper in the Producer/Merchant category, as the Swap Dealers are net long, as pointed out above.
The next Bank Participation Report is due out on Friday, January 10, 2025.
![]()
Here’s Nick Laird’s “Days to Cover” chart, updated with the COT data for positions held at the close of COMEX trading on Tuesday, December 3. It shows the days of world production that it would take to cover the short positions of the Big 4 — and Big '5 through 8' traders in every physically traded commodity on the COMEX. Click to enlarge.
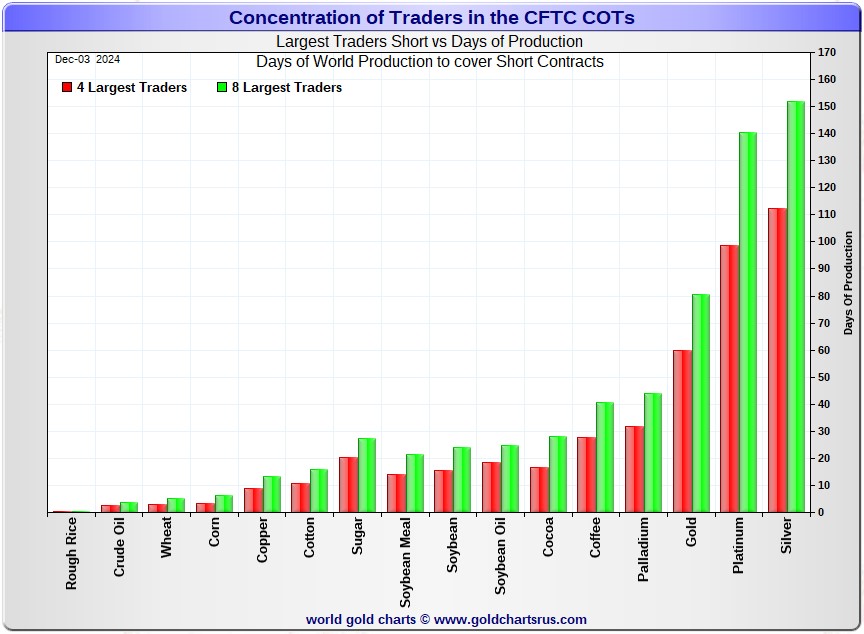
In this week's data, the Big 4 traders are short 112 days of world silver production...up about 4 days from Monday's COT report. The ‘5 through 8’ large traders are short 40 days of world silver production...also up 4 days from last Friday's COT Report, for a total of about 152 days that the Big 8 are short -- and obviously up about 8 days from Monday's report.
Those 152 days that the Big 8 traders are short, represents about 5.1 months of world silver production, or 342.555 million troy ounces/68,511 COMEX contracts of paper silver held short by these eight commercial traders. Several of the largest of these are now non-banking entities, as per Ted's discovery a year or so ago. December's Bank Participation Report continues to confirm that this is still the case -- and not just in silver, either.
The small commercial traders other than the Big 8 shorts, Ted's raptors, are now net long silver by 6,492 COMEX contracts...up from the 3,714 contract they were net long in Monday's COT Report.
In gold, the Big 4 are short about 60 days of world gold production...up another 4 days from Monday's COT Report. The '5 through 8' are short an additional 21 days of world production, up about 2 days from last week...for a total of 81 days of world gold production held short by the Big 8 -- and up 6 days from Monday's COT Report.
The Big 8 commercial traders are short 51.1 percent of the entire open interest in silver in the COMEX futures market as of yesterday's COT Report, up from the 48.2 percent they were short in Monday's COT Report.
In gold, it's 55.6 percent of the total COMEX open interest that the Big 8 are short, up from the 50.3 percent they were short in Monday's COT Report -- but 62.0 percent of total open interest once you add in what Ted's raptors [the small commercial traders other than the Big 8] are short on top of that...a further 29,381 COMEX contracts. The reason that those percentage numbers rose week over week is partly because of the further 10,620 contract drop in total open interest, which obviously affects the percentage calculation.
And it should be carefully noted on the Days to Cover chart above, that 'da boyz' No. 2 problem child...platinum...has almost as large a Big 8 short position now, as silver does, in days of world production terms.
Ted was of the opinion that Bank of America is short about one billion ounces of silver in the OTC market, courtesy of JPMorgan & Friends. He was also of the opinion that they're short 25 million ounces of gold as well. And with the latest report [for Q2/2024] from the OCC now in hand, I see that their positions are up 20 percent from what they were holding at the end of Q1/2024...with most of that increase most likely being price related. One wonders just how much more BofA stock that Mr. Buffet is going to dump.
The short position in SLV now sits at 31.29 million shares as of last short report that came out about ten days ago...up a whopping 42.18% from the 22.01 million shares sold short in the prior report. Back in early August, the short position in SLV shares was only 13.14 million shares...so the short position in SLV has more than doubled since then.
It's obvious that some entities/authorized participants are shorting SLV shares in lieu of depositing physical metal, as it's just not available...or if it is, it's not at a price that these authorized participants aren't prepared to pay, as doing so would drive its price to the moon.
The next short report is due out this coming Tuesday, December 10.
The situation regarding the Big 4/8 commercial short positions in silver and gold deteriorated noticeably during the last reporting week -- and for the second week in a row in gold. Gold remains wildly bearish from a COMEX futures market perspective -- and market neutral at best in silver, with even that rating being a bit of a stretch.
As Ted had been pointing out ad nauseam, the resolution of the Big 4/8 short positions will be the sole determinant of precious metal prices going forward -- although the short positions held by Ted's raptors in gold continues to be a big factor as well.
![]()
The December Bank Participation Report [BPR] data is extracted directly from yesterday's Commitment of Traders Report data. It shows the number of futures contracts, both long and short, that are held by all the U.S. and non-U.S. banks as of this past Tuesday’s cut-off in all COMEX-traded products.
For this one day a month we get to see what the world’s banks have been up to in the precious metals. They’re usually up to quite a bit -- and they certainly were again this past month.
[The December Bank Participation Report covers the four-week time period from November 5 to December 3 inclusive]
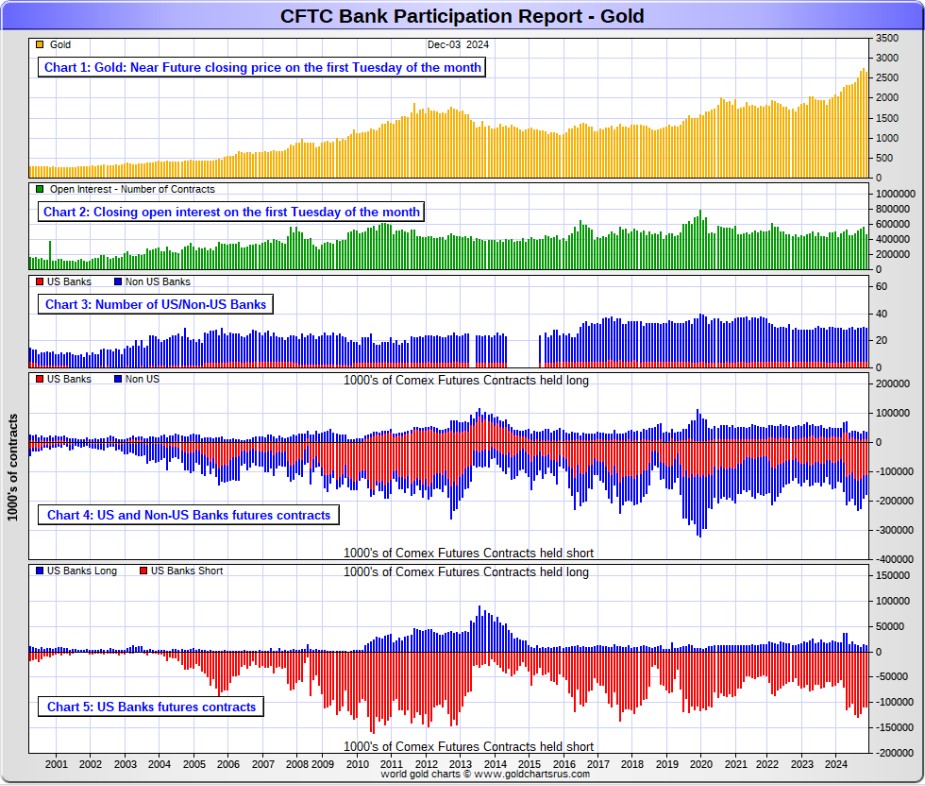
In gold, 5 U.S. banks are net short 97,848 COMEX contracts, up 3,748 contracts from the 94,100 contracts that these same 5 U.S. banks were net short in November's BPR.
Also in gold, 24 non-U.S. banks are net short 45,783 COMEX contracts, down a further 9,816 contracts from the 55,599 contracts that 25 non-U.S. banks were short in November's BPR...the lowest they've been since February of this year...which isn't saying a lot.
At the low back in the August 2018 BPR...these non-U.S. banks held a net short position in gold of only 1,960 contacts -- so they've been back on the short side in an enormous way ever since.
Although some of the largest U.S. and foreign bullion banks are in the Big 8 short category in gold, some of the hedge fund/commodity trading houses are short even more grotesque amounts of gold than the banks in that category.
It's also a strong possibility that the BIS could be short gold in the COMEX futures market as well.
As of December's Bank Participation Report, 29 banks [both U.S. and foreign] are net short 31.1 percent of the entire open interest in gold in the COMEX futures market...up from the 26.8 percent that 30 banks were net short in the November BPR. The reason it's up and not down, is because of the huge implosion in open interest on the roll out of December, which greatly affects the percentage calculation.
Here’s Nick’s BPR chart for gold going back to 2000. Charts #4 and #5 are the key ones here. Note the blow-out in the short positions of the non-U.S. banks [the blue bars in chart #4] when Scotiabank’s COMEX short position was outed by the CFTC in October of 2012. Click to enlarge.
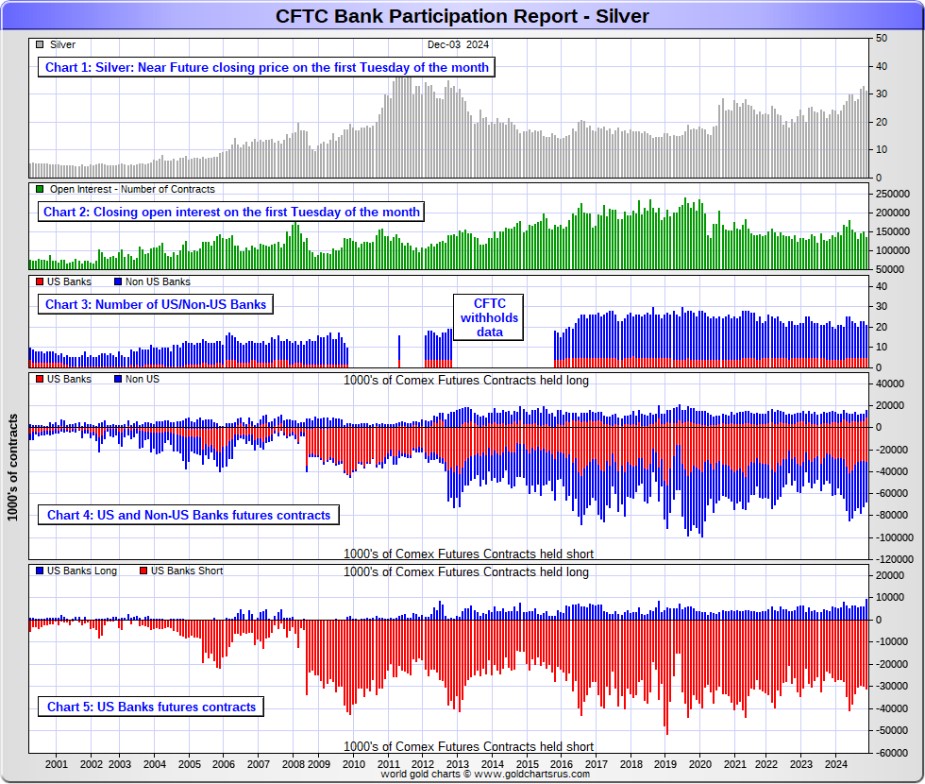
In silver, 5 U.S. banks are net short 21,384 COMEX contracts, down 2,282 contracts from the 23,666 contracts that these same 5 U.S. banks were short in the November BPR. This is the smallest short position they've held since the April BPR.
The biggest short holders in silver of the five U.S. banks in total, would be Citigroup, Wells Fargo, Bank of America -- and maybe JPMorgan from time to time.
Also in silver, 16 non-U.S. banks are net short 29,988 COMEX contracts, down a further 5,988 contracts from the 35,976 contracts that that 18 non-U.S. banks were short in the November BPR...their lowest short position since the April BPR as well.
I would suspect that HSBC, Barclays and Standard Chartered hold by far the lion's share of the short position of these non-U.S. banks...as do some of Canada's banks as well...with the Bank of Montreal and Scotia Capital/ Scotiabank coming to mind.
And, like in gold, the BIS could also be actively shorting silver. The remaining short positions divided up between the other 12 or so non-U.S. banks are immaterial — and have always been so. The same can be said of most of the 24 non-U.S. banks in gold as well.
As of December's Bank Participation Report, 21 banks [both U.S. and foreign] were net short 38.4 percent of the entire open interest in silver in the COMEX futures market...which is still outrageous — but down from the 39.5 percent that 23 banks were net short in the November BPR.
Here’s the BPR chart for silver. Note in Chart #4 the blow-out in the non-U.S. bank short position [blue bars] in October of 2012 when Scotiabank was brought in from the cold. Also note August 2008 when JPMorgan took over the silver short position of Bear Stearns—the red bars. It’s very noticeable in Chart #4—and really stands out like the proverbial sore thumb it is in chart #5. Click to enlarge.
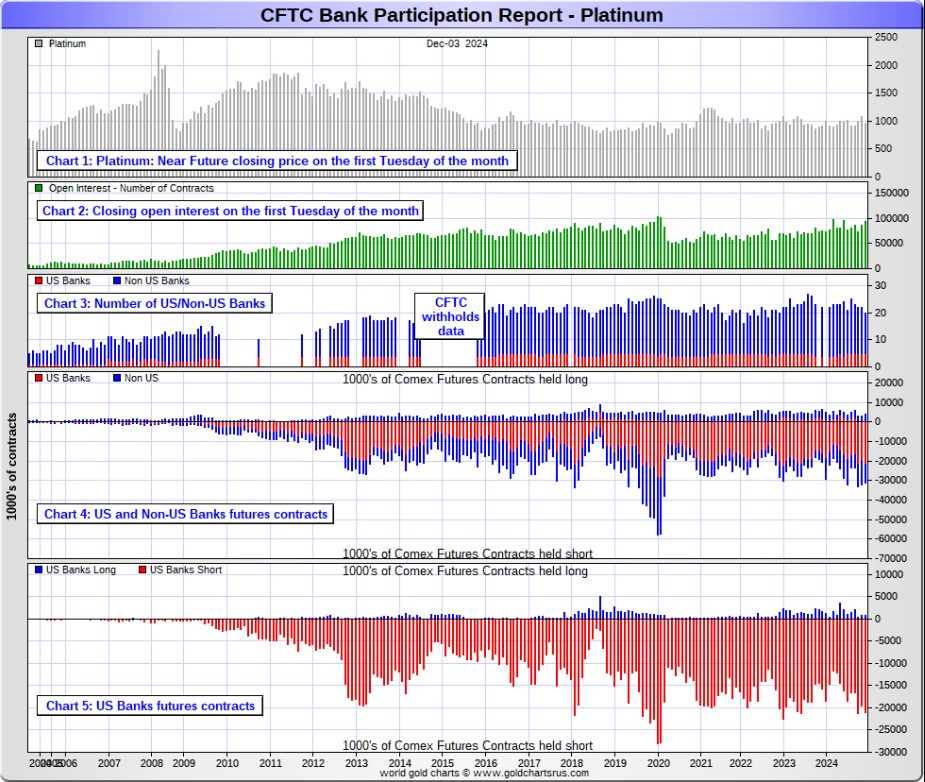
In platinum, 5 U.S. banks are net short 20,300 COMEX contracts in the December BPR, up 1,547 contracts from the 18,753 contracts that these same 5 U.S. banks were short in the November BPR -- and their second largest short position on record.
At the 'low' back in September of 2018, these U.S. banks were actually net long the platinum market by 2,573 contracts. So they have a very long way to go just to get back to market neutral in platinum...if they ever intend to, that is. They look permanently stuck on the short side to me, a fact that I point out regularly.
Also in platinum, 15 non-U.S. banks decreased their net short position by 3,545 contracts...down to 6,779 contracts, from the 10,324 contracts that 17 non-U.S. banks were net short in the November BPR.
Back in the December 2023 BPR, these non-U.S. banks were net short a microscopic 35 platinum contracts...so they've got more work to do if they ever want to get back to that number.
As you already know, platinum remains the big commercial shorts No. 2 problem child after silver. How it will ultimately be resolved is unknown, but most likely in a paper short squeeze, as the known stocks of platinum are minuscule compared to the size of the short positions held -- and that's just the short positions of the world's banks I'm talking about here.
Of course there's now a structural deficit in it [and palladium] as well.
And as of December's Bank Participation Report, 20 banks [both U.S. and foreign] were net short 28.6 percent of platinum's total open interest in the COMEX futures market, down from the 34.0 percent that 22 banks were net short in November's BPR.
Here's the Bank Participation Report chart for platinum. Click to enlarge.
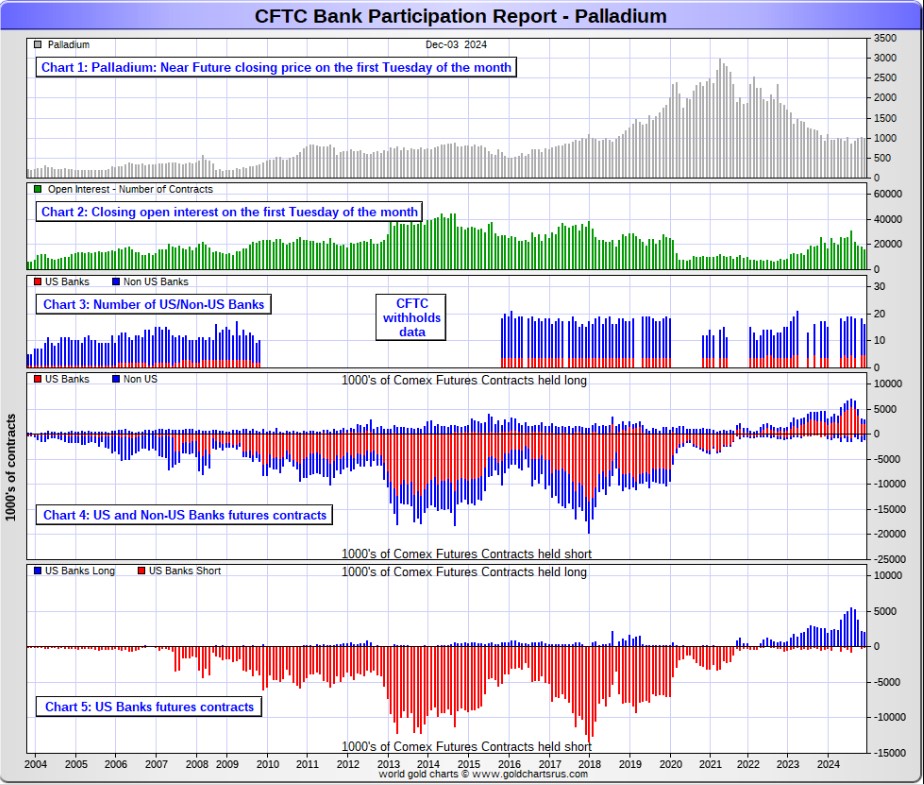
In palladium, 5 U.S. banks are net long 1,951 COMEX contracts in the December BPR, up a tiny 72 contracts from the 1,879 contracts that that these same 5 U.S. banks were net long in the November BPR.
Also in palladium, 11 non-U.S. banks are net long 150 COMEX contracts, down from the 456 contracts that 13 non-U.S. banks were net long in the November BPR.
And as I've been commenting on for almost forever, the COMEX futures market in palladium is a market in name only, because it's so illiquid and thinly-traded. Its total open interest in yesterday's COT Report was only 15,655 contracts...compared to 94,662 contracts of total open interest in platinum...134,074 contracts in silver -- and 462,040 COMEX contracts in gold.
But I should point out that open interest in palladium has increased quite a bit over the last few years, because I remember when it was less than 9,000 contracts. So it's nowhere near as illiquid as it used to be -- and it's also been helped along by the fact that the bid/ask is now only 40 bucks. It used to be $150 at one point way back when.
As I say in this spot every month, the only reason that there's a futures market at all in palladium, is so that the Big 8 commercial traders can control its price. That's all there is, there ain't no more.
As of this Bank Participation Report, 16 banks [both U.S. and foreign] are net long 11.5 percent of total open interest in palladium in the COMEX futures market...up from the 7.8 percent of total open interest that 18 banks were net long in the November BPR.
For the last 4 years or so, the world's banks have not been involved in the palladium market in a material way...see its chart below. And with them still net long, it's all hedge funds and commodity trading houses that are left on the short side. The Big 8 commercial shorts, none of which are banks, are short 51.7 percent of total open interest in palladium as of yesterday's COT/BPR Report...up about 11 percentage points month-over-month.
Here’s the palladium BPR chart. Although the world's banks are net long at the moment, it remains to be seen if they return as big short sellers again at some point like they've done in the past. Click to enlarge.
Excluding palladium for obvious reasons, and almost all of the non-U.S. banks in gold, silver and platinum...only a small handful of the world's banks, most likely no more than 5 or so in total -- and mostly U.S. and U.K.-based...along with [maybe] the BIS...continue to hold meaningful short positions in the other three precious metals.
As I pointed out above, some of the world's commodity trading houses and hedge funds are also mega net short the four precious metals...far more short than the U.S. banks in some cases. They have the ability to affect prices if they choose to exercise it...which I'm sure they're doing at times -- and this is particularly obvious in the thinly-traded and illiquid palladium market. But it's still the collusive bullion banks in the commercial category that are at Ground Zero of the price management scheme in the other three.
And as has been the case for years now, the short positions held by the Big 4/8 traders is the only thing that matters...especially the short positions of the Big 4...or maybe only the Big 1 or 2 in both silver and gold. How this is ultimately resolved [as Ted kept pointing out] will be the sole determinant of precious metal prices going forward.
The Big 8 commercial traders continue to have an iron grip on their respective prices -- and it will remain that way until they either relinquish control voluntarily, are told to step aside...or get overrun.
Considering the current state of affairs of the world as they stand today -- and the structural deficit in silver -- and now in platinum and palladium as well, the chance that these big bullion banks and commodity trading houses could get overrun at some point, is no longer zero -- and certainly within the realm of possibility if things go totally non-linear, as they just might.
But...as Ted kept reminding us from time to time...if they do finally get overrun, it will be for the very first time...which obviously wasn't allowed to happen this past week, either.
The next Bank Participation Report is due out on Friday, January 10, 2025.
I have a fairly decent number of stories, articles and videos for you today.
![]()
CRITICAL READS
Payrolls increased 227,000 in November, more than expected; unemployment rate at 4.2%
Job creation in November rebounded from a near-standstill the prior month as the effects of a significant labor strike and violent storms in the Southeast receded, the Bureau of Labor Statistics reported Friday.
Non-farm payrolls increased by 227,000 for the month, compared with an upwardly revised 36,000 in October and the Dow Jones consensus estimate for 214,000. September’s payroll count also was revised upward, to 255,000, up 32,000 from the prior estimate. October’s number was held back by impacts from Hurricane Milton and the Boeing strike.
The unemployment rate edged higher to 4.2%, as expected. The jobless figure rose as the labor force participation rate nudged lower and the labor force itself declined. A broader measure that includes discouraged workers and those holding part-time jobs for economic reasons moved slightly higher to 7.8%.
The data likely gives the Federal Reserve a green light to lower interest rates later this month.
“The economy continues to produce a healthy amount of job and income gains, but a further increase in the unemployment rate tempers some of the shine in the labor market and gives the Fed what it needs to cut rates in December,” said Ellen Zentner, chief economic strategist at Morgan Stanley Wealth Management.
This news story was posted on the cbnc.com Internet site at 8:30 a.m. on Friday morning EST -- and I thank Swedish reader Patrik Ekdahl for sharing it with. Another link to it is here. The Zero Hedge spin on this is headlined "November Jobs Surge Above Estimates As Wage Growth Comes in Hot, Unemployment Rises" -- and linked here.
![]()
In "Last Hurrah", Credit Card Debt Explodes Higher Despite Record High APRs as Savings Rate Craters
One month ago, when multiple discount retailers (here and here) were lamenting the sudden collapse in U.S. consumer purchasing power, we highlighted the reason this unexpected hit to U.S. consumption: as the U.S. personal savings rate had collapsed, the growth in consumer credit was slowing, and in last month, the Fed reported that credit card debt growth posted its first decline since the covid crash.
But fast forwarding just one month later, when in a striking reversal, October consumer credit growth unexpectedly reversed the dramatic September slowdown, and soared more than $19 billion, to a new record high of $5.084 trillion. Click to enlarge.
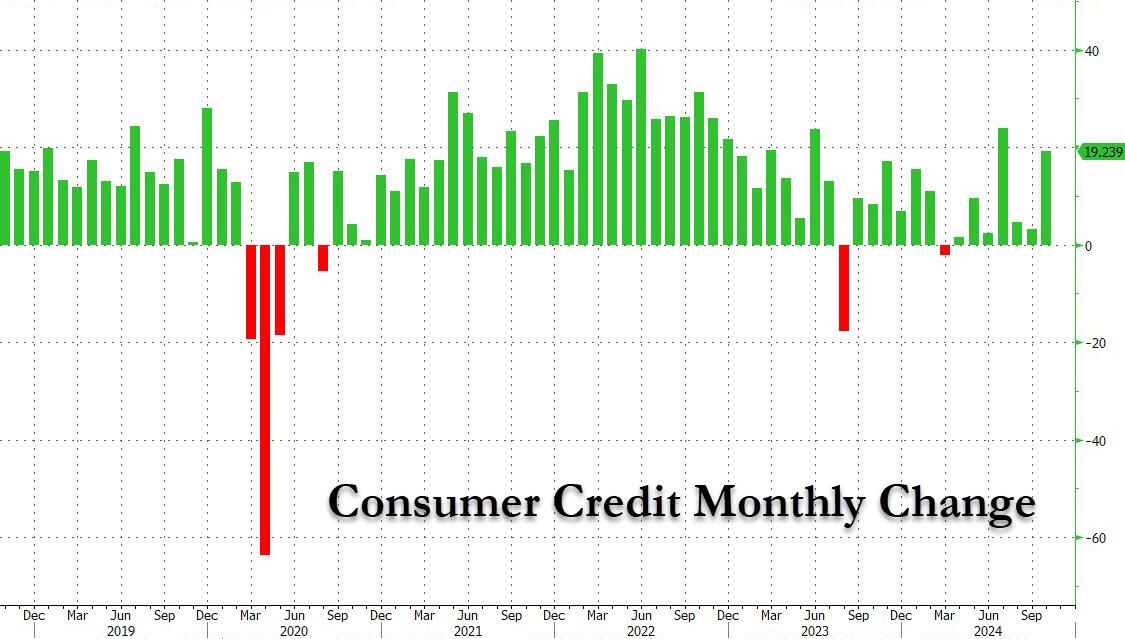
And while non-revolving credit - which is far less volatile and much more predictable - grew $3.5 billion, a bounce from last month's tiny $1.54 billion but a far cry from the $10+ billion average in the post-covid era...
... the highlight was that the much more consumer-outlook sensitive revolving credit (i.e. credit card debt) exploded, and in October surged the most since the covid crash and was - amazingly - the third biggest monthly increase on record!
[W]e remind readers of what we said last month namely that "we can stop pretending that the government's recent fabrication of savings data, which was upwardly "revised" from a record low 2.9% to a nice and balmy 4.8%, is even remotely credible." Sure enough, just a few days later we showed that - with the election now over - the Biden Department of Commerce dramatically revised said data, and over $140 billion in "savings" were magically erased.
This collapse in savings explains why most U.S. consumers are not only living paycheck to paycheck, but have maxed out both their Buy Now, Pay Later accounts and, as we now learn, their credit cards too as everyone braces for the moment when the U.S. economy suddenly grinds to a halt and collapses under the weight of its own debt.
This 5-chart Zero Hedge story was posted on their Internet site at 7:15 p.m. on Friday evening EST -- and another link to it is here.
![]()
The Commercial Mortgage Crisis Deepens
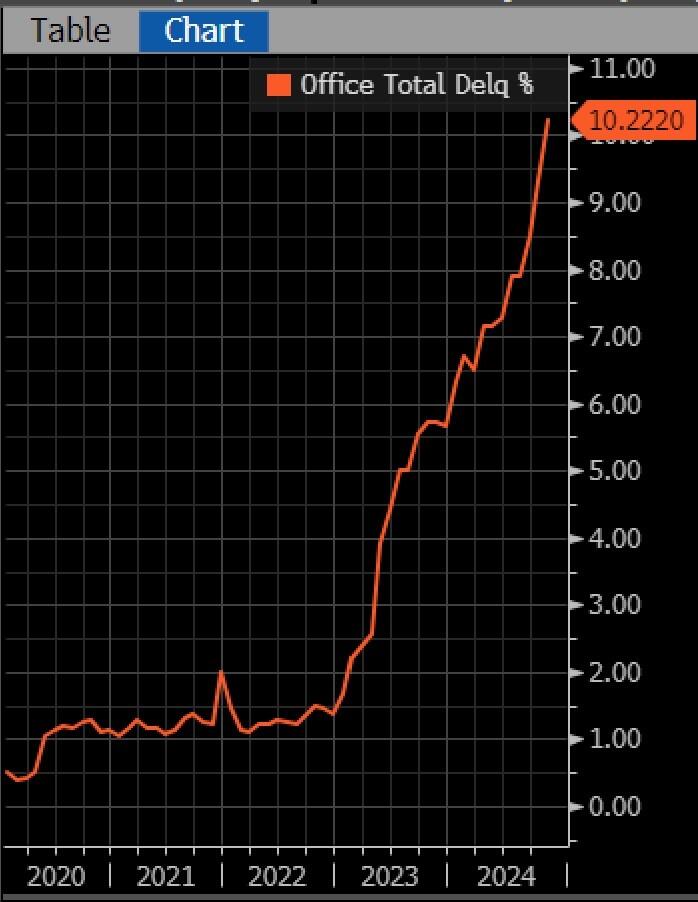
The delinquency rate for commercial mortgage-backed securities (CMBS) tied to office properties reached 10.4 percent in November 2024, approaching the 10.7 percent peak reached during the 2008 financial crisis. The ascent is the fastest two-year increase on record, with rates climbing 8.8 percentage points since late 2022, significantly outrunning the 6.3-point rise seen during the financial crisis nearly 15 years ago.
The office real estate sector has been grappling with a severe downturn for several years now, but are accelerating recently as they are driven by persistently high vacancy rates and declining rents. Property values, particularly for older office buildings, have plummeted, with many losing 50 to 70 percent of their market value and in some cases becoming effectively worthless. Those conditions have left real estate portfolio managers and building owners unable to borrow, refinance or sell properties, contributing to rising delinquencies and foreclosures. (Mortgages become effectively delinquent when payments are missed beyond a standard 30-day grace period.)
The financial risks associated with office mortgage losses are widely dispersed among global investors, thus diminishing the potential threat to the U.S. banking system. Office mortgages are held by a vast array of investors, including CMBS and CRE-CLO investors, insurance firms, Real Estate Investment Trusts (REITs), private equity firms, and international financial institutions. While U.S. banks have some exposure and have already recognized significant losses, no major collapses have occurred. Smaller banks with geographically and/or commercially concentrated mortgage portfolios remain at heightened risk, and escalating stress could precipitate systemic consequences.
The commercial real estate market’s troubles are not a temporary phenomenon but a structural crisis rooted in monetary policy-induced overbuilding, regulatory barriers, and a permanent shift in work patterns vastly accelerated by pandemic lock-downs. Vulture investors have emerged, but sparingly. The sector faces profound challenges which will unfold both against and in response to the forward trajectory of monetary policy, the consequent shape of the U.S. Treasury yield curve, and broad macroeconomic developments. Hopefully the stage is not being set for the next in an increasingly annualized procession of crises.
This not-at-all surprising article from the American Institute for Economic Research was picked up by Zero Hedge yesterday -- and posted on their website at 3:40 p.m. EST. Another link to it is here.
![]()
Disorder Metastasis -- Doug Noland
“Stocks Extend Record-Breaking Run After Jobs Data.” “Investors Pour $140bn into US Stock Funds After Trump Election Victory.” “Cash Draws Biggest Weekly Inflow Since March 2023, BofA Says.” “Market Frenzy Fuels $1 Trillion ETF Rush to Break Annual Records.” “Jane Street Reaps $14.2 Billion in First Nine Months of Trading.”
“France Plunges Deeper Into Crisis After Macron’s Premier Ousted.” “After Trying to Impose Martial Law, South Korea’s President Faces an Impeachment Vote.” “Syrian Rebels Close in on Homs as Russia Tells its Citizens to Leave Country.” “China Urges its Citizens to Leave Syria 'As Soon as Possible' as Fighting Rages.”
Another week’s developments confirm Disorder Metastasis has attained critical momentum – monetary, speculative Bubble, political and geopolitical.
As noted in the above Reuters article, last week’s MMFA expansion was the largest since the March 2023 banking crisis – the week ended March 15th to be exact. That bout of MMFA ballooning was associated with major liquidity injections from the Fed and FHLB. Instead of Fed and GSE balance sheet leveraging, this year’s incredible MMFA expansion correlates to an extraordinary expansion of speculative leverage. It’s worth noting that 78% ($74.5bn) of last week’s expansion – and 75% ($474bn) of the 18-week surge – are explained by growth in institutional money funds (as opposed to retail). I believe these flows have been greatly impacted by repo market “basis trade” leveraging and securities finance more generally (intermediated through institutional funds).
Leveraged speculation accelerated last year after the Fed signaled the end to rate increases, only to intensify when the Fed communicated imminent rate cuts. Things then went haywire heading into the election and following the decisive Trump win and Republican sweep. Importantly, the boom in speculative leverage and attendant liquidity abundance has been a global phenomenon.
Doug's weekly market commentary is always worth reading in my opinion -- and this one showed up on his website around midnight PST last night. Another link to it is here.
![]()
There is something so sweetly innocent... so endearingly naïve... about a revolution — even a fake one. Trying to Make America Great Again, for example.
The thrill of a new start... a new direction... another chance to build a better world. The exhilaration of calling each other ‘citoyen’... or comrade... of holding mass rallies, giving the prescribed salute or waving copies of Mao’s Little Red Book. It’s like losing your virginity or discovering online sports betting; it opens up a world of pleasant possibilities.
We recall the Grace Commission, in which Ronald Reagan asked businessman Peter Grace to “drain the swamp... be bold. We want your team to work like tireless bloodhounds. Don’t leave any stone unturned in your search to root out inefficiency.”
The results of the study came out in 47 volumes, in 1984, concluding:
With two thirds of everyone's personal income taxes wasted or not collected, 100 percent of what is collected is absorbed solely by interest on the federal debt and by federal government contributions to transfer payments. In other words, all individual income tax revenues are gone before one nickel is spent on the services that taxpayers expect from their government.
But hope springs up from time to time... and now, even our friend David Stockman is staying up late... working out the details. Well after midnight... his candle flickering... he labors over the obese body of U.S. spending. He’s already found $400 billion in ‘fat’ that could be readily lipo-sucked from the U.S. budget. Now, he’s got his scalpel into the muscle of the Empire — the military, industrial, surveillance, full spectrum dominance complex.
This interesting and worthwhile commentary from Bill showed up on his website at 10:35 a.m. EST on Friday morning -- and I thank Roy Stephens for sending it our way. Another link to it is here. Gregory Mannarino's post market close rant for Friday is linked here -- and this one only lasts for 17 minutes.
![]()
Intelligence Round Table with former CIA analysts Larry Johnson and Ray McGovern
This 31-minute video interview was hosted by Judge Andrew Napolitano late on Friday afternoon EDT -- and it's certainly worth your while if you have the interest. It comes to us courtesy of Guido Tricot as always -- and another link to it is here.
![]()
Defusing Biden’s Time Bomb -- Jim Rickards
Tucker Carlson is once again in Moscow, Russia.
In February, the last time he was there, his interview with Vladimir Putin caused quite a stir. Leftist media called Tucker a traitor, Kremlin propagandist, and worse.
Carlson and Putin discussed salient topics including the war in Ukraine, the Nord Stream pipeline bombing, and Russia’s involvement in Syria.
The interview gave many Americans their first view of Putin talking with an American journalist. On X (formerly Twitter) alone, the interview got 215 million views.
Americans clearly want to hear both sides of this story. Compare Tucker’s 215 million views on a single interview to the average number of CNN viewers, which is currently around 268,000, a record low (yet another sign that legacy media is on the way out–good riddance).
This very worthwhile and important commentary from Jim put in an appearance on the dailyreckoning.com Internet site on Friday -- and another link to it is here. The interview involving Tucker Carlson and Russia's Foreign Minister, Sergey Lavrov that Jim mentioned in the above commentary is linked here -- and runs for 1 hour 21 minutes -- and is a must watch in my opinion.
![]()
CME to Offer One-Ounce Gold Futures to Meet Surging Demand From Retail Traders
CME Group Inc. will start offering a one-ounce gold futures contract in January to meet surging demand from retail investors amid bullion’s record-breaking rally.
There has been a larger trend among retail investors to seek smaller-sized gold products as a way to diversify their portfolios as spot gold hit repeated record highs this year. The precious metal is the go-to haven asset in times of economic and financial uncertainties.
The one-ounce contract is a “great way to lower the barrier to entry in our market,” Jin Hennig, CME’s global head of metals, said in an interview. “Our clientele is also getting younger. That’s a lot more doable.”
The futures contract will be available starting Jan. 13, pending regulatory review, the Chicago-based exchange said Thursday in a statement. The new offering adds to CME’s retail-friendly micro gold and micro silver futures — which are a fraction of the benchmark futures contracts. CME said those are among the fastest-growing metals products, reaching record trading volumes this year.
CME also expects the new contract to capture robust demand from retail investors in Asia, where gold as a store of value and a hedge against turmoils is very much embedded in the region’s culture. The contract offers “a meaningful way” for individual traders in Asia to “manage their own wealth creations,” Hennig said.
I suspect that this is a paper contract -- and one can't take delivery. The above five paragraphs are all there is to this brief Bloomberg article that was picked up by the bnnbloomberg.com Internet site at 10:00 a.m. EST on Friday morning -- and the first person through the door with this was Tim Gorman. Another link to it is here.
![]()
Asia Gold Indian dealers offer discounts; China sees seasonally soft demand
Physical gold was sold at a discount in India for the first time in six weeks, as a weaker rupee drove up prices and in turn moderated demand, while top consumer China saw seasonally slow demand.
Domestic prices in India rose to 76,800 rupees per 10 grams on Friday after falling to 74,852 rupees earlier last week.
Jewellers were not making purchases as the rupee fell to a record low, making imports even more expensive, said a Mumbai-based dealer with a private bullion importing bank.
The rupee dropped to a lifetime low of 84.7575 against the U.S. dollar this week.
Indian dealers offered a discount of up to $2 an ounce over official domestic prices, inclusive of 6% import and 3% sales levies, down from last week’s premium of up to $3.
"Retail demand was pretty low this week. Wedding season is going on, but lots of buyers seem to be holding off, waiting for prices to drop," said a New Delhi-based jeweller.
This gold-related news item appeared on the Reuters website at 12:13 a.m. PST on Friday morning -- and I thank John Brimelow of goldjottings.com fame for sending it our way. His shorthand comments on this are as follows: "12/6 Indian ex-duty premium ($2) vs. +$3 11/29. World gold ~$2,643 down $17. Local $240 above world: smuggling viable. China ($11)-($15) vs. ($19-($21). Hong Kong & Singapore premiums are higher and firm. Odd. Smuggling demand? Reuters suggests the Indian public is hoping for further dip. Absent one. they will be forced into the market as this is the high wedding season." Another link to this Reuters story is here.
![]()
QUOTE of the DAY

![]()
The WRAP
"Understand this. Things are now in motion that cannot be undone." -- Gandalf the White
![]()
"Smoke on the Water" is a song by English rock band Deep Purple, released on their 1972 studio album Machine Head. The song's lyrics are based on true events, chronicling the 1971 fire at Montreux Casino in Montreux, Switzerland. It is considered the band's signature song, even though it never crossed their minds that it would be a big hit when they included it on their album. Its guitar riff is considered to be one of the most iconic in rock history.
I heard this rock classic at a restaurant here in town earlier in the week -- and I just can't get it out of my head. I featured it earlier this year as well...but so what! The link is here. Of course there's a bass cover to this -- and it's very busy, complex and continuous. That's linked here.
Today's classical 'blast from the past' is Sergei Rachmaninoff's "Rhapsody on a Theme of Paganini", Op. 43 which the composer premiered on 07 September 1934 in Baltimore with the Philadelphia Symphony Orchestra -- and with Maestro/showman Leopold Stokowski on the stand, it must have a performance to remember!
Here's the most wonderful and gifted Ukraine-born pianist Anna Fedorova doing the honours at the Concertgebouw in Amsterdam on 11 March 2018. She's accompanied by the Philharmonie Südwestfalen -- and Maestro Gerard Oskamp conducts. The link is here.
![]()
As I've been pointing out with increasing frequency lately, the disconnect between precious metal prices and the dollar index is almost total -- and Friday's price action was another poster child for that. It's obvious that the DXY would have crashed and burned at 8:30 a.m. on that non-farm payroll number, but that just wasn't allowed to happen...nor were higher precious metal prices.
The attempts by the collusive commercial traders of whatever stripe of engineering precious metal price lower at the Shanghai open in Globex trading on their Friday morning, blew up in their faces in a most spectacular fashion.
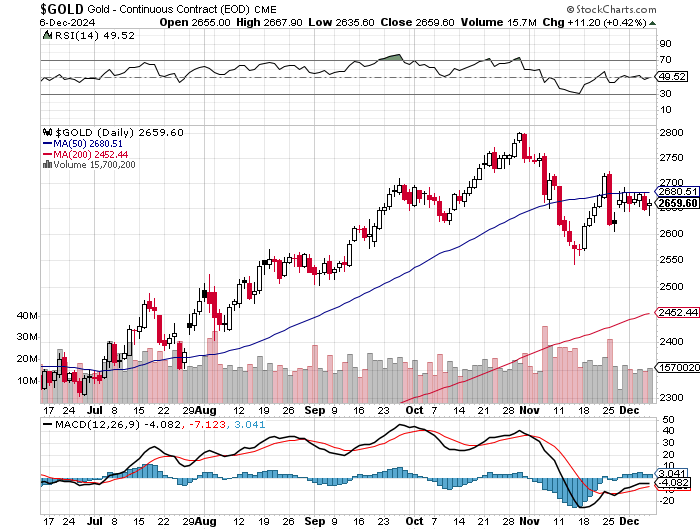
Although gold was only allowed to close higher by $1.40 in the spot market...it closed up $11.20 in February, its current front month -- and it continues to quietly sag further below its 50-day moving average...which is not accidental, I'm sure.
It was even more obvious in silver...closing lower by 35 cents in the spot market...but higher by a nickel in its current front month, which is March. It was allowed to touch its 50-day moving average in that month in early Globex trading overseas, but was hauled down and closed well below it by the time the COMEX closed in New York on Friday afternoon.
Friday was the third day in a row that silver touched or traded above that moving average intraday, but was hauled lower and closed below it on all three occasions. It's obvious that the collusive commercial traders of whatever stripe have had both on a very short leash all this past week -- and that is certainly evident on their respective 6-month charts below.
'Da boyz' closed platinum lower for the third straight day -- and it now almost 40 bucks below its nearest moving average that matters...the 200-day. And after closing within a whisker of its 200-day moving average for six straight trading session, palladium has been closed quietly lower for the last two days -- and is now 24 dollars below that moving average.
Of course both silver and gold are light years above their respective 200-day moving averages -- and I'm even more firmly of the opinion that they're 'bridges too far'. The Big 4/8 collusive commercial shorts have had no choice but to run up their collective short positions to obscene and grotesque levels in order to prevent them from running away to the upside.
That was evident in yesterday's COT Report, where the Big 4/8 shorts had to aggressively add to their short positions as their erstwhile? partners-in-crime ...Ted's raptors...were aggressively long buyers in both silver and gold as well.
Copper was forced to close within a small fraction of a penny of the unchanged mark for the third straight day, as it closed up 0.10% -- and still sitting at $4.20/pound. I noted that its 50-day closed below its 200-day moving average for the first time yesterday. Copper is 12 cents below both of them now.
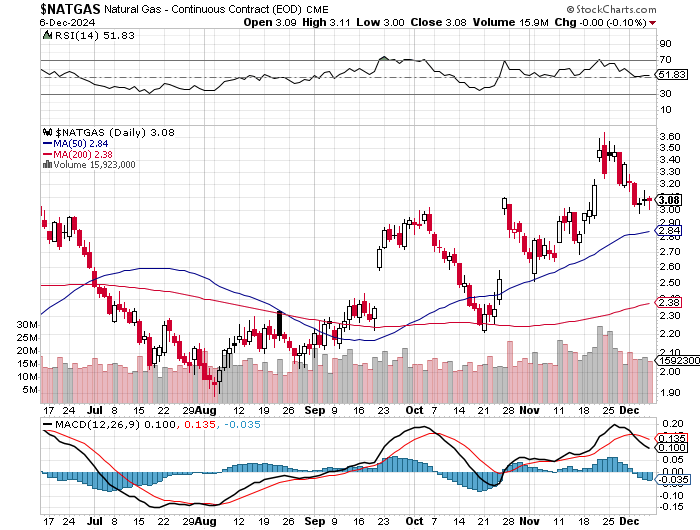
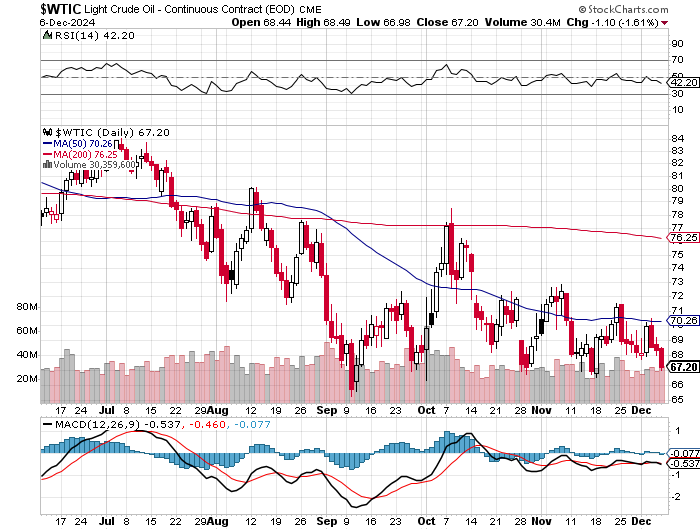
Natural gas [chart included] close unchanged...down 0.10 percent...at $3.08/1,000 cubic feet -- and still remains some distance above any moving average that matters. WTIC got smacked for the third day in a row...down a further $1.10 at $67.20/barrel -- and now 3 bucks below its 50-day -- and 9 dollars below its 200-day.
Here are the 6-month charts for the Big 6+1 commodities...courtesy of stockcharts.com as always and, if interested, their COMEX closing prices in their current front months on Friday should be noted. Click to enlarge.
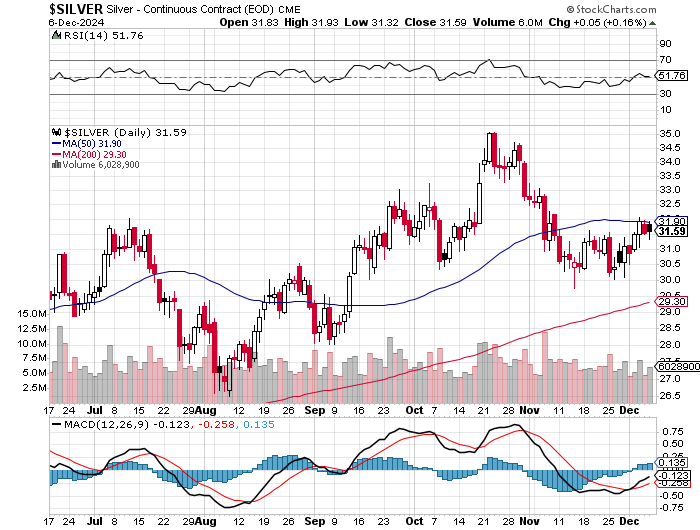
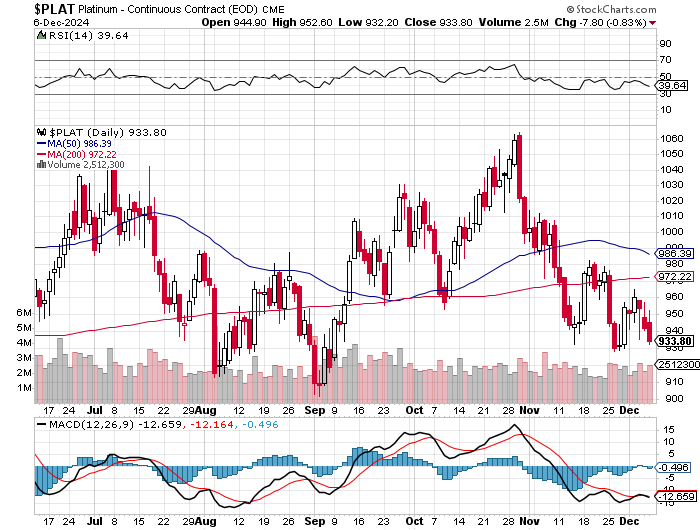
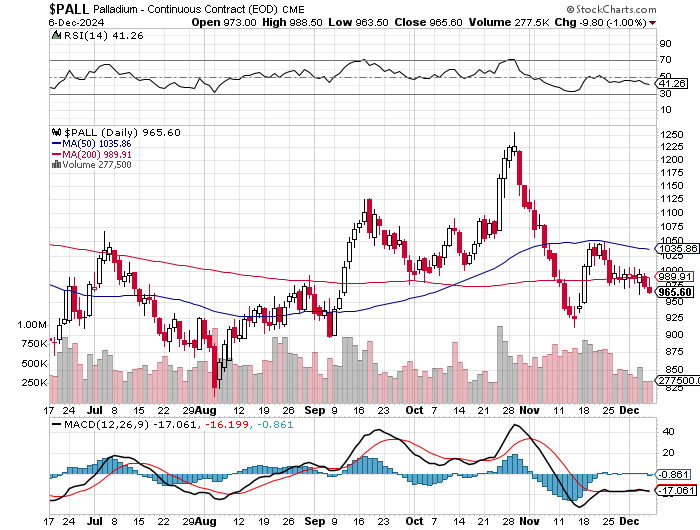
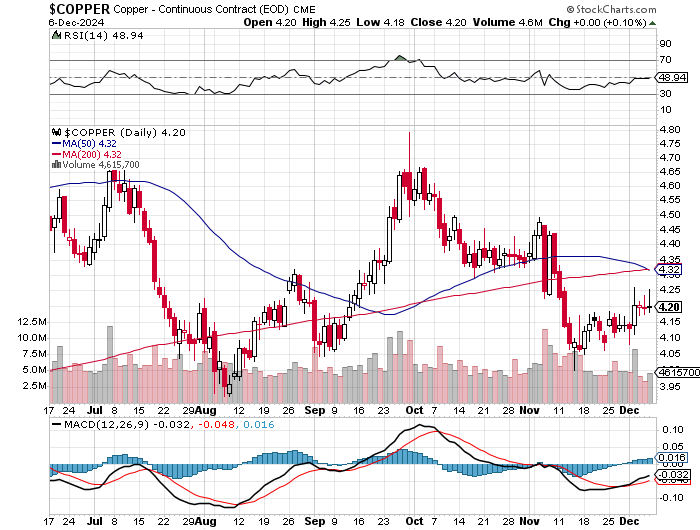
As I stated in this spot in last Saturday's column, I'm not at all sure how what's left of this year will turn out regarding gold and silver prices -- and as I also pointed out..."There are, of course, myriad reasons why their respective prices...along with a whole host of other commodities...should be far higher than they are today...especially silver -- and only one reason why they're not, as Ted Butler so correctly pointed out on many occasions."
Despite all the happy talk and new highs in all the indexes, this 'Everything Bubble'...the largest economic and monetary bubble the world has ever seen...continues to grind on -- and I'm still on record that it will all come crashing down within the next couple of months.
But, for the moment, it's being held together by oceans of easy money from the world's central banks -- and it seems most likely that the Fed will throw more gas on the fire with a further interest rate cut when they have their next FOMC meeting about ten days from now.
Looking overseas, the criminal globalist power elite...lead mostly by the U.S. and Britain...continue to stir up trouble. First it was with the Ukraine and Russia...followed by Israel and Iran et al. -- and that has now spread into Syria. On top of that, these globalists are now stirring the pot in both Georgia and Romania in recent days.
If you want to keep up with what's going on in these arenas, the interviews by Judge Napolitano that grace this column every day is a good place to start -- and another place I hang out after I'm through with my daily column is at the duran.com Internet site...with antiwar.com being another good one.
It's the west defending their dying hegemony against the rise of the BRICS+ nations et al. -- and the west's treachery to hold onto the current power structure should never be underestimated. It's now gone beyond G. Edward Griffin's "The Creature From Jekyll Island" -- and we're now deep into Samuel P. Huntington and Zbigniew Brzezinski territory -- as I've been stating on a regular basis for the last year or so.
Huntington's "Clash of Civilizations and the Remaking of World Order" and Brzezinski's "Grand Chessboard: American Primacy and It's Geostrategic Imperatives" are must reads. But if you can't be bothered, then I suggest you go to amazon.com -- and at least read the write-ups on them...or search for them on Goggle, just so you can get the flavour of the mind set of these psychopathic western globalist power elite.
A quote, falsely attributed to Sun Tzu, states that "An evil man will burn his own nation to the ground to rule over the ashes." -- and that's precisely what the U.S....along with some of their vassal states will do, if push really becomes shove.
I'm not overly happy about bringing this subject up every week now, but along with the 'everything bubble'...the suppression of commodity/precious metal prices -- and the looming threat of all-out war of one type or another, these are pretty much the only things on my radar screen at the moment.
And as I always point out...I'm just hoping that we aren't collateral damage of one kind or another as things either blow up...or melt down...as the case may be.
For those reasons just stated above -- and no more are needed...I'm still 'all in' and, as always, will remain so to whatever end.
See you on Tuesday.
Ed


