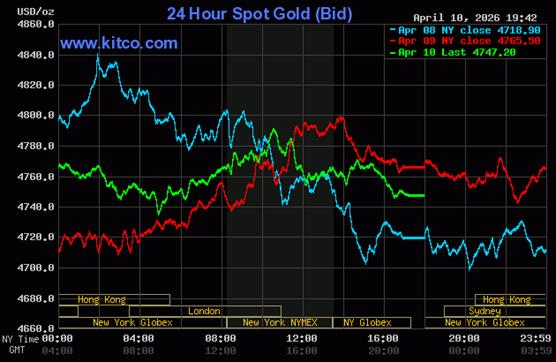
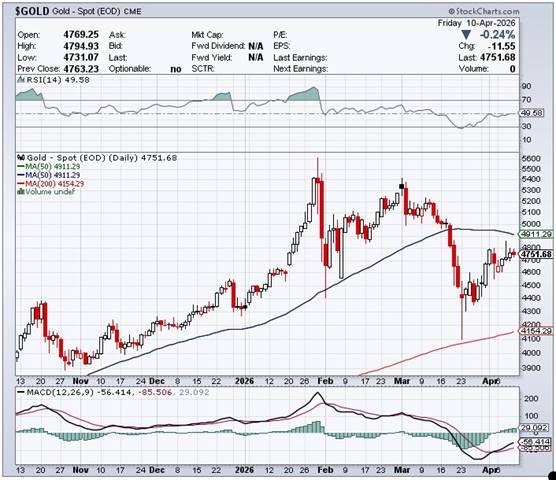
The gold price was sold unevenly lower in early Globex trading in New York on Thursday evening -- and that lasted until around 10:40 a.m. China Standard Time on their Friday morning. It then had a broad up/down move that ended minutes before 10 a.m. in London -- and its ensuing rally ran into 'da boyz' a minute or so after 10:30 a.m. in New York. It was then sold/engineered two steps lower until the market closed at 5:00 p.m. EDT.
The low and high ticks in silver were recorded as $4,752.70 and $4,820.00 in the June contract...an intraday move of $67.30 an ounce. The April/June price spread differential in gold at the close in New York yesterday was $25.50... June/August was $37.20...August/October was $35.30 -- and October/ December was $36.50 an ounce.
Gold was closed in New York on Friday afternoon at $4,747.20 spot...down $18.30 on the day -- and $46.20 off its Kitco-recorded high tick. Net volume was super ultra light at only 104,000 contracts -- and there were a bit over 18,000 contracts worth of roll-over/switch volume on top of that.
I saw that 812 gold, plus 175 silver contracts were traded in April yesterday and, as is always the case, it remains to be seen just how much of these amounts show up in tonight's Daily Delivery and Preliminary Reports further down in today's column.
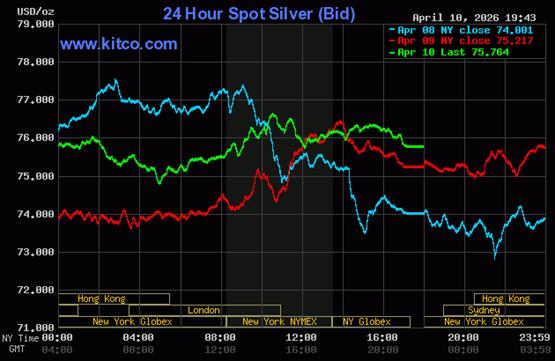
With no exceptions that mattered, the collusive commercial traders of whatever stripe managed silver's price path in an identical fashion as gold's ...including all its major price inflection points.
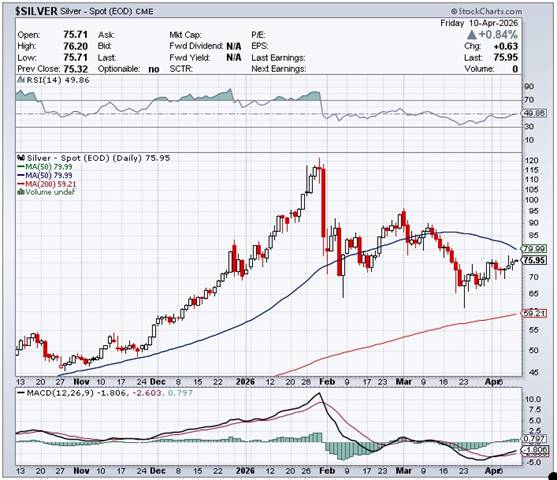
The low and high tick in it were reported by the CME Group as $74.88 and $77.005 in the May contract...an intraday move of $2.125 an ounce. The May/ July price spread differential in silver at the close in New York yesterday was 56.7 cents...July/September was 59.1 cents -- and September/December was 81.6 cents an ounce.
Silver was closed on Friday afternoon in New York at $75.764 spot...up 55 cents on the day -- and 95 cents off its Kitco-recorded high tick. Net volume was barely fumes & vapours at about 17,500 contracts -- and there were a very hefty 17,800 contracts worth of roll-over/switch volume out of May and into future months in this precious metal...mostly July, but with a noticeable bit into September as well.
![]()
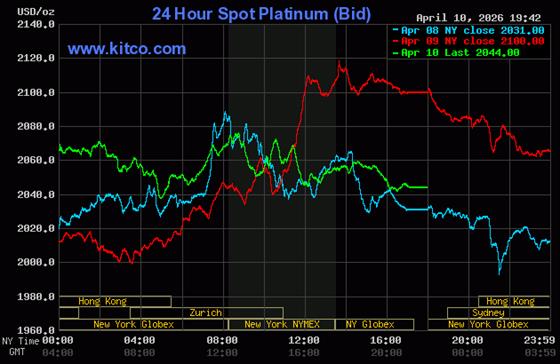
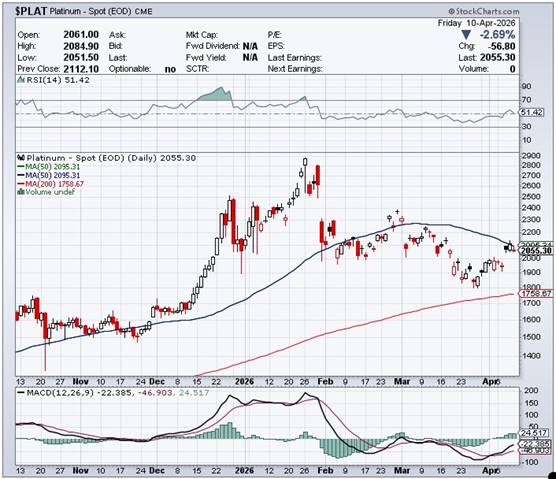
Platinum was under price pressure right from the 6:00 p.m. Globex open in New York on Thursday evening -- and its engineered low tick was set at 11 a.m. in Zurich on their Friday morning. Its ensuing rally ran into 'something' shortly before 9 a.m. in COMEX trading in New York -- and it was then sold/ engineered very unevenly lower until the market closed at 5:00 p.m. EDT. Platinum was closed at $2,044 spot...down 56 dollars on the day -- and 63 bucks off its Kitco-recorded high tick.
![]()
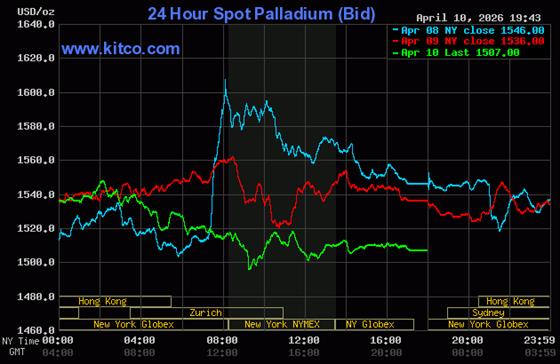
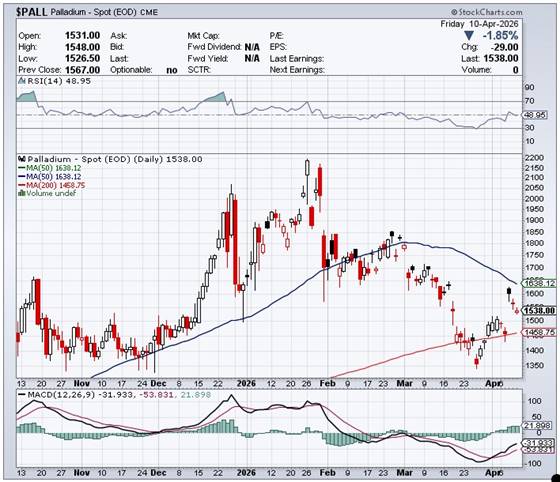
Palladium was forced to wander broadly and quietly sideways until at or minutes before the 2:15 p.m. afternoon gold fix in Shanghai -- and it was down hill from that juncture until its engineered low tick was set very shortly after 1 p.m. in Globex trading in Zurich. Its ensuing rally ended around 8:30 a.m. in COMEX trading in New York -- and it then wandered quietly sideways to a bit lower until the market closed at 5:00 p.m. EDT. Palladium was closed at $1,507 spot...down 29 bucks on the day -- and 43 dollars off its Kitco-recorded high tick.
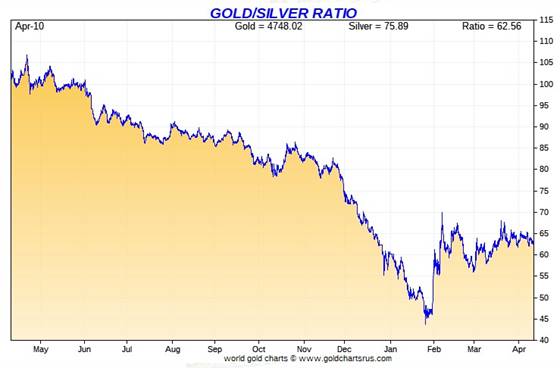
Based on the kitco.com spot closing prices in silver and gold posted above... the gold/silver ratio worked out to 62.7 to 1 on Friday...compared to 63.4 to 1 on Thursday.
Here's the 1-year Gold/Silver Ratio chart from Nick Laird -- and updated with this past week's data. Click to enlarge.
![]()
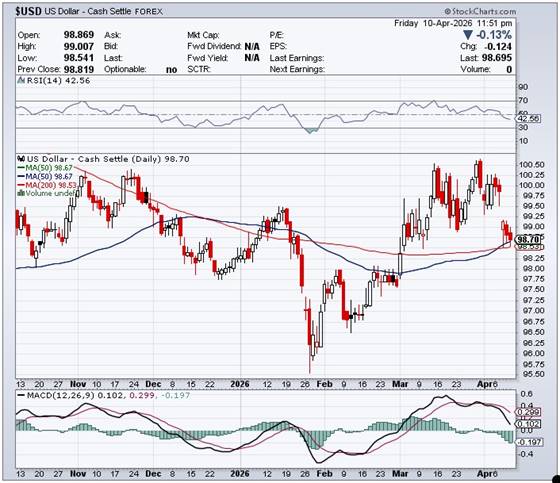
The dollar index closed very late on Thursday afternoon in New York at 98.82 -- and then opened higher by 5 basis points once trading commenced at 7:45 p.m. EDT on Thursday evening...which was 7:45 a.m. China Standard Time on their Friday morning. It then wandered quietly sideways to a bit higher until 9:04 a.m. in London -- and it was then quietly and a bit unevenly downhill from that point until its low tick was set at 10:26 a.m. in New York. It then chopped a bit higher until 12:45 p.m...edged a bit lower until 2:38 p.m. -- and then crept a tad higher until trading ended at 5:00 p.m. EDT.
The dollar index finished the Friday trading session in New York at 98.65...down 17 basis points from its close on Thursday -- and 5 basis points below its indicated close on the DXY chart below.
Here's the DXY chart for Friday...thanks to marketwatch.com as usual -- and the above-mentioned discrepancy should be noted. Click to enlarge.
![]()
Here's the 6-month U.S. dollar index chart...courtesy of stockcharts.com as usual. The delta between its close...98.70..and the close on DXY chart above, was 5 basis points above that. Click to enlarge.
![]()
'Da boyz' stepped on gold and silver about five or so minutes after the dollar index hit its low tick...or they would have certainly continued to rally if they hadn't.
U.S. 10-year Treasury: 4.3170%...up 0.0240/(+0.56%)...as of the 1:59:54 p.m. CDT close.
The Fed stepped in around 11:45 a.m. CST/12:45 a.m. EDT to ensure that the yield on the ten-year didn't go up any more than it already had.
For the week, the U.S. ten-year treasury was basically unchanged from its 4.3130% close last Friday...but that was only because the Fed was in the treasury market all week to ensure that it didn't close any higher than that.
Here's the 5-year 10-year U.S. Treasury chart from the yahoo.com Internet site -- which puts the current yield into a somewhat longer-term perspective. Click to enlarge.
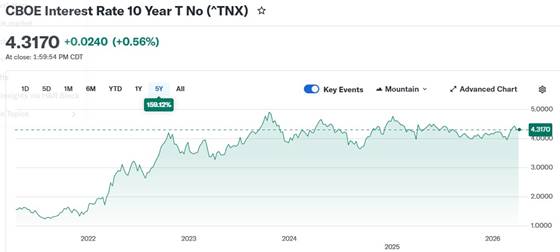
As I keep pointing out in this spot every Saturday, the 10-year hasn't been allowed to trade above its 4.92% high set back on October 15, 2023...but it's now more than obvious that we've seen the 3.9482% low for this cycle...which was set back on October 22, 2025. The almost 45 basis point increase over the last month remains ominous, but the Fed continues to fight it tooth and nail all the way -- which certainly means that its yield would be far higher than it is now without their daily market management. Rising bond yields are now a global phenomenon.
With that CPI number that came out yesterday, it's a given that future interest rate cuts are off the table for at least the rest of this year.
![]()
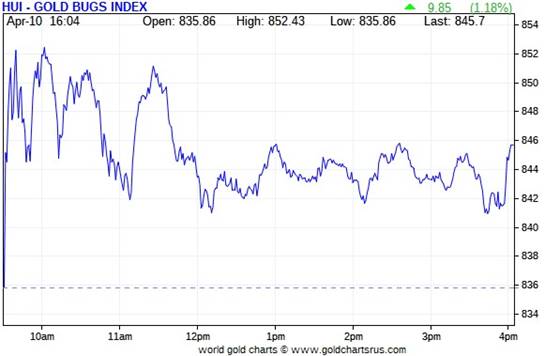
The gold stock jumped up a bunch at the 9:30 opens of the equity markets, but ran into selling pressure immediately -- and every rally attempt after that also ran into willing sellers. From 12:10 p.m. EDT onwards they proceeded to chop sideways to a tad higher until the markets closed at 4:00 p.m. And despite the fact that gold was closed well down on the day...the HUI closed up 1.18 percent.
![]()
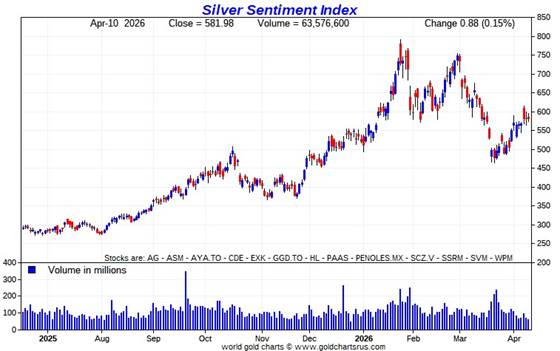
The silver equities rallies sharply in the first four minutes of trading in New York on Friday morning...but were then forced to chop quietly lower until around 3:45 p.m...when they ticked a bit higher going into the 4:00 p.m. EDT close. Nick Laird's Silver Sentiment Index closed higher by a paltry 0.15 percent. Click to enlarge.
![]()
The two biggest gainers were Wheaton Precious Metals and Silvercorp Metals...closing higher by 2.80 and 2.77 percent respectively. The biggest underperformer by far was Peñoles, as it closed lower by 4.78 percent.
There was this news from Hecla Mining yesterday.
The new short report came out yesterday -- and it showed that the short position in First Majestic Silver fell by 13.13%...down to 20.12 million shares held short on the NYSE. This amount represents 4.13% of the float -- and is of no concern.
Silver managed to close up on the day by 0.55% on Friday...the Silver Sentiment Index higher by only 0.15% -- and Sprott's PSLV finished the day up 1.18%
Gold closed down by 0.38%...but the HUI closed up 1.18% -- and Sprott's PHYS finished the day lower by 0.14%
It was yet another day where silver outperformed gold...but the silver equities underperformed not only its underlying precious metal...but the gold stocks as well. As I keep pointing out...'da boyz' are managing the precious metal equities aggressively -- and have been for some time now.
The Shanghai/U.S. price premium in silver was 11.61 percent yesterday.
The reddit.com/Wallstreetsilver website, now under 'new' and somewhat improved management, is linked here. The link to two other silver forums are here -- and here.
![]()
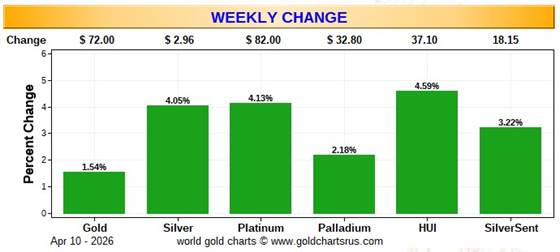
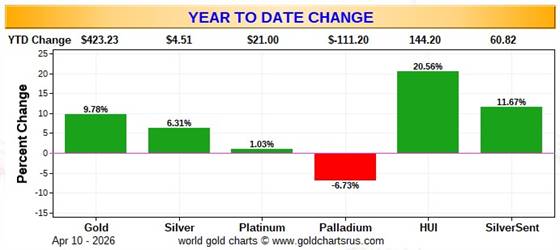
Here are the usual three charts that appear in this spot in every weekend missive. They show the changes in gold, silver, platinum and palladium in both percent and dollar and cents terms, as of their Thursday closes in New York — along with the changes in the HUI and the Silver Sentiment Index.
Here's the weekly chart -- and it's obvious right away just how hard 'da boyz' leaned on the silver equities this past week...as they hugely underperformed the metal itself. The gold stocks fared far better relative to its underlying precious metal. One can only image how the precious metal shares would have performed if they had been left to their own devices on Thursday and Friday. Click to enlarge.
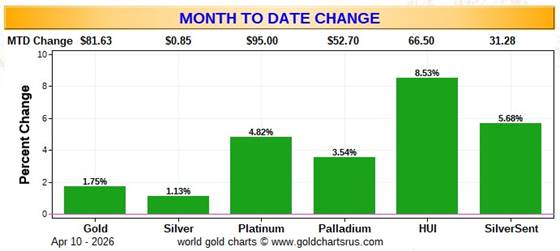
Here's the month-to-date chart -- and I'm just happy with the fact that it's green across the board. But because of the price shenanigans in both silver and gold -- and their associated equities, I'm hesitant to read too much into this chart. Click to enlarge.
Here's the year-to-date chart -- and because of the massive interventions by the collusive commercial traders of whatever stripe in the COMEX futures market over that time period -- and in their shares...what I said about the month-to-date chart above, applies here as well. Click to enlarge.
Despite the fact that silver has now broken the $120 barrier...albeit briefly -- and the silver well in London came close to running dry last October...the gold/silver ratio remains at a farcical 62.7 to 1 as of Friday's close. The 'normal' and historical ratio is around 15 to 1...which would put silver at around $316 based on gold's closing price on Friday. And if priced at the ratio of 7:1 that it comes out of the ground at, compared to gold...that would put silver at around $680 an ounce. So a rather impressive triple-digit silver price is in our future...most likely somewhere between those two numbers.
As I say in this spot every Saturday...all that remains to be resolved is what that price will be -- and how soon 'da boyz' allow it to happen. Its first attempt to reach one of these values was obviously crushed. But in the face of the continuing structural deficit in silver -- and all the other stuff going on in the world today, they can't keep it up forever...despite the fact they keep stepping on every rally attempt.
![]()
The CME Daily Delivery Report for Day 9 of April deliveries showed that 699 gold, plus 100 silver contracts were posted for delivery within the COMEX-approved depositories on the U.S. east coast on Tuesday.
In gold, the only two short/issuers that mattered were Wells Fargo Securities and JPMorgan...issuing 450 and 246 contracts respectively....Wells Fargo from their house account. The only long/stopper that mattered was French bank BNP Paribas once again, picking up 606 contracts for its client account.
In silver, the four short/issuers were British bank HSBC, JPMorgan, Wells Fargo Securities -- and ADM...as they issued 43, 25, 20 and 12 contracts respectively...Wells Fargo from their house account. The sole long/stopper was French bank BNP Paribas.
In platinum and palladium, there were 99 and 3 contracts issued and stopped respectively.
In copper, another 304 contracts/7.660 million pounds were issued and stopped.
The link to yesterday's Issuers and Stoppers Report is here.
Month-to-date in April, there have already been 18,042 gold...plus 1,652 silver contracts issued and stopped.
On First Notice Day for April deliveries back on March 30...there were 16,983 COMEX gold contracts still open -- and in silver, that number was 1,424 contract. It's obviously going to be another big delivery month, and there are still two weeks left to go.
The CME Preliminary Report for the Friday trading session showed that gold open interest in April decreased by 82 contracts, leaving 1,145 still open...minus the 699 contracts out for delivery on Tuesday as per the above Daily Delivery Report. Thursday's Daily Delivery Report showed that 687 gold contracts were actually posted for delivery on Monday...so that means that 687-82=605 more gold contracts were added to the April delivery month.
Silver o.i. in April rose by 100 contracts, leaving 134 still open, minus the 100 silver contracts out for delivery on Tuesday as mentioned a bunch of paragraphs ago. Thursday's Daily Delivery Report showed that 1 lone silver contract was posted for delivery on Monday...so that means that 100+1=101 more silver contracts were added to April deliveries.
Total gold open interest in the Preliminary Report on Friday night rose by 2,183 COMEX contracts. Total silver o.i. declined by 1,377 contracts.
[I checked the final change in total open interest for gold on Thursday -- and it showed a decent decline...from +6,893 COMEX contracts, down to just +1,217 contracts. The final change in total silver o.i. for Thursday showed a tiny decrease...from +821 contracts, down to +733 COMEX contracts.]
Gold open interest in May in Friday morning's CME Final Report showed a decline of a further 430 contracts, leaving 3,467 contracts still around. Silver o.i. in May dropped by a further 4,028 COMEX contracts, leaving 61,519 contracts still open.
![]()
![]()
There were no reported changes in GLD...but a further 588,484 troy ounces of silver were removed from SLV.
The latest short report showed on The Wall Street Journal's website on Friday afternoon EDT...for positions held at the close of trading on Tuesday, March 31 -- and it showed that the short position in SLV rose by a tad... from 34.96 million shares/troy ounces...up to 35.34 million shares/troy ounces, which is an increase of 1.08%. This represents 6.50% of the total SLV shares outstanding.
That short position is still hugely manipulative for the silver price, as there isn't a single troy ounce of it backing any of those shorted shares as SLV's prospectus requires.
The short position in GLD fell by about the same amount...from 10.56 million shares sold short, down to 10.40 million shares sold short...a decrease of 1.49%. This amount represents 2.82% of total GLD shares outstanding.
The SLV borrow rate started the Friday trading session at 0.33% -- and ended it at 0.41%...with 10.0 million shares available.. The GLD borrow rate began the day at 0.33% -- and finished it at 0.30%...with 7.9 million shares available.
In other gold and silver ETFs and mutual funds on Earth on Friday ...net of any changes in COMEX, GLD and SLV activity, there were a net 258,716 troy ounces of gold added -- and mostly because of the 251,421 troy ounces added to all of China's ETFs. But in silver, there were a net 4,782,3008 troy ounces withdrawn -- and that's because of the 5,663,721 troy ounces removed from all of India's silver ETFs.
I'm still waiting for the Royal Canadian Mint to publish their Q4/2025 quarterly report...but so far nothing.
![]()
The only activity in gold over at the COMEX-approved depositories on the U.S. east coast on Thursday were the 62,370 troy ounces that departed JPMorgan. Nothing was reported received once again -- and there was no paper activity, either. The link to this is here.
In silver, there were 1,654,632 troy ounces received -- and only 38,954 troy ounces were shipped out.
The largest 'in' amount were the 1,206,289 troy ounces/two truckloads that showed up at Brink's, Inc...with the remaining 448,342 dropped off at HSBC USA.
The two 'out' amounts were the 34,033 and 4,920 troy ounces/one COMEX contract that departed CNT and Delaware respectively.
There was some strange paper activity, as 1,196,997 troy ounces/two truckloads were adjusted into existence out of thin air in the Eligible category over at Brink's, Inc. What that was about...who knows?
And as a point of interest, this is the first business day in 2026 that more silver was received at the COMEX, than was shipped out.
The link to all of Thursday's considerable COMEX silver action is here.
The Shanghai Futures Exchange updated their silver inventories as of the close of business on their Friday -- and it showed that a net and further 891,611 troy ounces/ 27.732 metric tonnes of silver were added... leaving their silver inventories at 13.556 million troy ounces/421.461 metric tonnes.
![]()
Here are the usual 20-year charts that show up in this space in every weekend column. They show the total amounts of physical gold and silver held in all known depositories, ETFs and mutual funds as of the close of business on Friday. Click to enlarge.
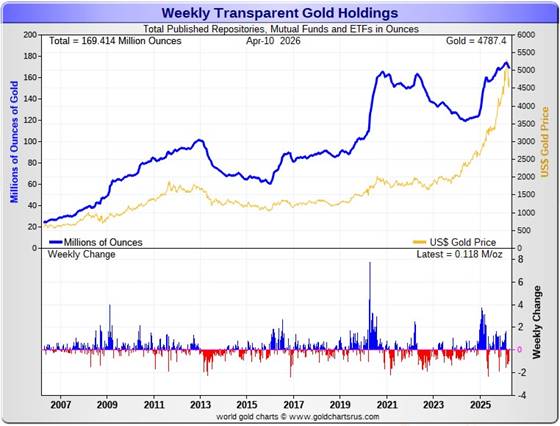
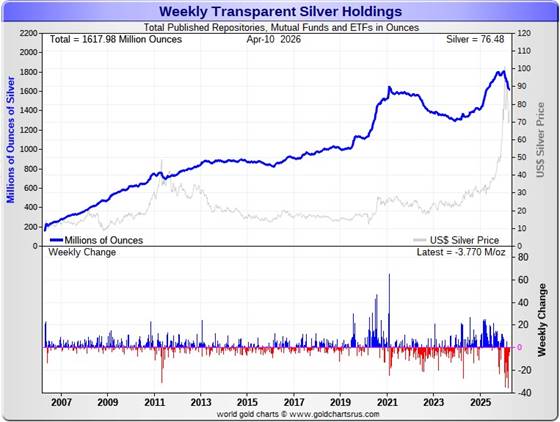
During the business week just past, there were a net 118,000 troy ounces of gold added -- but a net and further 3.770 million troy ounces of silver were taken out.
According to Nick Laird's data on his website, a net 2.449 million troy ounces of gold were removed from all the world's known depositories, mutual funds and ETFs during the last four weeks. The only two 'in' amounts worth noting were the 251,421 troy ounces that went into China's ETFs...which I mentioned further up...plus the 138,061 troy ounces into UBS. The largest 'out' amount by far were the 2.001 million troy ounces that left the COMEX -- followed by the 479,000 troy ounces that departed SLV. Next were the 169,100 troy ounces that left iShares IAU.
The amount of gold in all the world's ETFs and mutual funds remains barely above its old all-time high of late 2020...see the above chart. But it should be far higher, more than double that amount, considering gold's current price...far more than double it was back then. Why it isn't, is beyond me.
A net 30.655 million troy ounces of silver were taken out during that same 4-week time period. The largest 'out' amount were the 13.788 million oz. out of the COMEX...followed by the 5.664 million oz. out of the Indian ETFs -- and the 5.432 million oz. out of the SLV...plus the 3.451 million out of Aberdeen. The 'out' list goes on and on...
The only 'in' amount worth mentioning were the 1.123 million troy ounces into WisdomTree.
It's been a wild past four or five months in the physical silver space -- and the only explanations for these massive withdrawals over that time period was because of redemptions...or the physical metal was needed elsewhere.
It should be noted that the amount of silver held in all these depositories, ETFs and mutual funds is now back below its old all-time high inventory level of January 2021. But it should be far higher than it is as well, because silver is about 2.8x the price it was back then.
Back at its previous inventory peak in late January 2021, silver was around $27 an ounce. Now its about 48 bucks higher. Why the precious metal ETFs aren't doing better is a mystery for which I have no answer, except for what I mentioned two paragraphs ago.
Retail demand remains quiet -- and there are less 'out of stock' signs over at all the retail bullion stores that I follow. However, the buy/sell spreads at most bullion stores remain north of 10 percent -- and in the case of anything less than 0.999+ pure, it's far more than that.
COMEX silver withdrawals have been monstrous since the start of the year...135 million in Q1/2026...plus 4.236 million oz. so far in April. These amount don't include the 8.260 million oz. issued and stopped on the COMEX in the April delivery month so far.
The "rapacious" silver demand will continue until available supplies are depleted -- and we're also well into the sixth year of a structural deficit in silver according to the ongoing reports from The Silver Institute.
The vast majority of precious metals being held in these depositories are by those who won't be selling until the silver price is many multiples of what it is today...if ever.
Sprott's PSLV is the third largest depository of silver on Planet Earth with 216.8 million troy ounces...unchanged from last week -- and a great distance behind the COMEX, which has now been demoted to the second largest silver depository, where there are 327.9 million troy ounces being held...up a net 200,000 troy ounces this past week...but minus the 103 million troy ounces being held in trust for SLV by JPMorgan.
That 103 million ounce amount brings JPMorgan's actual silver warehouse stocks down to around the 42.5 million troy ounce mark...quite a bit different than the 145.5 million they indicate they have -- unchanged on the week. They've parted with a lot of silver in the last six or so months...around 66 million oz.
But that number doesn't include the silver that JPMorgan owns and has stored at the other COMEX-approved depositories. They've shipped out lots of that over the months and years...especially this year so far.
PSLV remains a very long way behind SLV as well -- still the largest silver depository...with 491.6 million troy ounces as of Friday's close...up a net 800,000 troy ounces from last week.
On a net basis over the last five or so month -- and despite the big spike in the silver price at the end of January, just about every depository or ETF has been hemorrhaging silver. However, that has dropped to almost nothing in the last three weeks.
The latest short report [for positions held at the close of business on Tuesday, March 31] showed that the short position in SLV rose by a tiny 1.08%...from the 34.96 million shares sold short in the prior report...up to 35.34 million shares in the latest short report that came out yesterday. This amount represents 6.50 percent of total SLV shares outstanding...still a bit obscene, but not nearly as bad as it was a month or so ago. Don't forget that there's no physical silver backing any of these shorted shares as the SLV prospectus requires.
BlackRock issued a warning more than ten years ago now to all those short SLV, that there might come a time when there wouldn't be enough metal for them to cover. That would only be true if JPMorgan decides not to supply it to whatever entity requires it. Those that remain short SLV shares are in equally dire straits as those short silver in the COMEX futures market -- and I suspect that they're the same entities.
The next short report...for positions held at the close of trading on Wednesday, April 15...will be posted on The Wall Street Journal's website on Friday, April 24.
Then there's that other little matter of the monster short position in silver and gold held by Bank of America in the OTC market...with JPMorgan & Friends on the long side. Ted said it hadn't gone away. He wrote an article about this back in April 2021 headlined "A New Piece of the Puzzle" -- and linked here.
In the article, the OCC Report stated that BofA had $8.3 billion in precious metal derivatives at the end of Q4/2020 -- and as you'll see in the paragraphs that follow, the BofA's derivatives position is now up to $120.7 billion as of the end of Q4/2025...an almost fifteen-fold increase.
A while after that article came out, he also come to the conclusion that they're short around 25 million ounces of gold with these same parties as well. Once these short covering rallies in both silver and gold really explode higher...we'll see if they need to get taken over, like Bear Stearns did back in 2008 -- and for the same reason.
The latest OCC Report for Q4/2025 was posted on their website on Tuesday, March 31, 2026 -- and it showed that the precious metal derivatives held by the four largest U.S. banks increased by a further $126.49 billion/18% from Q3/2025...up to $830.54 billion...another very hefty amount.
However, I suspect that this increase is almost entirely due to the rise in the prices of the precious metals during that quarter. I also suspect that the increase would have been more, except for the fact that, for the most part, these banks were busy covering some of their short positions in that quarter.
JPMorgan's precious metals derivatives rose from $437.4 billion, up to $479.4 billion from Q3/2025 -- and Citigroup's also rose...from $204.3 billion, up to $217.2 billion. BofA's increased by a lot...from $47.9 billion, up to $120.7 billion -- and the derivatives position held by Goldman Sachs is a piddling and immaterial $607 million -- down from the equally piddling $614 million it held in Q3/2025.
But with JPMorgan holding 57.7% of all the precious metals derivatives... Citibank holding 26.2% -- and Bank of America about 14.5% of the total of the four reporting banks, it's mostly JPMorgan and Citigroup that matter. However, the 152% increase in BofA's derivatives position is noteworthy.
The caveat to the above would be the precious metals derivatives position held by Wells Fargo and Morgan Stanley. The reason that their data is not included is because they are not one of the USA's four largest banks by total derivatives held. But you can bet your entire net worth that they hold also hold derivatives positions in the precious metals that would choke a horse...Wells Fargo in particular.
This would indicate that these six U.S. banks held a derivatives position in the precious metals well north of $1 Trillion dollars at the end of Q4/2025.
But as I keep pointing out in this spot every weekend -- and mentioned just above...the OCC indicator is flawed for two very important reasons, as way back 10-15 years ago, this report used to include the top dozen or so U.S. banks.... which included the likes of Wells Fargo and Morgan Stanley, amongst others...that hold derivatives positions, both long and short, in the precious metals. Now the list is down to just four banks...so a lot of data is hidden ...which is certainly the reason why the list was shortened. On top of that, the list doesn't include the non-U.S. banks that are short and long the precious metals: British, French, German, Canadian -- and Australian.
Including all theirs, the derivatives/paper held in the precious metals...mostly on the short side...is an eye-watering 2+ Trillion dollar number which can never be covered, either in the paper market, or through the delivery of physical metal...without driving the prices of all four precious metals beyond the moon in the process.
The next OCC Report for Q1/2026 is due out at the end of June.
![]()
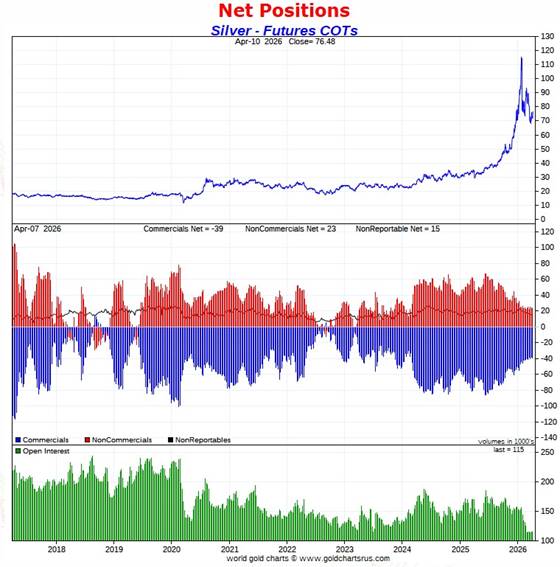
The Commitment of Traders Report, for positions held at the close of COMEX trading on Tuesday, showed that the Commercial net short position in silver rose by an inconsequential amount -- and in gold, it fell by 7,889 COMEX contracts.
In silver, the Commercial net short position rose by a tiny [but deceiving] 58 COMEX contracts...290,000 troy ounces of the stuff...an inconsequential change, as mentioned in the previous paragraph.
They arrived at that number through the sale of 1,681 long contracts, but also bought back/covered 1,623 short contracts -- and it's the difference between those two numbers that represents their change for the reporting week.
Under the hood in the Disaggregated COT Report, it was a bit more interesting ...but only just. The Managed Money traders reduced their net long position by 868 COMEX contracts -- and the traders in the Other Reportables and Nonreportable/ small traders category added to their net long positions during the reporting week. The former increased their net long position by 381 contracts -- and the latter by 545 COMEX contracts.
Doing the math: 545 plus 381 minus 868 equals 58 COMEX contracts...the change in the Commercial net short position.
The Commercial net short position in silver now sits at 38,915 COMEX contracts/194.575 million troy ounces of the stuff...up those 58 contracts from last week's COT Report.
The Big 4 collusive commercial traders decreased their net short position by a further 239 COMEX contracts, down to 29,820 COMEX contracts...their lowest short position on record by a country mile.
The Big '5 through 8' also decreased their net short position...them by a further 348 COMEX contracts...down to 13,587 COMEX contracts...their lowest short position since 17 February.
The Big 8 commercial traders in total are net short 43,407 COMEX silver contracts...down a further 587 contracts on the week -- and obviously their smallest short position on record.
Ted raptors, the 30 small commercial traders other than the Big 8, were sellers during the reporting week...reducing their net long position by 645 COMEX contracts -- and remain net long silver by 4,492 COMEX contracts.
The sale of those 645 contracts by the small commercial traders has the mathematical effect of increasing the Commercial net short position...which isn't an increase at all. When these raptors are net long like they are in silver, all that matters is what the Big 8 did.
Here's the 9-year COT chart for silver thanks to Nick Laird -- and updated with the above data. Click to enlarge.
As I stated earlier in the week, I wasn't expecting much in the way of changes in the COT Report in silver -- and that's the way it turned out.
The most notable feature once again was the continuing decline in the net short position of the Big 8 commercial traders...587 contracts in total this week.
But as I've stating for the last few weeks, the Big 8/'da boyz' are now at the point where they're picking up nickels in front of a steamroller...as the silver market remains completely washed out to the downside from a COMEX futures market perspective. Open interest in silver declined by a piddling 31 contracts over the reporting week -- and is at a 14-year low.
The Big 8 commercial traders are short 37.7 percent of total open interest in silver...down from the 38.2 percent that they were short in last week's COT Report.
![]()
In gold, the commercial net short position declined by 7,889 COMEX contracts ...788,900 troy ounces of the stuff.
They arrived at that number through the sale of 968 long contracts...but bought back/covered 8,857 short contracts -- and it's the difference between those two numbers that represents their change for the reporting week.
Under the hood in the Disaggregated COT Report, all three categories got the 'sell' memo. The Managed Money traders reduced their net long position by 2,782 COMEX contracts...the Other Reportables by 4,115 contracts -- and the Nonreportable/ small traders by 992 contracts.
Doing the math: 2,782 plus 4,115 plus 992 equals 7,889 COMEX contracts... the change in the commercial net short position.
The commercial net short position in gold now stands at 193,751 COMEX contracts/19.375 million troy ounces...down those 7,889 contracts from last week's report.
The Big 4 commercial traders decreased their net short position by 4,166 COMEX contracts, down to 122,077 contracts...which still remains their lowest short position they've held since May 30 of last year.
The Big '5 through 8' commercial traders increased their net short position...them by 1,010 contracts, up to 43,295 COMEX contracts held net short...which is still the lowest short position that I have records for. Since 13 January, these Big '5 through 8' traders have cut their short position almost in half.
The Big 8 commercial traders in total are net short 165,372 COMEX contracts...down a further 3,406 contracts...their lowest short position that I have records for.
Ted's raptors, the 35 small commercial traders other than the Big 8, decreased their net short position for the first time in five weeks, as they reducing it by 4,483 contracts...but remain net short 28,379 COMEX contracts.
And like they currently are in silver, they would normally be net long gold by tens of thousands of contracts at this point in the price cycle. I suspect that no more than two or three of these small commercial traders hold the vast majority of this short position.
Here's Nick's 9-year COT chart for gold -- and updated with the above data. Click to enlarge.
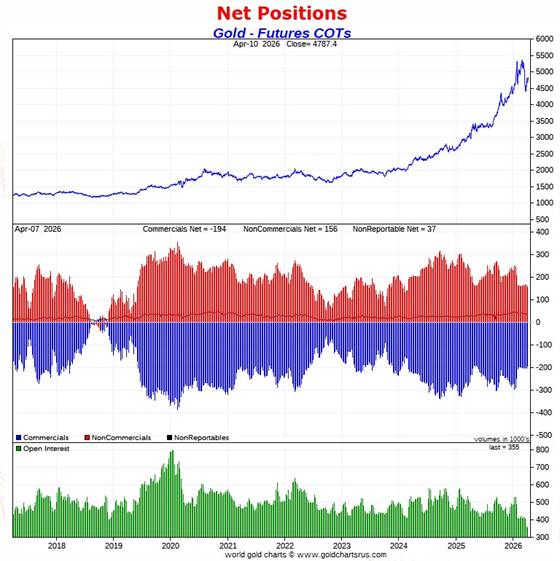
Total open interest in gold during the reporting week fell by a further 6,532 contracts -- and is the lowest it's been since mid 2009...almost 17 years ago.
The Big 8 are short 46.6 percent of total open interest in the COMEX futures market...virtually unchanged from the 46.7 percent that they were short in last week's report.
However, unlike silver, the commercial net short position in gold is much larger than the Big 8 short position...because the rest of the commercial traders, Ted Butler's raptors, are also net short gold. Adding them into the mix, which you have to do, puts the commercial net short position in gold at 54.6 percent of total open interest in the COMEX futures market...up from the 50.5 percent they were short in last week's report.
All in all, I was happy with what the COT Reports showed in silver and gold... especially considering what it could have been. The set-up for a monster rally in silver remains incandescent -- and in gold it remains exceedingly bullish ...bordering on white hot.
But their rally attempts lately have been stymied...as have their share prices -- and I'm still left wondering what event will be allowed to finally set them off.
![]()
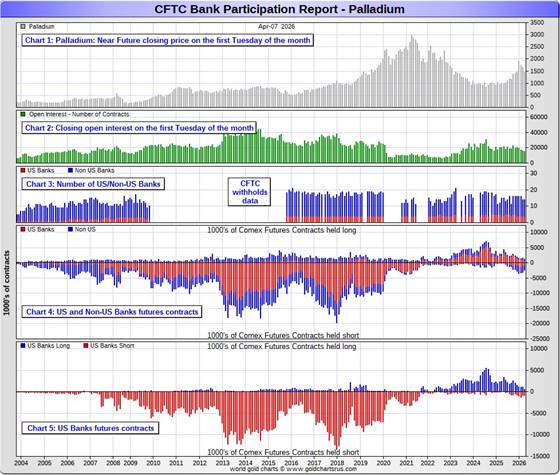
In the other metals, the Managed Money traders in palladium increased their net short position by a further 529 COMEX contracts -- and are net short palladium by 2,541 contracts.
The commercial traders in the Swap Dealers category are net long palladium by 1,625 contracts...up a further 55 contracts on the week. The traders in the Producer/ Merchant category are net short 1,250 COMEX contracts...a decrease of 329 contracts from last week. The traders in the Other Reportables and Nonreportable/ small trader categories are net long about a bit over a thousand contracts each.
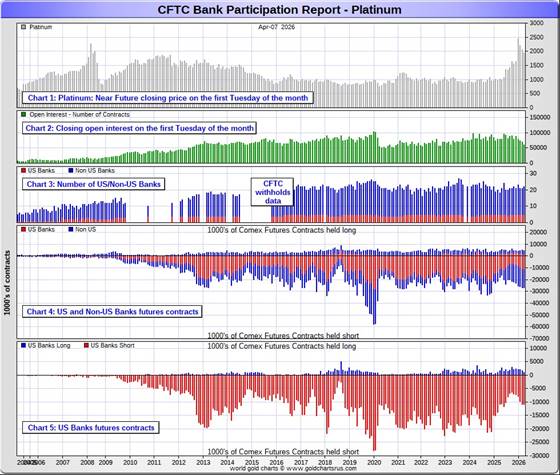
As you can tell from these numbers, palladium is a very dinky market. Total open interest is down to 15,187 COMEX contracts...the lowest it's been since mid-2023. Open interest in platinum is also the lowest since that time as well.
The world's banks are net short 8.9 percent of total open interest in palladium in the COMEX futures market as of the April Bank Participation Report that came out yesterday...which is a decrease from the 10.0 percent that they were net short in March's Bank Participation Report.
This is a very strange and twisted market once you get a look into its internal structure...with platinum not that far behind. And as I point out in every monthly Bank Participation Report, the only reason that there's a COMEX futures market in palladium is so the collusive commercial traders of whatever stripe can control its price.
In platinum the Managed Money traders increased their net long position by a further 1,202 COMEX contracts -- and are now net long platinum by 13,638 contracts. The traders in the Other Reportables and Nonreportable/ small trader category remain net long platinum by very respectable amounts as well.
The commercial traders in the Producer/Merchant category in platinum are net short 13,621 COMEX contracts, up 630 contracts from what they were net short last week. The Swap Dealers in the commercial category also increased their net short position this past week, them by 801 COMEX contracts this past week -- and are net short platinum by 9,773 COMEX contracts.
It's mostly the world's banks that are 'The Big Shorts' in platinum in the COMEX futures market, as per April's Bank Participation Report that came out yesterday. They didn't do much that in that Bank Participation Report -- and haven't done much of anything in platinum in the last three months...although the short position held by the U.S. banks is up a bit.
In copper, the Managed Money traders decreased their net long position by a smallish 779 COMEX contracts during the past reporting week -- but remain net long copper by 38,393 contracts...960 million pounds of the stuff.
Copper, like palladium, continues to be a wildly bifurcated market in the commercial category. The Producer/Merchant category is net short 80,781 copper contracts/ 2.020 billion pounds -- while the Swap Dealers are net long 29,166 COMEX contracts/729 million pounds of the stuff.
Whether this dichotomy in copper means anything or not, will only be known in the fullness of time. Ted Butler said it didn't mean anything as far as he was concerned, as they're all commercial traders in the commercial category. But this bifurcation has been in place for as many years as I've been keeping records -- and that's a very long time.
In this vital industrial commodity, the world's banks...both U.S. and foreign... are net short copper by 1.4% of total open interest in the April Bank Participation Report. Back in the October 2025 BPR, these same banks were net long 0.90% of the total open interest in copper in the COMEX futures market. So basically they're market neutral...but only numerically, as that dichotomy between the two groups of commercial traders is still there.
At the moment it's all the commodity trading houses such as Glencore and Trafigura et al., along with some hedge funds, that are mega net short copper in the Producer/Merchant category, as the Swap Dealers are net long, as pointed out above.
The next Bank Participation Report is due out Friday, May 8.
![]()
Here’s Nick Laird’s “Days to Cover” chart, updated with the COT data for positions held at the close of COMEX trading on Tuesday, April 7. It shows the days of world production that it would take to cover the short positions of the Big 4 — and Big '5 through 8' traders in every physically traded commodity on the COMEX. This chart is a graphical representation of what's shown in the COT Report above. Click to enlarge.
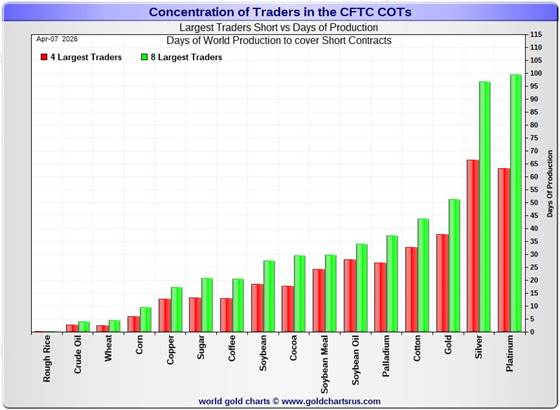
In this week's data, the Big 4 traders are short about 66 days of world silver production...down 1 day from the prior COT report. The ‘5 through 8’ large traders are short an additional 31 days of world silver production...unchanged from last week's report...for a total of 97 days that the Big 8 are short -- and obviously down 1 day from that last COT Report -- and the second week in a row that they have been short less than 100 days of world silver production...a new record low.
Those 97 days that the Big 8 traders are currently short, represents about 3.2 months of world silver production, or 217.035 million troy ounces/43,407 COMEX contracts -- and that's very little. That's down from the 219.970 million troy ounces/ 43,994 contracts in last Friday's COT Report.
In gold, the Big 4 are short about 38 days of world gold production...down 1 day from the prior report -- and the Big '5 through 8' are short an additional 13 days of world production...unchanged from last week, for a total of 51 days of world gold production held short by the Big 8 commercial traders -- and obviously down 1 day from last week. This is lowest number of days short for them that I can remember. Like I've been saying for weeks now...everything is washed out to the downside -- and that fact has to show up in these numbers as well.
With only very small changes in the positions of the Big 4 and '5 through 8' traders in the above COT Reports, there obviously weren't going to be big changes in the the Days to Cover numbers, either -- and there weren't. But what changes there were, were for the better...just like they were last week.
In silver, I suspect that a goodly chunk of the short position in the Big 4 traders category is mostly held by only two traders...both of them U.S. banks.
I note that the short position of the Big 8 traders in platinum is 3 days of world production longer than the Big 8 in silver are short. This chart is also a graphical representation of why I consider platinum be 'da boyz' No. 2 problem child after silver.
The new short position in SLV now sits at 35.34 million shares/troy ounces as of the latest short report that also came out yesterday...for positions held at the close of trading on Tuesday, March 31. It actually rose by 380,000 shares/ troy ounces sold short...up 1.08 percent from the prior report. This 35.34 million share number, which represents 6.50% of total SLV shares outstanding, is not as off-the-charts grotesque and obscene as it used to be -- but realistically should be something less than half that amount.
Don't forget that there's not a single solitary troy ounces of silver backing any of these shorted shares as the SLV prospectus requires.
The next short report...for positions held at the close of business on Wednesday, April 15...is due out on Friday, April 24.
In the overall in yesterday's COT Report, the short positions of the Big 8 commercial traders in silver declined by another tiny amount -- and the set-up in it remains beyond wildly bullish. In gold, the Big 8 also decreased their short position by a bit. The set-up in gold is exceedingly bullish as well, but not quite to the same degree that it is in silver.
As Ted Butler pointed out quite often over the years, the resolution of the Big 4/8 short positions will be the sole determinant of precious metal prices going forward...although that short position in gold held by his raptors continues to be a negative factor as well -- even though it decreased by a bit this week.
And as he also pointed out over the years, there would come a time when what the numbers show in the COT Report won't matter, as events in the real world...whatever they may be...will overtake them. That hasn't happened yet...but the day is coming.
All that we await now, is the denouement that follows. The big bear raids we've endured over the last several months, are all part and parcel of that process.
![]()
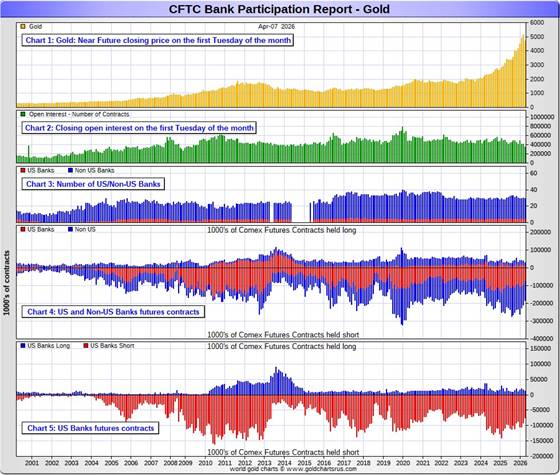
The April Bank Participation Report [BPR] data is extracted directly from yesterday's Commitment of Traders Report data. It shows the number of futures contracts, both long and short, that are held by all the U.S. and non-U.S. banks as of Tuesday’s cut-off in all COMEX-traded products.
For this one day a month we get to see what the world’s banks have been up to in the precious metals. They’re usually up to quite a bit -- and they certainly were again this past month.
[The April Bank Participation Report covers the five-week time period from March 3...to April 7 inclusive]
In gold, 5 U.S. banks are net short 61,596 COMEX contracts, down a further and hefty 15,586 contracts from the 77,182 contracts that these same 5 U.S. banks were net short in the March BPR. This is their lowest short position since April 2024.
Also in gold, 24 non-U.S. banks are net short 93,441 COMEX contracts, down a further 1,592 contracts from the 95,033 contracts that 25 non-U.S. banks were short in March's BPR. This is their smallest short position since the February 2025 BPR.
At the low back in the August 2018 BPR...these non-U.S. banks held a net short position in gold of only 1,960 contacts -- so they've been back on the short side in a gargantuan way ever since. Only a handful of these banks hold meaningful short positions in gold. The short positions of the rest are of no consequence -- and never have been.
Although most of the largest U.S. and foreign bullion banks are in the Big 8 short category, some of the hedge fund/commodity trading houses are short grotesque amounts of gold in that category as well. There's also the possibility that the BIS could be short gold in the COMEX futures market as well.
As of April's Bank Participation Report, 29 banks [both U.S. and foreign] were net short 43.7 percent of the entire open interest in gold in the COMEX futures market...up from the 42.0 percent that 30 banks were net short in the March BPR. The reason that the percentage is up is because of the implosion of total open interest, which obviously affects the percentage calculation.
And if you remember from the above COT Report, the commercial net short position in gold was 54.6 percent of total open interest -- and if you subtract out the 43.7 percent held short by the banks...only 54.6-43.7=10.9 percentage points of the commercial net short position are not held by the banks.
Here’s Nick’s BPR chart for gold going back to 2000. Charts #4 and #5 are the key ones here. Note the blow-out in the short positions of the non-U.S. banks [the blue bars in chart #4] when Scotiabank’s COMEX short position was outed by the CFTC in October of 2012. Click to enlarge.
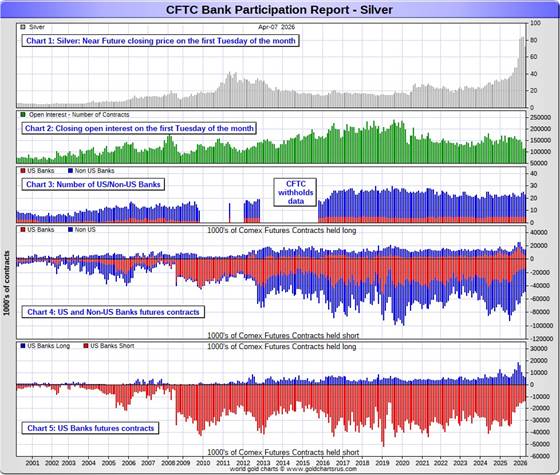
In silver, 5 U.S. banks are net short 7,356 COMEX contracts...up 223 contracts from the 7,133 contracts they were net short in the March BPR.
But the number I really wanted to see was the change in their gross short position. In the December BPR it was 17,838 contracts, in January's it was 15,099 contracts, in February's it was 15,414, in March's, it was down to 14,048 contracts -- and in April it was 13,427 COMEX contracts. So slowly but surely the continue to whittle it away. However, there is that problem of the law of diminishing returns that I keep mentioning -- and there's a limit to how much more they'll be able to cover.
The five U.S. banks that are net short silver would be Citigroup, Wells Fargo, Bank of America, Goldman Sachs -- and Morgan Stanley...with by far the lion's share held by no more than two of these banks...most likely BofA and Wells Fargo.
Also in silver, 18 non-U.S. banks are net short 27,076 COMEX contracts, down a further 1,487contracts from the 28,563 contracts that 20 non-U.S. banks were net short in the March BPR.
It's a given, based on silver deliveries in 2025 -- and so far in 2026...that HSBC, Barclays, Standard Chartered, BNP Paribas, Deutsche Bank and Macquarie Futures hold by far the lion's share of the short positions of these non-U.S. banks. Canada's Bank of Montreal is a card-carrying member of this group as well.
And, like in gold, the BIS could also be actively shorting silver. However, the remaining short positions divided up between the rest of the small handful of non-U.S. banks, are immaterial — and have always been so....the same as most of the 20-odd non-U.S. banks in gold as well.
As of April's Bank Participation Report, 23 banks [both U.S. and foreign] were net short 29.9 percent of the entire open interest in silver in the COMEX futures market — up from the 25.2 percent that 25 banks were net short in the March BPR. The reason for that big percentage jump is the same as it was for gold...an implosion of total silver open interest.
Here’s the BPR chart for silver. Note in Chart #4 the blow-out in the non-U.S. bank short position [blue bars] in October of 2012 when Scotiabank was brought in from the cold. Also note August 2008 when JPMorgan took over the silver short position of Bear Stearns—the red bars. It’s very noticeable in Chart #4—and really stands out like the proverbial sore thumb it is in chart #5. Click to enlarge.
In platinum, 5 U.S. banks are net short 9,773 COMEX contracts in the April BPR, up a further 610 contracts from the 9,163 contracts that these same 5 U.S. banks were short in the March BPR. This is the seventh month in a row that these U.S. banks have added to their short position in platinum.
At the 'low' back in September of 2018, these U.S. banks were actually net long the platinum market by 2,573 contracts...so they still have a bit more work to do to get back to market neutral...if they ever intend to.
Also in platinum, 17 non-U.S. banks decreased their net short position by a piddling 386 contracts... from 12,942 contracts held by 16 banks in March's BPR...down to 12,556 contracts in the April BPR. This is 5.14x the amount they held short in the May/25 BPR, so they've been gone back on the short side in platinum by a huge amount since then.
Back in the December 2023 BPR, these non-U.S. banks were net short a microscopic 35 platinum contracts...so they have yeoman work to do if they ever want to get back to even close to that number. I doubt that they'll ever accomplish that -- and are permanently stuck with this short position.
As you know, platinum remains the big commercial shorts No. 2 problem child after silver -- and there's now a long-term structural deficit in it [and palladium] as well.
As of April's Bank Participation Report, 22 banks [both U.S. and foreign] were net short 37.3 percent of platinum's total open interest in the COMEX futures market, up from the 31.5 percent that 21 banks were net short in March's BPR. That big percentage increase is for the same reason as the increases in silver and gold.
Here's the Bank Participation Report chart for platinum. Click to
enlarge.
In palladium, 4 U.S. banks are now back on the short side by 422 COMEX contracts in the April BPR, after being net long 153 contractsin the March BPR.
Also in palladium, 10 non-U.S. banks are net short by 943 COMEX contracts... a decrease of 820 contracts from the 1,763 contracts that these same 10 non-U.S. banks were net short in the March BPR.
None of this mean anything considering how microscopic the amounts are...especially when divided up between 14 banks.
And as I've been commenting on for almost forever, the COMEX futures market in palladium is a market in name only, because it's so illiquid and thinly-traded. Its total open interest in yesterday's COT Report was only 15,187 contracts...compared to 59,884 contracts of total open interest in platinum...115,138 contracts in silver -- and 354,877 COMEX contracts in gold...down a hefty 54,912 contracts from March's BPR.
Total open interest in palladium has increased quite a bit over the last ten years, because I remember when it was less than 9,000 contracts on average. So it's nowhere near as illiquid as it used to be -- and it's also been helped along by the fact that the bid/ask is now down to only 40 bucks. It used to be $150 at one point way back when.
As I say in this spot every month, the only reason that there's a futures market at all in palladium, is so that the Big 8 commercial traders can control its price. That's all there is, there ain't no more.
As of this Bank Participation Report, 14 banks [both U.S. and foreign] are net short 8.9 percent of total open interest in palladium in the COMEX futures market...down a bit from the 10.0 percent of total open interest that 16 banks were net short in the March BPR.
For the last 5 years or so, the world's banks have not been involved in the palladium market in a material way...see its chart below. Even with all the world's banks back on the short side by a bit now...it's almost all hedge funds and commodity trading houses on the short side.
The Big 8 shorts, none of which are banks, are net short 45.1 percent of total open interest in palladium as of yesterday's COT Report.
Here’s the palladium BPR chart -- and it remains to be seen if they return as big short sellers again at some point like they've done in the past. Click to enlarge.
Excluding palladium, most likely no more than a dozen or so in total -- and mostly U.S. and U.K.-based...along with French bank BNP Paribas and Deutsche Bank...continue to hold meaningful short positions in the other three precious metals...although I won't let Canada's Bank of Montreal or Australia's Macquarie Futures off the hook just yet.
As I pointed out above, some of the world's commodity trading houses and hedge funds are also mega net short the four precious metals...far more short than the banks in some cases. They have the ability to affect prices if they choose to exercise it. But it's still the collusive Anglo/American/Western bullion bank cartel in the commercial category that are at Ground Zero of the price management scheme in the COMEX futures market.
And as has been the case for several decades now, the short positions held by the Big 4/8 traders is the only thing that matters...especially the short positions of the Big 4...or maybe only the Big 1 or 2 in silver. How this is ultimately resolved [as Ted kept pointing out] will be the sole determinant of precious metal prices going forward.
Considering the current state of affairs of the world as they stand today -- and the structural deficit in silver -- and now in platinum and palladium as well, the chance that these big bullion banks and commodity trading houses could get overrun at some point, is no longer zero -- and certainly within the realm of possibility if things go totally non-linear somewhere.
But...as Ted kept reminding us...if they do finally get overrun, it will be for the very first time. And it was patently obvious that the collusive commercial traders of whatever stripe had to step in multiple times over the last three months in order to prevent exactly that from happening. If they hadn't, Ted Butler's "Bonfire of the Silver Shorts" would have become a reality within days...if not hours.
The next Bank Participation Report for trading in April is due out on Friday, May 8.
![]()
CRITICAL READS
Consumer prices rose 3.3% in March, as energy prices spiked due to Iran conflict
Consumer prices spiked in March as the Iran war sent energy costs soaring and took the Federal Reserve further from its inflation target, according to a Bureau of Labor Statistics report Friday. Underlying inflation, however, was relatively tame.
The consumer price index increased a seasonally adjusted 0.9% for the month, putting the annual inflation rate at 3.3%, pushed by a 10.9% surge in energy costs. Both numbers were in line with the Dow Jones consensus. The annual rate was the highest since April 2024 and up from 2.4% in February.
However, excluding food and energy, core prices rose much less – just 0.2% for the month and 2.6% from a year ago, both 0.1 percentage point below forecast, indicating that underlying inflation was contained. There even were even pockets of outright price declines, as medical care, personal care, and used cars and trucks all fell during the month.
The Iran conflict was the story for the monthly inflation reading, as gasoline soared 21.2%, accounting for nearly three-quarters of the headline price increase, according to the BLS.
Well, dear reader, you can rest assured that all these numbers have been massaged to perfection. This news story was posted on the cnbc.com Internet site at 8:31 a.m. EDT on Friday morning -- and it comes to us courtesy of Swedish reader Patrik Ekdahl. Another link to it is here.
![]()
UMich Sentiment Crashes to Lowest on Record as War Sparks Inflation Panic Among Democrats
While the March UMich sentiment survey was completed before and after the start of the Iran War (with only modest impacts on sentiment and inflation expectations), today's preliminary April data survey period was all in the war with expectations for a notable drop in sentiment and sizable jump in inflation expectations.
It turns out the expectations were right in direction but underestimated the scale as headline sentiment plunged from 53.3 to 47.6 (far worse than the 51.5 expected) with Current Conditions (50.1 vs. 53.4 expected vs. 55.8 prior) and Expectations (46.1 vs. 50.2 expected vs. 51.7 prior)...
That is a record low for the headline sentiment and Current Conditions and lowest print for Expectations since 1980.
Demographic groups across age, income, and political party all posted setbacks in sentiment, as did every component of the index, reflecting the widespread nature of this month’s fall.
One-year expected business conditions plunged about 20% and is now 6% below last April.
Assessments of personal finances declined about 11%, with consumers expressing a substantial increase in concerns over high prices and weaker asset values.
Year-ahead inflation expectations surged from 3.8% in March to 4.8% this month, the largest one-month increase since April 2025, but longer-term expectations rose only modestly...
This brief 3-chart Zero Hedge story appeared on their website at 10:12 a.m. on Friday morning EDT -- and another link to it is here.
![]()
It was a week befitting the CBB theme for 2026: Expect the Unbelievable. And what a difference a few hours can make: The President’s “a whole civilization will die tonight, never to be brought back again,” as the vice president campaigned in Budapest for Viktor Orban - to “I agree to suspend the bombing and attack of Iran for a period of two weeks… We received a 10-point proposal from Iran, and believe it is a workable basis on which to negotiate. Almost all of the various points of past contention have been agreed to between the United States and Iran, but a two-week period will allow the Agreement to be finalized and consummated… It is an Honor to have this Longterm problem close to resolution.”
Trading Tuesday afternoon to $117.63, WTI (July futures) almost touched $95 early in Wednesday’s session (“biggest drop since 2020”). The S&P500 gapped 2.7% higher at Wednesday’s open, with the Nasdaq100 and small cap Russell 2000 gapping 3.5%. The MAG7 Index surged 4.2%. Financial stocks were even stronger. The KBW Bank Index gapped up 4.4% and the Broker/Dealers 4.5%.
After trading at 28 during Tuesday’s session, the VIX (equities volatility) Index sank to 21 at Wednesday’s open. European stock market moves were even more dramatic. Germany’s DAX Index gapped 5.0% higher, with France’s CAC40 jumping 4.3%. Italy’s MIB and Spain’s IBEX indices gapped 4.2% and 4.1%. UK FTSE 100 Index opened 3.0% higher. European banks (STOXX 600) gapped up 6.0%, ending the week 6.5% higher. European (subordinated) Bank CDS sank from 125 to 108 bps.
European bond moves were just as dramatic. After trading to 4.00% in Tuesday trading, Italian 10-year yields opened Wednesday trading 39 bps lower at 3.61%. Greek yields sank from 3.93% all the way down to 3.59%. France’s 10-year yield was at 3.80% on Tuesday, only to sink to Wednesday’s 3.51% low. German yields dropped from 3.09% to 2.90%. UK gilt yields sank 26 bps to 4.68%.
Acute volatility across asset markets was a global phenomenon. Japan’s Nikkei spiked 4.8% at Wednesday’s open. For South Korea’s KOSPI Index, it was a 6.0% gap open. Taiwan’s TAIEX saw 4.0% - and 3.0% for Australia’s ASX200.
Doug's weekly commentaries are always a must read for me -- and this week's showed up on his website around midnight PDT last night. Another link to it is here.
![]()
Iran war has caused lasting damage to the dollar system
The U.S.’s war with Iran has put a potentially irreversible strain on the global trading system, with gold reserves having eclipsed central bank holdings of valuation-adjusted dollar assets for the first time in several decades.
It’s very early days after the announcement of a ceasefire between the U.S. and Iran, yet even if it holds, the conflict is likely to have created lasting effects on the dollar system as President Donald Trump appears to rip up the rules-based order in place since World War II.
The dollar’s demise has been greatly exaggerated on many previous occasions. But it will not be a dramatic point-in-time event. Sterling’s fading as a reserve currency was punctuated by several milestones over an extended period — the end of World War I, coming off the Gold Standard, Bretton Woods and the Suez crisis.
After the increasing weaponization of the dollar, culminating in the seizure of Russian assets in the wake of the war in Ukraine, and the mooting of a Mar-a-Lago accord, the U.S. currency has just passed another milestone in its declining dominance.
This Bloomberg story from Wednesday was picked up by the moneycontrol.com Internet site -- and I found it embedded in a GATA dispatch. Another link to it is here.
![]()
Red in Tooth and Claw -- Bill Bonner
“Raising the stakes so high beforehand, he [Trump] maximized the damage to [...] global perceptions of U.S. power...this is a clear strategic defeat for the U.S.” — Jennifer Kavanagh, the former director of RAND’s Army Strategy program
The costs are being tallied. The bills are coming in.
The Telegraph led off with an important question: What has Trump’s Iran War achieved?
Not much, was the answer. Stuff has been blown up. People were killed. So great was the destruction that you would hardly look at Iran today and call it a ‘winner.’ When the U.S. and Israel set out to blow stuff up, they do a pretty good job of it.
But compared to what Trump threatened — the ‘end of a civilization’ — the country got off easy. The civilization in question has been around approximately 5,800 years longer than the US. And it doesn’t seem to be going anywhere, any time soon. There are still 90 million people in the country. They still may have enriched uranium. And now they have tighter control of the Strait of Hormuz...and have discovered how to use it.
Most important, they are still alive. This point must have weighed on them as they considered their options. Donald Trump had given them a choice. Either do as he said...or die.
This interesting and worthwhile article from Bill put in an appearance on his website at 9:15 a.m. EDT on Friday morning -- and I thank Roy Stephens for pointing it out. Another link to it is here.
![]()
Three informative and worthwhile video interviews
1. After the Iran War: A New Global Economy -- Alex Krainer
This worth watching 49-minute video interview with former hedge fund manager and author Alex Krainer was hosted by Professor Glenn Diesen very early on Friday morning EDT -- and I thank Guido Tricot for sharing it with us -- along with the two that follow. The link to this one is here.
2. World Changed Forever as Iran Defeated the U.S. -- Professor John Mearsheimer
This is another interview with host Professor Diesen -- and this time it's with Professor Mearsheimer. This one runs for 1 hour 29 minutes. I haven't watch it yet, but will absolutely do so over the weekend -- as I have all the time in the world for whatever this man has to say. It was posted on the youtube.com Internet site on Friday afternoon -- and the link to it is here.
3. INTEL Roundtable w/ Larry Johnson & Special Guest for Ray - Scott Ritter!
This very worthwhile 31-minute video interview with former CIA analyst Johnson -- and former U.S. Marine intelligence officer and former U.N. weapons inspector Ritter was hosted by Judge Andrew Napolitano late on Friday afternoon EDT -- and it's also definitely worth your time if you have the interest. The link to it is here.
![]()
Tennessee rejects dangerous government-backed 'transactional gold' boondoggle
Lawmakers in Tennessee delivered yet another blow to government "transactional gold" schemes today when the state legislature rejected harmful legislation, joining more than a dozen other states, including Georgia, Kansas, Arizona, West Virginia, Indiana, Kentucky, South Dakota, Idaho, Mississippi, Wyoming, and Michigan, in abandoning these schemes.
House Bill 2427 and Senate Bill 1813 would have created an entangling, government-run gold depository, investment, and payment system in the Volunteer State, directly competing with private firms that are already successfully offering these services in Tennessee and nationwide.
The rest of this gold-related article showed up on the moneymetals.com Internet site on Thursday -- and is another item I found embedded in a GATA dispatch. Another link to it is here.
![]()
A new gold rush: States stockpile bars, encourage gold-backed debit cards
More states are piling up gold bars, or encouraging residents to use gold-backed debit cards, to hedge against inflation.
Several states, including Western ones with rich mining histories, have been stockpiling gold as part of their broader state savings. And more states are looking to follow the lead of Texas and Florida by passing so-called transactional gold laws that would invite consumers to save and spend gold through their own accounts.
Critics question the need for these bills and some have panned them as potentially market-disrupting measures that could ultimately provide tax havens for the wealthy. But proponents say they can help bring gold to the masses and provide ordinary consumers an important protection against the creep of inflation, since gold has generally increased in value over time.
"Inflation is the carbon monoxide that you can't see, taste, or smell," said Georgia state Sen. Marty Harbin, a Republican who this year sponsored bipartisan legislation that would have established gold and silver as legal tender and created an electronic payment system.
The state Senate approved that bill but it didn't advance beyond a House committee. Harbin said he expects to reintroduce it next session.
The rest of this story is posted on the stateline.org Internet site. It showed up there on Friday -- and is yet another article I found on the gata.org website. Another link to it is here.
![]()
Dunagun Kaiser of Liberty & Fiance fame interviews your humble scribe
Dunagun and I had a 34-minute chat on Wednesday -- and it was all about the precious metals...silver in particular. It was posted on the youtube.com Internet site on Thursday -- and the link to it is here.
![]()
All that glitters flows east again: Asia buys gold dip
Global gold ETFs recorded a 21-tonne inflow in early April, according to the World Gold Council, helping steady the market after March delivered a record monthly outflow.
The WGC said US$12 billion in March outflows halved global Q1 inflows into physically-backed gold ETFs.
Globally, gold ETFs shed US$12 billion (84 tonnes) during March, driven almost entirely by North America (US$14 billion) and Europe (US$0.1 billion).
“Asia’s US$1.9 billion inflows were a welcome positive, and highlight how dip-buying in Asia translated into much larger fund flow but lower equivalent tonnes.
“Prior to March, global gold ETFs were on track for their strongest quarter on record; nevertheless, the volatile start to the year still marked a seventh consecutive quarter of net inflows,” the latest market commentary said.
While holdings suffered their largest monthly decline since September 2022 in March, total ETF holdings still rose 62 tonnes over the first quarter.
“Despite the pullback in the gold price, global gold ETFs ended the quarter with US$606 billion in assets under management, 9 per cent above FY25 levels.”
This gold-related story from Friday on the investorydaily.com.au Internet site was something I found on Sharps Pixley -- and another link to it is here.
![]()
QUOTE of the DAY

![]()
The WRAP
"Understand this. Things are now in motion that cannot be undone." -- Gandalf the White
![]()
Today's pop 'blast from the past' was released the year I graduated from high school...1966 -- and was the lead single of this American sunshine pop band from Los Angeles, prior to their debut album. It was a huge hit then -- and is still a classic today. The link is here. Of course there's a bass cover to this -- and it's fairly intricate. The guy laying it down is a kick-ass bass player -- and the link to that is here.
Today's classical 'blast from the past' had 43 million views when I posted it last -- and it's now up to 47 million. It's not just work...Rachmaninoff's Piano Concerto No. 2 in C minor, Op. 18...but it's the performance itself...the interpretation by the soloist -- and the orchestra that accompanies it. When they are like one, as they are here...it's magic.
It's premiere on 09 November 1901 in Moscow was an astounding success -- and Rachmaninoff enjoyed wild acclaim. British/Australian concert pianist Stephen Hough, in an article for The Guardian posited that the composition is "his most popular, most often performed and, arguably, the most perfect structurally. It sounds as if it wrote itself, so naturally does the music flow."
Here's 23-years young Anna Federova at the Concertgebouw in Amsterdam on 01 September 2013. The Nordwestdeutsche Philharmonie accompanies -- and Maestro Martin Panteleev conducts this 'great fall upwards'. The link is here.
![]()
It was another day of ultra low volume in gold -- and fumes & vapours volume [literally] in silver...so those collusive commercial traders of whatever stripe had no difficulty whatsoever in engineering their prices lower whenever it suited them -- and of course they were all over both silver and gold starting around 10:30 a.m. in COMEX trading in New York. They would have certainly closed materially higher. Open interest in both remain at decade-plus lows.
But once again, despite the fact that gold closed down on the day -- and silver closed up...'da boyz' were there to ensure that the silver stocks underperformed the gold shares once again.
Platinum was prevented from closing above its 50-day moving average for the third day in a row -- and 'da boyz' now have palladium back to half-way between its 50 and 200-day moving averages, after handing it its second hefty loss in as many days.
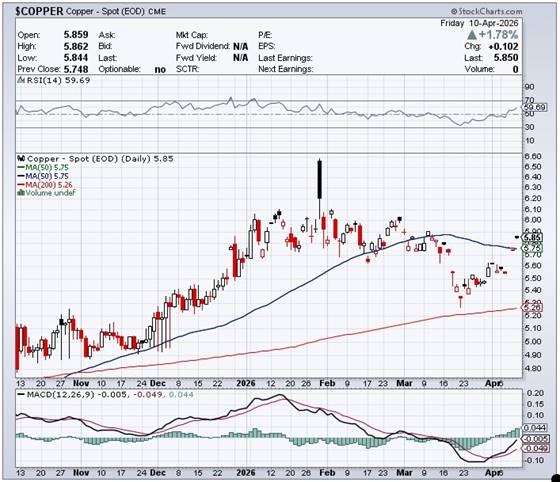
Copper had another big day...closing up a further 10.2 cents at $5.85/pound -- and is now back above its 50-day moving average by a dime.
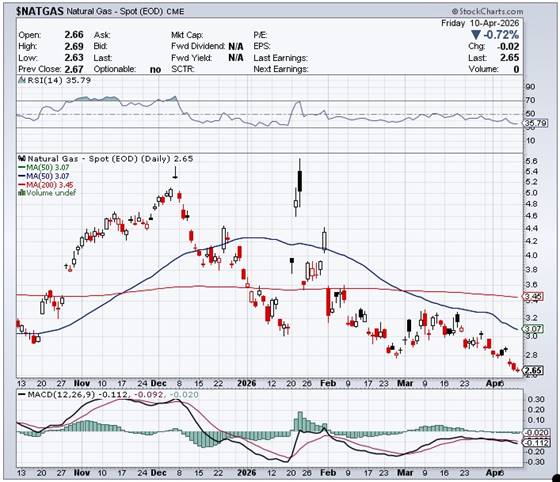
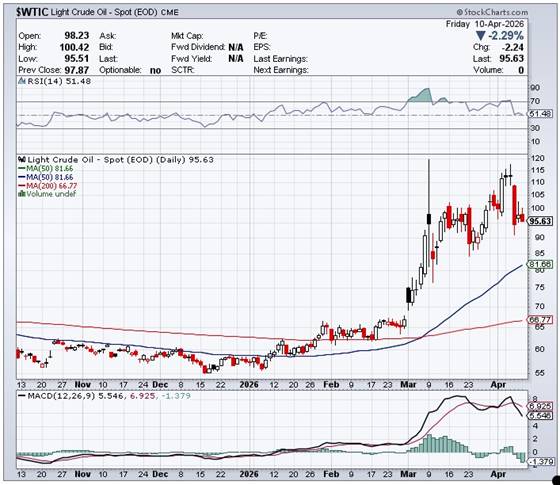
Natural gas [chart included] continues its quiet downward path, as it closed lower by a further 2 cents at $2.65/1,000 cubic feet. WTIC gave back all of Thursday's gain...plus a bit more, as it closed down $2.24 at $95.63/barrel.
Here are the 6-month charts for the Big 6+1 commodities, courtesy of stockcharts.com as always. Once again, the Friday candle for silver doesn't show its entire intraday move. Click to enlarge.
This war in the Middle East/Clash of Civilizations is on hold at the moment -- and the jury remains out on whether this so-called ceasefire will last or not. As George Orwell stated..."The war is not meant to be won...it is meant to be continuous."
But regardless of that, the full economic impact of the closing of the Straits of Hormuz have yet to be felt by most citizens of North America...except for higher gas prices at the moment. But one of my subscribers here in Canada, a farmer, is scrambling for fertilizer -- and what little is available is far higher in price than it was a month ago. It can't get all he wants from one supplier, either.
The situation is far more dire with some nations in the Far East -- and Europe is in big trouble. The full effects of the events in the Middle East will really start hit home on a global scale starting in the next few weeks. How this will unfold is hard to predict -- and I shan't speculate.
But one thing is now blatantly obvious to all -- and that is the U.S. has reached the limits of its power -- and its ability to project that power overseas. It's also obvious that the old world order with the U.S. as the world's hegemon, is in the process of being swept away -- and the western globalist elite/Epstein class are in peril. It's now every nation state for itself. Will the European Union and NATO survive this, is another question being asked at the moment.
The result of all this is the beginning of a new world order of some kind -- and over time we'll see if China and the rest of the BRICS+ nations are able to rise above all this. All we can do as mere citizens, is sit back and hope that we survive it.
At the moment, the Fed -- and the rest of the members of the President's Working Group on Financial Markets/PPT have been busy. The fact that the stock markets, treasury yields and the dollar index are still hanging in there, is because they are aggressively intervening in all these markets -- and in overseas markets where and when deemed necessary.
Of course that intervention extends into the precious metals market, as you very well know -- and the fact that they are now heavily and obviously managing their stock prices is a new wrinkle that has appeared.
That began sometime last year, but became obvious in mid September when the correlation between the silver price and its associated equities went off the rails. They tried to be subtle about it for a few months after that...but since the war started, they are not even trying to hide what they're doing.
That was glaringly obvious on Thursday at 9:30 a.m. EDT -- and again on Friday when they intervened three or four minutes after the equity markets opened. How long they intend to keep this up is unknown.
However, everything precious metal-related will remain in lock-down mode for as long as necessary, as it appears that the financial powers-that-be are obviously preparing for something.
If they weren't, then the Big 8 shorts...mostly western bullion banks...wouldn't have been moving heaven and earth to reduce their short positions as low as possible over the last nine or so months, which is something I've been documenting every week in the COT Report and in the monthly Bank Participation Reports. It was obvious once again in both these reports that came out yesterday as well.
If the end of this price management scheme wasn't in our futures, then 'da boyz' wouldn't care how big their short positions got...but that's obviously not the case.
Another straw in the wind were those huge and totally counterintuitive rallies that broke out at the Globex open in New York on Tuesday evening. I now suspect that this was a massive and coordinated short covering rally. As I've been pointing out, the law of diminishing returns had set in for 'da boyz' to gain anything on any further engineered price declines, because total open interest is now at decade-plus lows...so they bought big on Tuesday night when they knew others would be dumping precious metals futures contracts when 'peace' broke out.
And because that event happened after the Tuesday cut-off for yesterday COT & Bank Participation Reports, what they were able to accomplish won't be known until next Friday.
The numbers don't lie. They indicate that the western financial elite are preparing for the end of this price management scheme. Rampant inflation, along with the money printing that accompanies it, is now baked in the cake because of this war in the Middle East...the full affects of which will become apparent as the year progresses.
Now that these genies are out of their bottles...there's no turning back. As that Gandalf the White quote that has appeared in my Saturday column for years states..."Things are now in motion that cannot be undone." -- and they are.
Regardless of the fact that the collusive commercial shorts have the precious metals and their equities on the shortest of leashes, at least for the moment...it's obvious that everything else in the world is in the process of going off the rails. For those reasons alone, I'm still happy to be "all in" -- and will remain so to whatever end.
I'm done for the day -- and the week -- and I'll see you here on Tuesday.
Ed
About the author

SUBSCRIBE: https://edsteergoldsilver.com/

Ed Steer’s Daily Analysis of the Gold and Silver Markets
After eight years of writing about the precious metals for Casey Research, the folks at Stansberry & Associates—who just recently purchased controlling interest in the company—decided that my ‘niche market’ column didn’t fit into their plans.
Since the time that Casey Research was kind enough to offer me a stand-alone column, it became their most highly-rated blog almost from the outset—and has remained that way up to this date...