YESTERDAY in GOLD, SILVER, PLATINUM and PALLADIUM
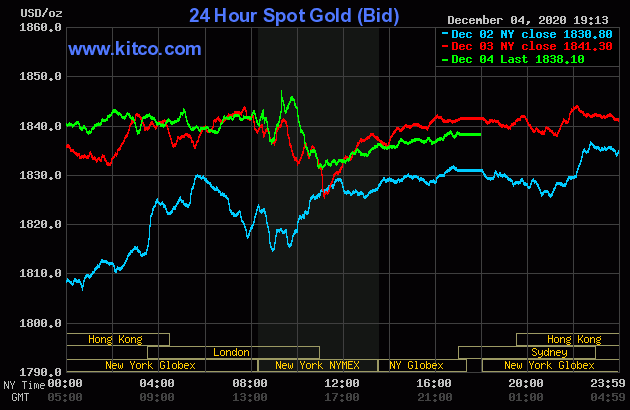
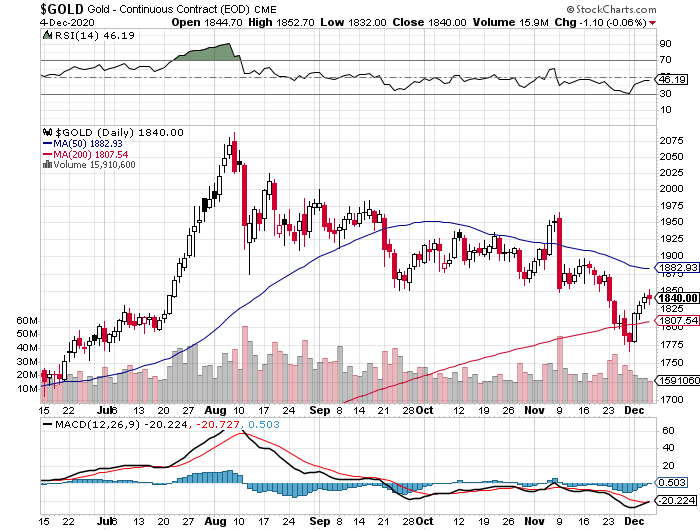
The gold price certainly didn't do much yesterday in Far East and London trading, but its rally into the 10 a.m. EST afternoon gold fix in London was dealt with in short order -- and it was sold lower until a few minutes before the 11 a.m. EST London close. It crawled quietly higher from that point until trading ended at 5:00 p.m. in New York.
The high and low ticks were reported as $1,852.70 and $1,832.00 in the February contract. The February/April price spread differential in gold at the close yesterday was $4.00...April/June was $2.70 -- and June/August was only $2.30.
Gold was closed in New York on Friday afternoon at $1,838.10 spot, down $3.20 on the day. Net volume was very light at a hair under 159,000 contracts -- and there was a tiny bit under 13,000 contracts worth of roll-over/switch volume on top of that.
|
|
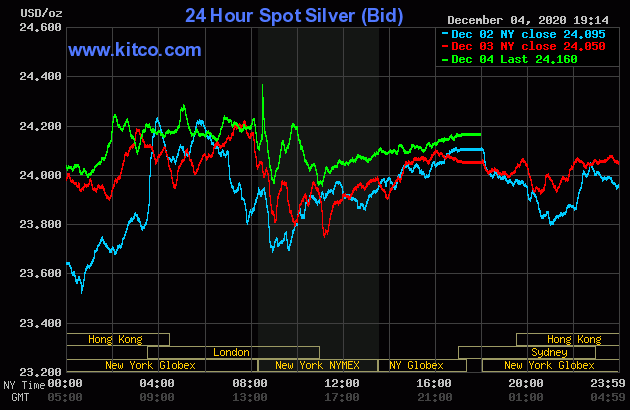
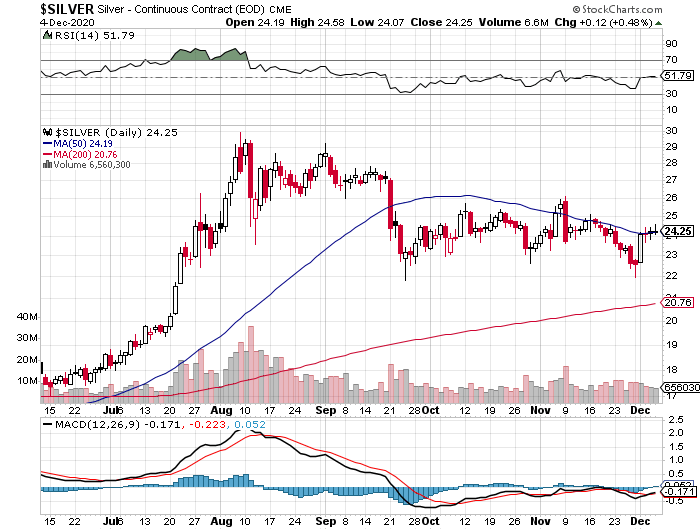
The silver price chopped mostly sideways in Far East trading on their Friday, but that all ended when it took off higher starting shortly before 2 p.m. China Standard Time on their Friday afternoon. That rally was capped and turned sideways minutes after 3 p.m. CST -- and it then went back to chop nervously sideways until the jobs numbers hit the tape at 8:30 a.m. in New York. There was a flurry of price activity at that juncture but, like gold, its price was handled in a similar fashion for the remainder of the Friday session.
The low and high ticks in silver were recorded by the CME Group as $24.065 and $24.585 in the March contract. The March/May price spread differential at the close yesterday was 6.3 cents...May/July was also 6.3 cents -- and July/September was 5.5 cents.
Silver was closed on Friday afternoon in New York at $24.16 spot, up 11 cents from Thursday -- and 33 cents off its Kitco-recorded high tick of the day. Net volume was slightly elevated at around 65,500 contracts -- and there was about 3,400 contracts worth of roll-over/switch volume in this precious metal.
|
|
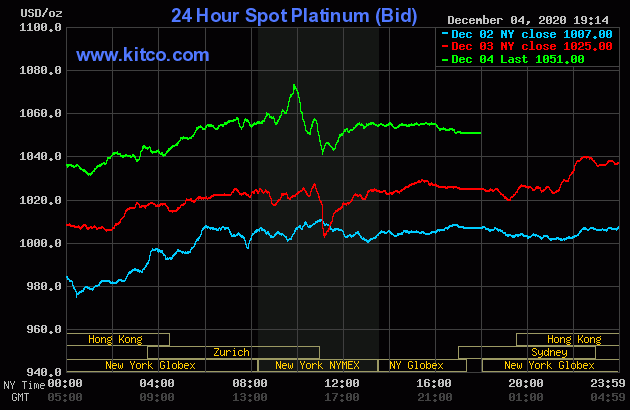
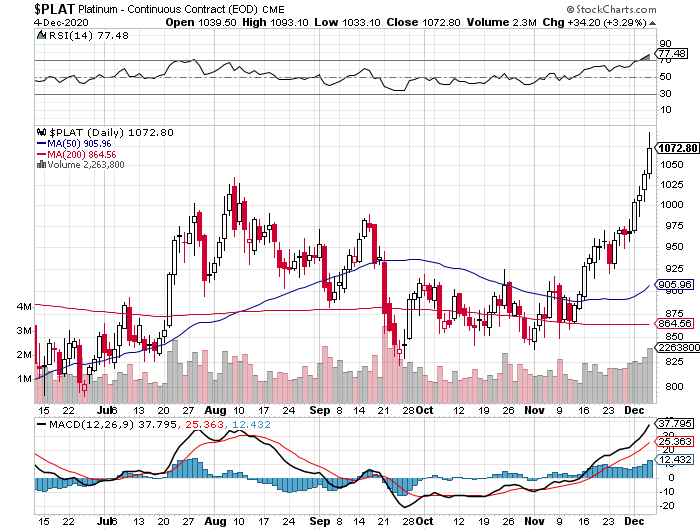
The platinum price rallied a bit in morning trading in the Far East -- and from 11:30 a.m. CST, until 2 p.m. CST, it traded pretty flat. A quiet rally commenced at that point, but really began to sail at 9 a.m. in New York. Someone put a fork in that, like they did in silver and gold, at or minutes before the afternoon gold fix in London. It was sold lower until minutes after the 11 a.m. EST Zurich close -- and then crept a bit higher for the next hour, before trading flat until trading ended at 5:00 p.m. EST. Platinum was closed at $1,051 spot, up 26 bucks on the day...but 33 dollars off its Kitco-recorded high tick.
|
|
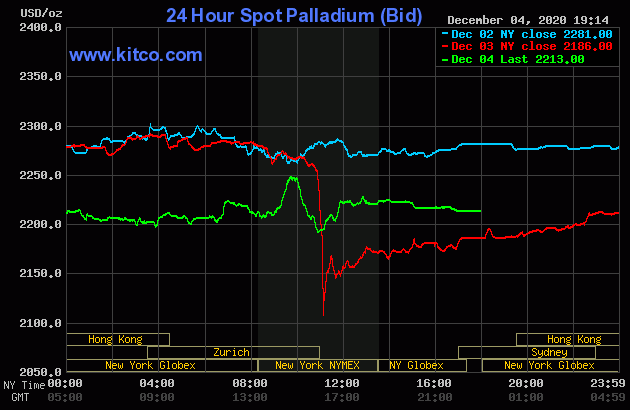
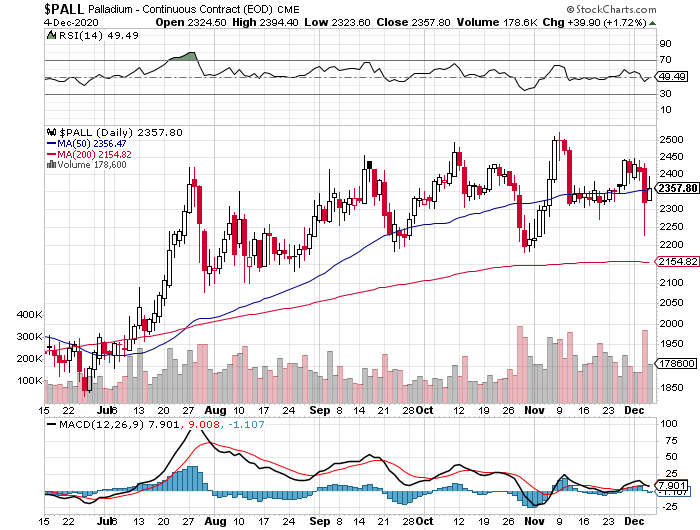
Palladium crawled higher until around noon in Shanghai on their Friday -- and then didn't do much of anything until 9 a.m. in New York. From that juncture its price was managed in the same manner as platinum's. Palladium was closed at $2,213 spot, up 27 dollars on the day -- and miles off its Kitco recorded high tick.
|
|
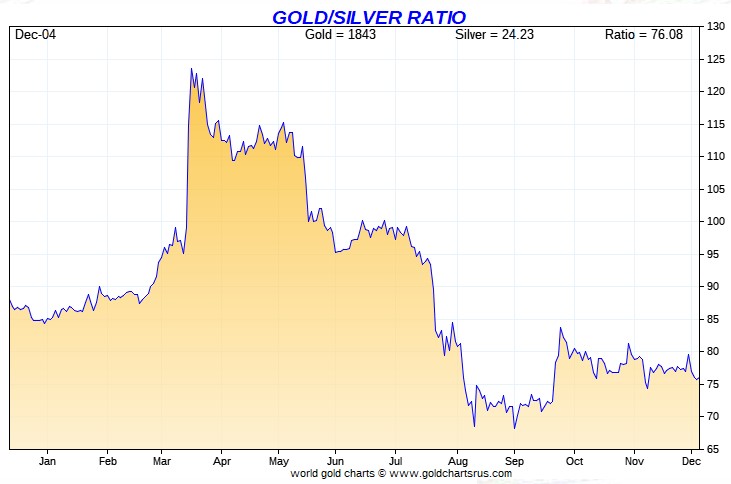
Based on the kitco.com spot closes posted above, the gold/silver ratio worked out to 76.1 to 1 on Friday...compared to 76.6 to 1 on Thursday.
And here's Nick's 1-year Gold/Silver Ratio chart. Click to enlarge.
|
|
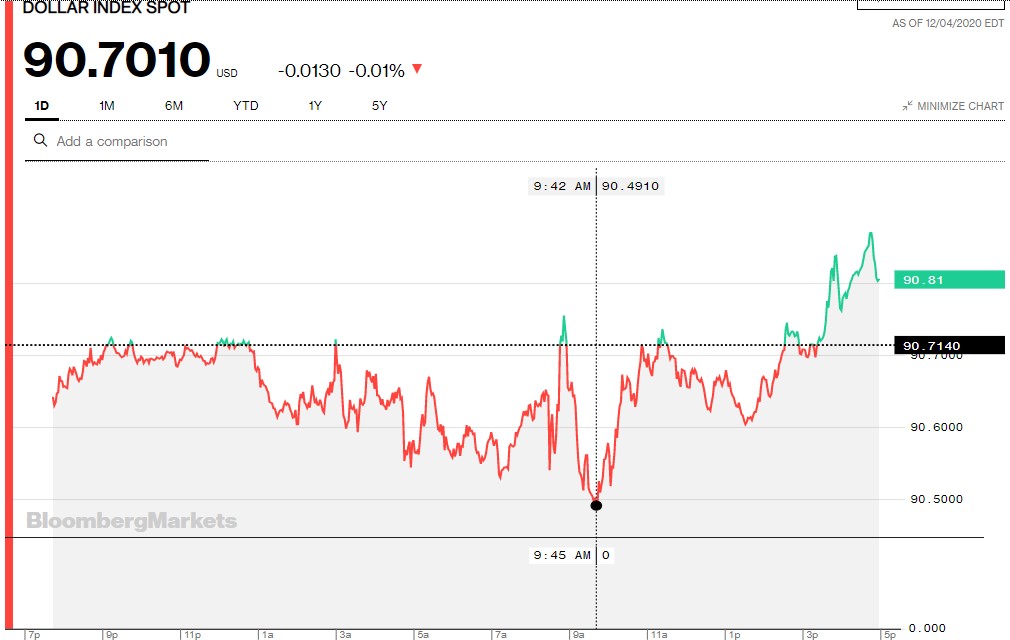
The dollar index was marked-to-close in New York on Friday afternoon at 90.701...down 1.3 basis points from its close on Thursday...and 11 basis points below its indicated close on the DXY chart below.
Here's the DXY chart for Friday, courtesy of Bloomberg as usual. Click to enlarge.
|
|
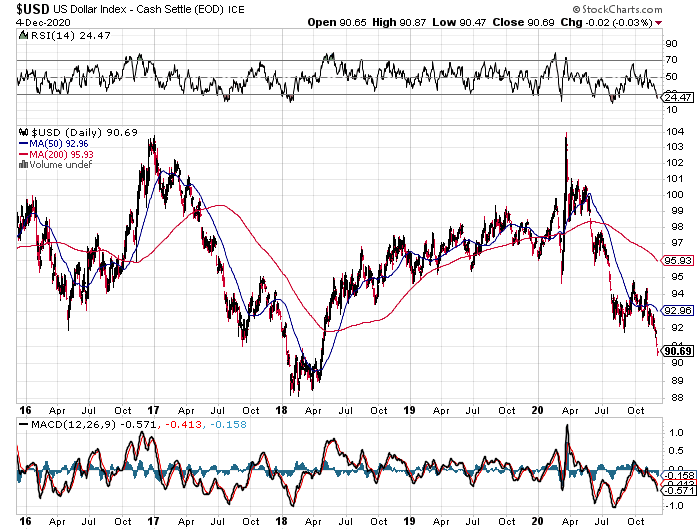
And here's the 5-year U.S. dollar index chart that appears in this spot in every Saturday column, courtesy of the fine folks over at the stockcharts.com Internet site. The delta between its close...90.69...and the close on the DXY chart above, was around 1 basis point below its spot close on Friday. Click to enlarge as well.
|
|
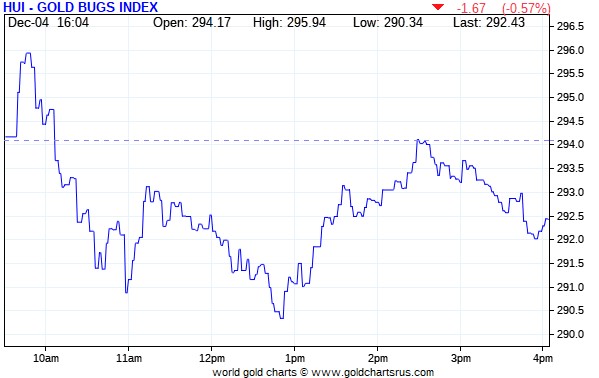
The gold stocks opened a bit higher once trading began at 9:30 a.m. in New York on Friday morning. But like on Thursday, the selling pressure appeared shortly after that -- and their respective low ticks were set around 12:45 p.m. EST. Although they rallied back to the unchanged mark around 2:30 p.m....they couldn't hold on, even though the gold price continued to inch higher. The HUI closed lower by 0.57 percent.
|
|
|
|
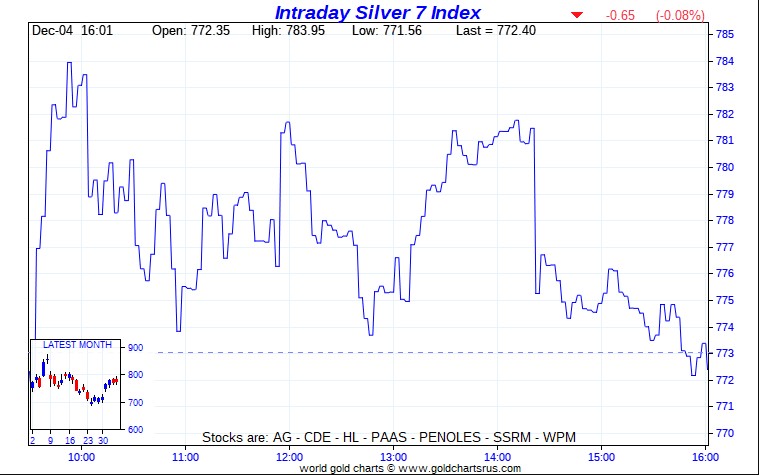
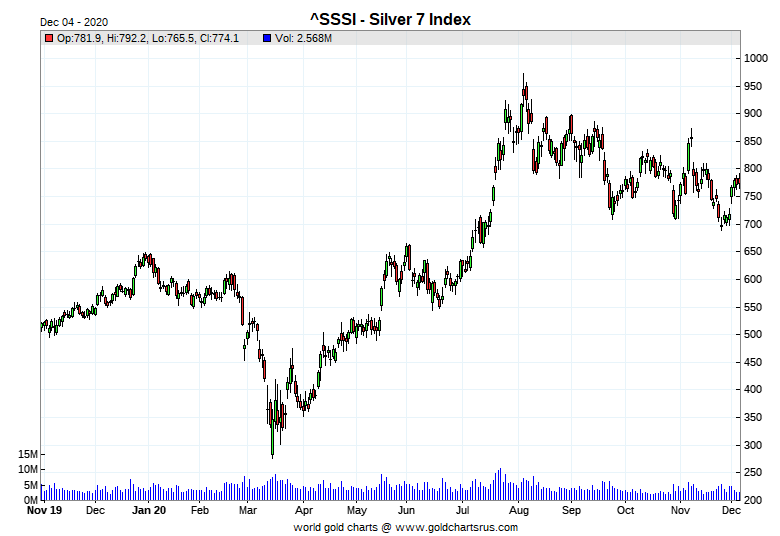
And here's Nick's 1-year Silver Sentiment/Silver 7 Index chart, updated with Friday's doji. Click to enlarge as well.
|
|
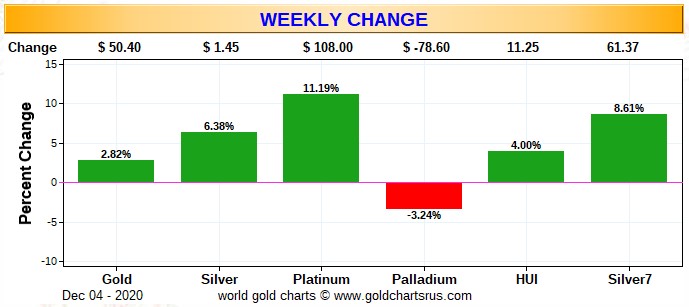
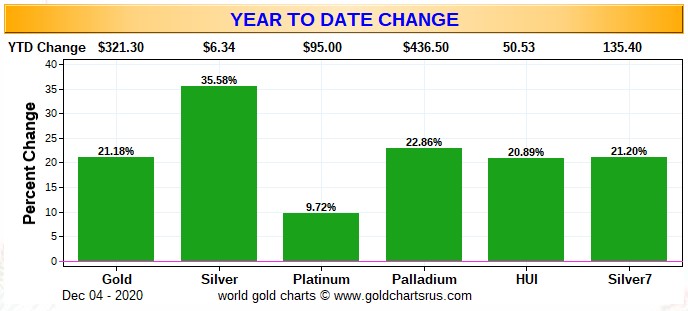
Here are two of the usual three charts that show up in every Saturday missive. The first one shows the changes in gold, silver, platinum and palladium for this past week, in both percent and dollar and cents terms, as of their Friday closes in New York - along with the changes in the HUI and the Silver 7 Index.
Here's the weekly chart -- and because of the big 'up' day on Tuesday, it looks pretty good. Except for palladium, everything is in the green A big chunk of platinum's weekly gain came on that day. Click to enlarge.
|
|
Here's the year-to-date chart -- and with platinum's big rally this week, it's now green across the board, although huge chunks of this year's gains in everything else have vanished since 'da boyz' showed up in the COMEX futures market in early August. And as you already know, the precious metal equities are still vastly underperforming their respective underlying precious metals this year -- and it's most obvious on this chart, particularly the silver shares. Click to enlarge.
|
|
And even though you haven't reached my COT commentary yet, the headline to today's column tells you all you need to know, as the Big 8 shorts increased their short positions in gold and silver during the reporting week -- and in gold it was by a rather startling amount.
The CME Daily Delivery Report for Day 6 of the December delivery month showed that 1,252 gold and 237 silver contracts were posted for delivery within the COMEX-approved depositories on Tuesday.
In gold, there were six short/issuers -- and the only three that mattered were Goldman Sachs, with 666 contracts...Barclays with 364 contracts -- and Dutch bank ABN Amro with 200 contracts -- all these contracts issued were from their respective client accounts. There was a big list of long/stoppers, with JPMorgan being the biggest of course, picking up 554 contracts for its client account. They were followed by Morgan Stanley, with 209 contracts in total...132 for their clients -- and the remaining 77 contracts for its house account. In third and fourth spot were Barclays and RBC Capital Markets, as they stopped 151 and 116 contracts for their respective client accounts.
In silver, there were four short/issuers -- and the two largest were Marex and JPMorgan, with 144 and 80 contracts out of their respective client accounts. JPMorgan was the biggest long/stopper of course, as they picked up 132 contracts for their client account. Morgan Stanley picked up 29 contracts for their client account as well -- and Wells Fargo Securities and BofA Securities stopped 43 and 20 contracts for their respective house accounts.
So far in December, there have been 18,565 gold contracts issued/reissued and stopped -- and that number in silver is 7,889 contracts.
The link to yesterday's Issuers and Stoppers Report is here.
The CME Preliminary Report for the Friday trading session showed that gold open interest in December fell by 3,012 contracts, leaving 11,952 still open, minus the 1,252 contracts mentioned a few paragraphs ago. Thursday's Daily Delivery Report showed that 3,122 gold contracts were posted for delivery on Monday, so that means that 3,122-3,012=110 gold contracts just got added to the December delivery month. Silver o.i. in December dropped by 33 contracts, leaving 1,462 still around, minus the 237 contracts mentioned a few paragraphs ago. Thursday's Daily Delivery Report showed that 57 silver contracts were actually posted for delivery on Monday, so that means that 57-33=24 silver contracts were added to December.
Total gold open interest on Friday declined by 597 contracts -- and total silver o.i. rose by 1,099 COMEX contracts.
There was a big withdrawal from GLD yesterday, as an authorized participant removed 228,954 troy ounces of gold -- and there were no reported changes in SLV.
In other gold and silver ETFs and mutual funds on Planet Earth on Friday, net of any changes in COMEX, GLD & SLV inventories, there was a net 89,977 troy ounces of gold removed -- and a net 62,584 troy ounces of silver was taken out as well.
There was no sales report from the U.S. Mint on Friday.
Month-to-date the mint has sold 6,500 troy ounces of gold eagles -- 4,500 one-ounce 24K gold buffaloes -- and 276,000 silver eagles.
There was some activity in gold over at the COMEX-approved gold depositories on the U.S. east coast on Thursday. They reported receiving 102,014 troy ounces -- and only 32.151 troy ounces/1 kilobar [SGE kilobar weight] was shipped out.
The largest 'in' amount was 96,356.547 troy ounces/2,997 kilobars [SGE kilobar weight] that ended up at Brink's, Inc. The remaining 5,658.400 troy ounces/176 kilobars [U.K./U.S. kilobar weight] was dropped off at Loomis International. The lone kilobar that was shipped out, departed Delaware.
There was a tiny bit of paper activity...all of it transferred from the Registered category and back into Eligible. The largest amount...3,665.214 troy ounces/114 kilobars [SGE kilobar weight] made that trip at Brink's, Inc. -- and the remaining 96.453 troy ounces/3 kilobars [SGE kilobar weight] was transferred in the same direction at Malca-Amit USA. The link to 'all of the above' is here.
There was a bit of activity in silver. All of the 'in' activity...600,334 troy ounces...was reported received at Canada's Scotiabank. There was 4,941 troy ounces shipped out...3,021 troy ounces and 1,919 troy ounces from CNT and Delaware respectively.
There was a tiny bit of paper activity, as 4,939 troy ounces/one COMEX contract was transferred from the Registered category and back into Eligible over at Manfra, Tordella & Brookes, Inc. -- and the remaining 961 troy ounces/one good delivery bar, made the trip in the opposite direction at Canada's Scotiabank. The link to all this, is here.
There was a decent amount of activity over at the COMEX-approved gold kilobar depositories in Hong Kong on their Thursday...all of it at Brink's, Inc. They reported receiving 510 kilobars -- and shipped out 502. The link to this, in troy ounces, is here.
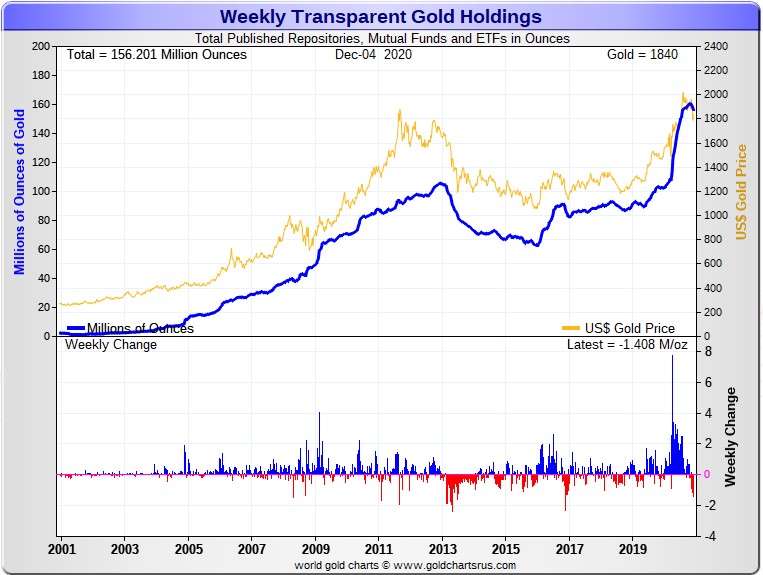
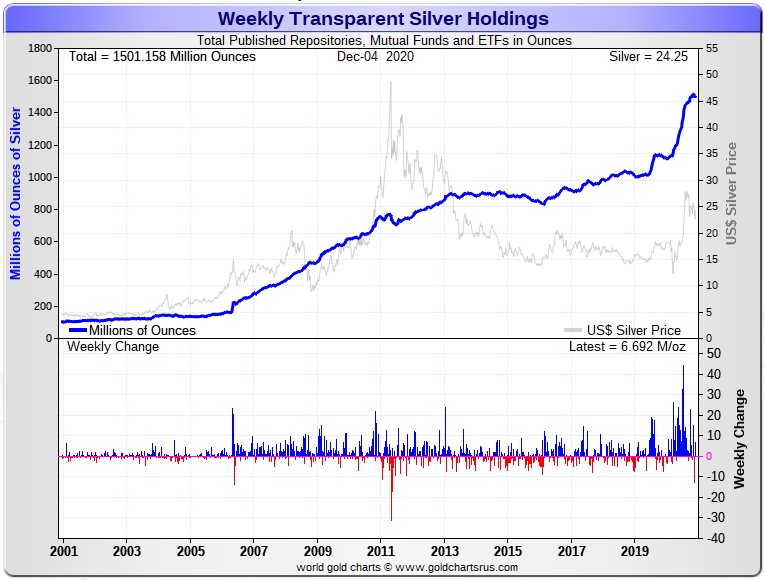
Here are the usual two 20-year charts from Nick that show up in this spot every Saturday. They show the total amounts of gold and silver in all known depositories, ETFs and mutual funds as of the close of business on Friday.
For the week just past, there was a net 1,408,000 troy ounces of gold removed -- but a net 6,692,000 troy ounces of silver was added. Click to enlarge for both graphs.
|
|
|
|
And you can rest assured that all the above gold that was removed during the prior week is not laying in the street somewhere...either unloved, or unowned.
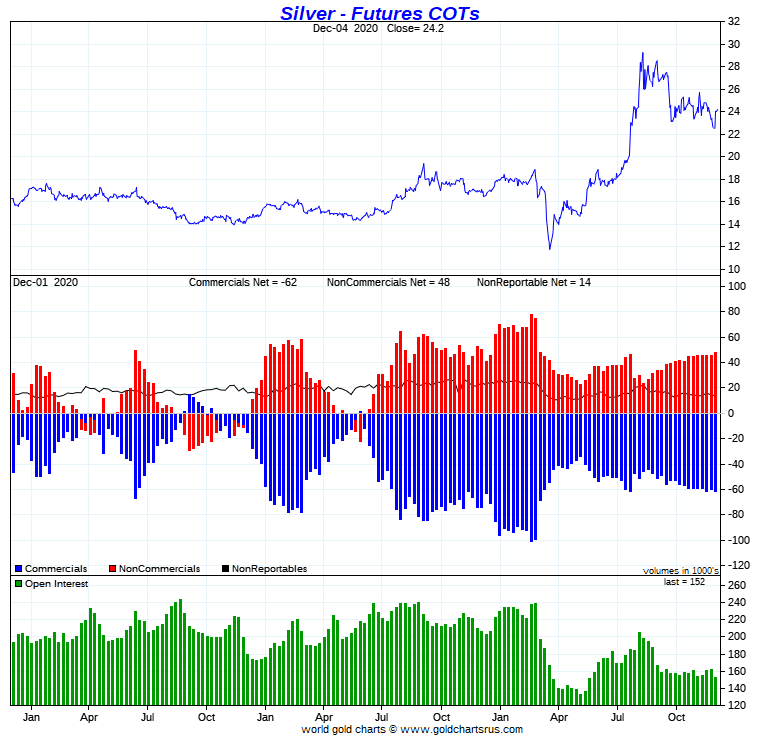
The Commitment of Traders Report, for positions held at the close of COMEX trading on Tuesday, December 1, showed a smallish increase in the Commercial net short position in silver -- and slightly larger increase in the short position in gold.
In silver, the Commercial net short position increased by only 1,725 contracts, or 3.56 million troy ounces.
They arrived at that number by decreasing their long position by 4,010 COMEX contracts -- and they also decreased their short position by 2,285 contracts. It's the difference between those two numbers that represents their change for the reporting week.
Under the hood in the Disaggregated COT Report, the Managed Money traders increased their net long position by 1,049 contracts -- and the Other Reportables also increased their net long position, them by 1,163 contracts. The Other Reportables are now net long 5,186 COMEX contracts, which is pretty close to a high-water mark for them. The Nonreportable/small traders decreased their net long position by 487 contracts.
Doing the math: 1,049 plus 1,163 minus 487 equals 1,725 COMEX contracts...the change in the Commercial net short position.
The Commercial net short position in silver now stands at 61,885 contracts, or 309.4 million troy ounces, compared to the 300.8 million troy ounces they were short in Monday's COT Report.
The short position of the Big 8 traders in this COT Report worked out to 380.9 million troy ounces, compared to 371.2 million troy ounces that they were short in Monday's COT Report...an increase of 9.7 million troy ounces -- and 123 percent of the Commercial net short position. So they accounted for all of the increase in the Commercial net short position in silver this week...3.56 million troy ounces...plus a whole bunch more.
Ted said that JPMorgan mostly likely went short a couple of thousand contracts during this past reporting week. In Monday's COT Report, he said that JPMorgan was "flat to slightly long" in silver.
Here's the 3-year COT chart for silver, courtesy of Nick Laird, updated with Friday's data -- and the change for the reporting week is barely discernible. Click to enlarge.
|
|
I must admit that I was more than surprised that the Big 8 shorts added as many short contracts as they did during the reporting week. They've made absolutely no attempt to reduce their short positions over the last many months, despite the engineered price decline that began in early August and, according to Ted, have increased their short position by 5,000 contracts during that time period. What the hell is that all about???
But one thing is for sure, they are the only traders...all of them banks and investment houses...that stand in the way of far higher silver prices, as every other group of traders is mega net long against them. So it remains to be seen if this situation resolves itself in a short covering rally or not -- and so far there have been no signs of that.
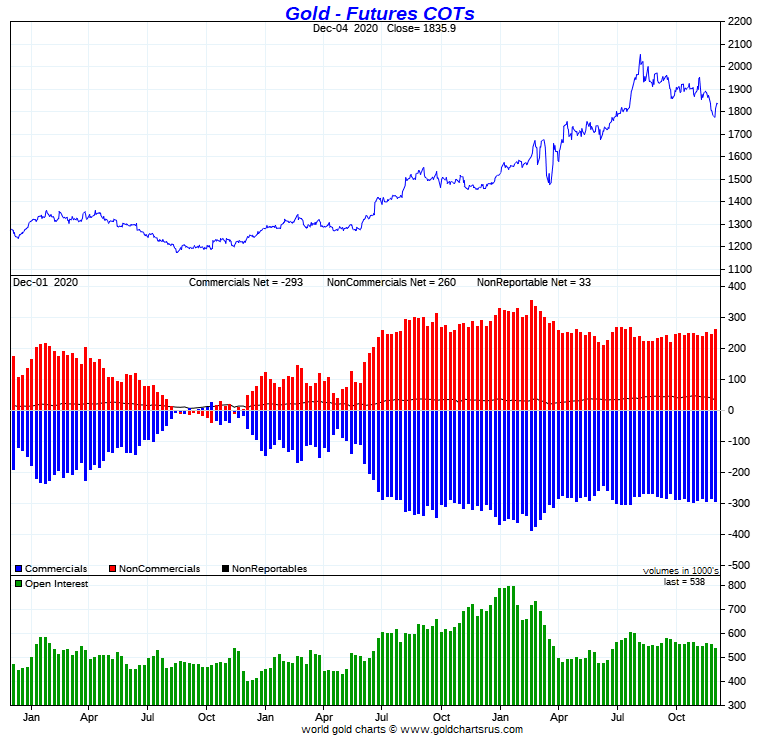
In gold, the commercial net short position increased by 8,434 contracts, or 843,400 troy ounces of gold.
They arrived at that number by increasing their long position by 1,483 contracts, but they also increased their short position by 9,917 contracts -- and it's the difference between those two numbers that represents their change for the reporting week.
Under the hood in the Disaggregated COT Report, the Managed Money traders did virtually nothing, increasing their net long position by a scant 195 contracts. But it was the Other Reportables that were the eye-opener, as they increased their net long position by a very chunky 16,217 COMEX contracts. The Nonreportable/small traders had to be the ones that decreased their net long position -- and they did so to the tune of 7,978 contracts.
Doing the math: 195 plus 16,217 minus 7,978 equals 8,434 COMEX contracts...the change in the commercial net short position, which it must do.
The commercial net short position in gold is now up to 29.33 million troy ounces, compared to the 28.48 million troy ounces that they were short in Monday's COT Report.
The Big 8 traders are short 26.31 million troy ounces of gold...which is a hair under 90 percent of the commercial net short position -- and up huge from the 24.93 million troy ounces they were short in Monday's COT Report. So, like in silver, they increased their short position by more than the increase in the commercial net short position in this week's COT Report.
Ted figures that JPMorgan is flat in gold in the COMEX futures market. He indicated that they were long a couple of thousand contracts in Monday's COT Report.
Here's Nick's 3-year COT chart for gold, updated with Friday's data. Click to enlarge.
|
|
The Big 8 shorts are now deeper in the hole than they were in Monday's COT Report. Ted said that the Big 8 shorts were short 20-something million troy ounces at the top in the gold price during the first week in August. And now that the gold price has been engineered lower by several hundred dollars, the Big are short 26.31 million troy ounces. Like in silver, not only haven't they covered any of their short position during that time period, they've increased it by around 6 million troy ounces! Why isn't this the 'talk of the town' in the precious metals world?...Ted asked on the phone yesterday. It should be, but it's not.
To give you some idea of how obscene and grotesque the current situation is...in Friday's COT Report, the Big 8 traders were short 50.0 percent of the entire open interest in silver -- and 48.9 percent of the entire open interest in gold in the COMEX futures market. That's against thousands of other traders that are net long.
They are actually short more than 50 percent of both markets, as they hold an unknown number of spread trades in both -- and that fact has the effect of showing a reduced net short position.
They could theoretically be short 60 percent of the COMEX futures market.
As to how this is going to resolve itself, remains to be seen.
In the other metals, the Managed Money traders in palladium decreased their net long position by an insignificant 58 COMEX contracts during the last reporting week -- and are net long the palladium market by 3,794 COMEX contracts...around 38 percent of the total open interest...up about 1 percentage point from last week. And as I continue to point out, the COMEX futures market in palladium, is a market in name only. In platinum, the Managed Money traders increased their net long position by a further and very hefty 3,585 contracts during the reporting week, which is why the platinum price rose so much -- and they are now net long the platinum market by 13,654 COMEX contracts...23 percent of total open interest. All of the four reporting categories [including the Swap Dealers] are still net long big time against the Big 8 shorts/JPMorgan et al. in the Producer/Merchant category. In copper, the Managed Money traders increased their net long position by a very chunky 5,986 contracts during this last reporting week -- and are net long copper to the tune of 85,699 COMEX contracts...about 2.14 billion pounds of the stuff, which has to be close to a record -- and about 36 percent of total open interest...up about 2 percentage points from last week.
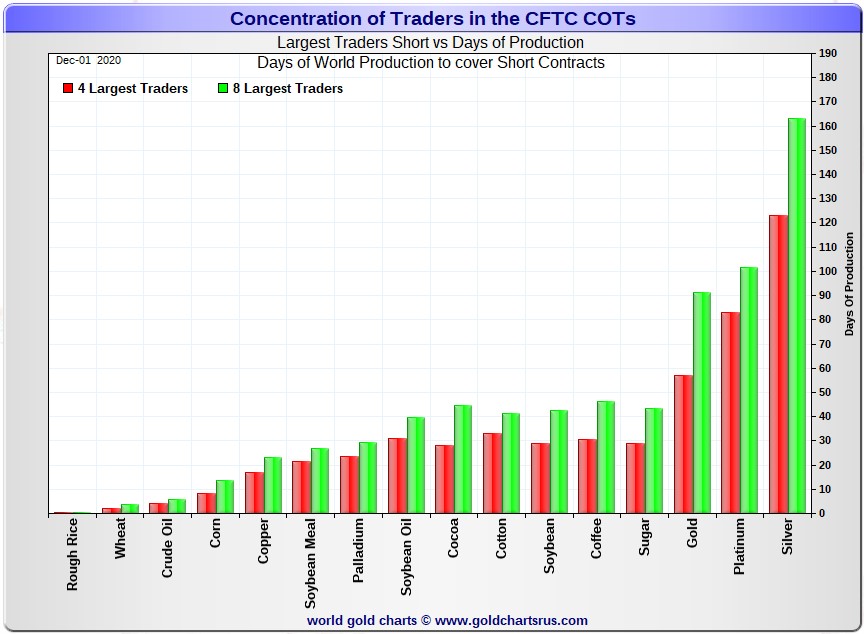
Here's Nick Laird's "Days to Cover" chart, updated with the COT data for positions held at the close of COMEX trading on Tuesday, December 1. It shows the days of world production that it would take to cover the short positions of the Big 4 - and Big '5 through 8' traders in each physically traded commodity on the COMEX. Click to enlarge.
|
|
The Big 4 traders are short about 123 days of world silver production, up 5 days from last week's report. The '5 through 8' large traders are short an additional 40 days of world silver production...down about 1 day from last week's COT Report - for a total of about 163 days that the Big 8 are short...up 4 days from Monday's COT report. This represents almost five and a half months of world silver production, or about 380 million troy ounces of paper silver held short by the Big 8. [In the prior reporting week -- the Big 8 were short 159 days of world silver production.]
In the COT Report above, the Commercial net short position in silver was reported by the CME Group at about 309 million troy ounces. As mentioned in the previous paragraph, the short position of the Big 8 traders is around 380 million troy ounces. So the short position of the Big 8 traders is larger than the total Commercial net short position by about 380-309=71 million troy ounces...up about 1 million troy ounces from last week's report.
The reason for the difference in those numbers...as it always is...is that Ted's raptors, the 24-odd small commercial traders other than the Big 8...which includes JPMorgan...are net long that amount. In Monday's report, there were 30-odd traders, so the number of traders on the long side in silver dropped by 6...which is a huge number -- and I'm wondering if Ted will comment on that in his weekly review today.
Another way of stating this [as I say every week in this spot] is that if you remove the Big 8 commercial traders from that category, the remaining traders in the commercial category are net long the COMEX silver market. It's the Big 8 against everyone else...a situation that has existed for over four decades in both silver and gold -- and in platinum and palladium as well.
As per the first paragraph above, the Big 4 traders in silver are short around 123 days of world silver production in total. That's just under 31 days of world silver production each, on average...up more than 2 days from last Monday's report. The four big traders in the '5 through 8' category are short 40 days of world silver production in total, which is 10 days of world silver production each, on average...down a tiny bit from Monday's report.
The Big 8 commercial traders are short 50.0 percent of the entire open interest in silver in the COMEX futures market, which is up big from the 45.8 percent they were short in last week's COT report. And once whatever market-neutral spread trades are subtracted out, that percentage would be a bit over the 55 percent mark. In gold, it's 48.9 percent of the total COMEX open interest that the Big 8 are short, which is also up a lot from the 44.9 percent they were short in last week's report -- and almost 55 percent once the market-neutral spread trades are subtracted out.
In gold, the Big 4 are short 57 days of world gold production, up 1 day from last week's COT Report. The '5 through 8' are short another 34 days of world production, up 3 days from last week's report...for a total of 91 days of world gold production held short by the Big 8... up 4 days from last week's COT Report. Based on these numbers, the Big 4 in gold hold about 63 percent of the total short position held by the Big 8...down about 1 percentage point from last week's report.
According to Ted -- JPMorgan is most likely short a couple of thousand contracts in the COMEX futures market in silver now -- and most likely market neutral in gold, compared to the 2,000 COMEX contracts or so that they were net long in Monday's COT Report.
The "concentrated short position within a concentrated short position" in silver, platinum and palladium held by the Big 4 commercial traders are about 75, 82 and 79 percent respectively of the short positions held by the Big 8...the red and green bars on the above chart. Silver is up about 1 percentage point from last week's COT Report...platinum is unchanged from a week ago -- and palladium is down about 1 percentage point week-over-week.
The Big 8 shorts are still hugely exposed in all four precious metal in the COMEX futures market -- and they increased their short position in both gold and silver by eye-opening amounts during this last reporting week, especially in gold.
And as I stated in my COT discussion further up, this current situation is now beyond obscene and grotesque.
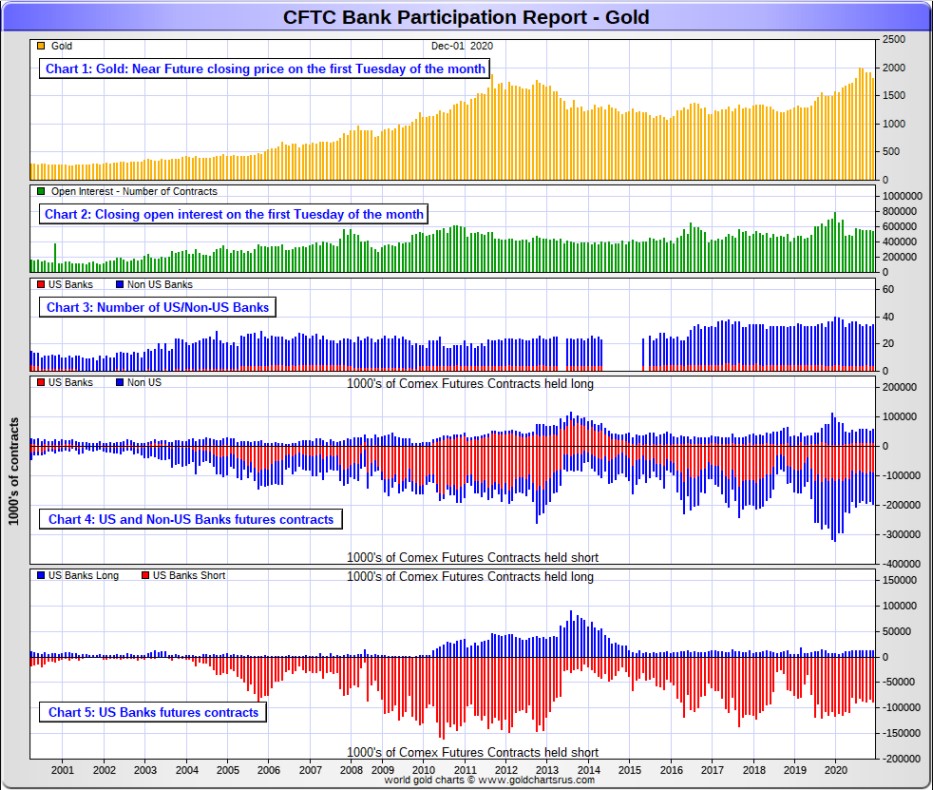
The December Bank Participation Report [BPR] data is extracted directly from yesterday's Commitment of Traders Report. It shows the number of futures contracts, both long and short, that are held by all the U.S. and non-U.S. banks as of Tuesday's cut-off in all COMEX-traded products. For this one day a month we get to see what the world's banks are up to in the precious metals -and they're usually up to quite a bit.
[The December Bank Participation Report covers the time period from November 4 to December 1 inclusive.]
In gold, 4 U.S. banks are net short 76,215 COMEX contracts in the December BPR. In November's Bank Participation Report [BPR] these same banks were net short 71,079 contracts, so there was an increase of 5,136 COMEX contracts from four weeks ago, which is not a material change.
Citigroup, HSBC USA, Goldman Sachs and possibly Morgan Stanley would most likely be the U.S. banks that are short this amount of gold...however, one should presume that it's their clients that are short. I'm also starting to harbour some suspicions about the Exchange Stabilization Fund as well.
Also in gold, 30 non-U.S. banks are net short 61,943 COMEX gold contracts. In November's BPR, 29 non-U.S. banks were net short 65,080 COMEX contracts...so the month-over-month change shows a decrease of 3,137 COMEX contracts...which pretty much cancels out the increase in the U.S. banks. So net-net, there was only a slight increase in the short position held by the world's banks in gold during November.
At the low back in the August 2018 BPR...these non-U.S. banks held a net short position in gold of only 1,960 contacts -- and they've been back on the short side in a big way ever since.
However, as I always say at this point, I suspect that there's at least two large non-U.S. bank in this group, one of which would be Scotiabank/Scotia Capital...plus HSBC most likely. And I have my suspicions about Barclays, Dutch Bank ABN Amro, plus Australia's Macquarie as well. Other than that small handful, the short positions in gold held by the vast majority of non-U.S. banks are mostly immaterial.
As of this Bank Participation Report, 34 banks [both U.S. and foreign] are net short 25.7 percent of the entire open interest in gold in the COMEX futures market, which is up a tiny bit from the 25.0 percent 33 banks were short in the November BPR.
Here's Nick's BPR chart for gold going back to 2000. Charts #4 and #5 are the key ones here. Note the blow-out in the short positions of the non-U.S. banks [the blue bars in chart #4] when Scotiabank's COMEX short position was outed by the CFTC in October of 2012. Click to enlarge.
|
|
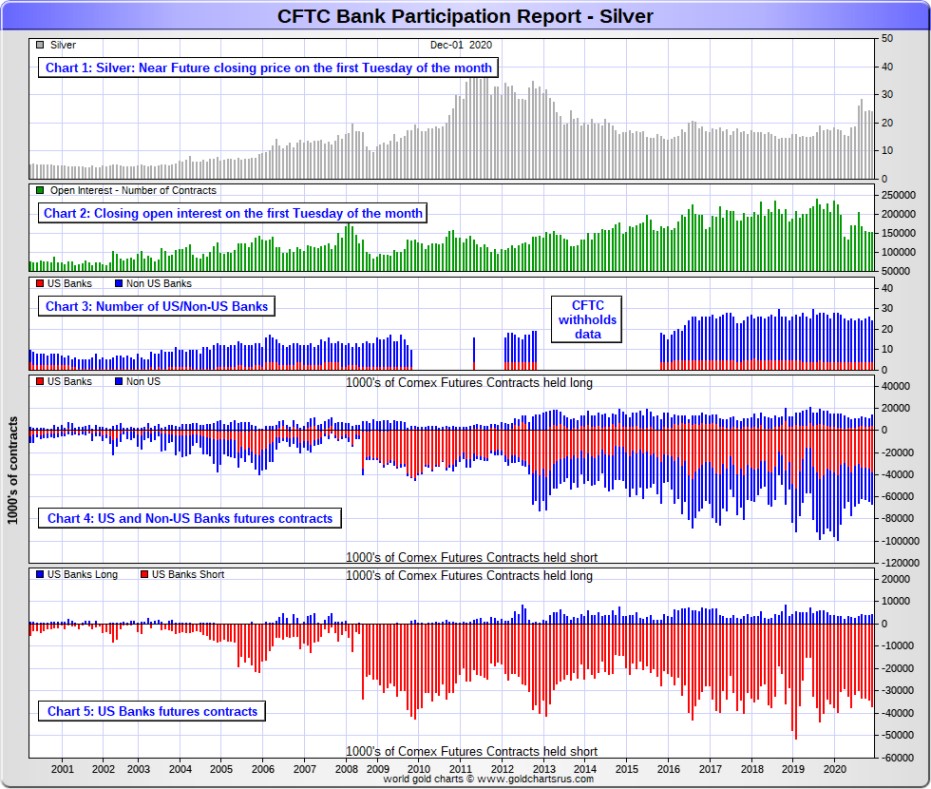
In silver, 4 U.S. banks are net short 32,785 COMEX contracts in December's BPR. In November's BPR, the net short position of these same 4 U.S. banks was 30,166 contracts, so the short position of the U.S. banks has increased by a rather insignificant 2,619 contracts month-over-month.
As in gold, the three biggest short holders in silver of the four U.S. banks in total, would be Citigroup, HSBC USA -- and Goldman or maybe Morgan Stanley in No. 3 and 4 spots. And, like in gold, I'm starting to have my suspicions about the Exchange Stabilization Fund.
Also in silver, 20 non-U.S. banks are net short 19,803 COMEX contracts in the December BPR...which is up 2,063 contracts from the 23,178 contracts that 22 non-U.S. banks were short in the November BPR. I would suspect that Canada's Scotiabank/Scotia Capital holds a goodly chunk of the short position of these non-U.S. banks. I also suspect that a number of the remaining 19 non-U.S. banks may actually be net long the COMEX futures market in silver. But even if they aren't, the remaining short positions divided up between these other 19 non-U.S. banks are immaterial - and have always been so.
So net-net, like in gold, the overall short position of the world's banks in silver changed very little month-over-month.
As of December's Bank Participation Report, 24 banks [both U.S. and foreign] are net short 34.5 percent of the entire open interest in the COMEX futures market in silver-down a hair from the 34.8 percent that 26 banks were net short in the November BPR. And much, much more than the lion's share of that is held by Citigroup, HSBC USA, Goldman, Scotiabank -- and maybe one other non-U.S. bank...the Big 8 shorts.
Here's the BPR chart for silver. Note in Chart #4 the blow-out in the non-U.S. bank short position [blue bars] in October of 2012 when Scotiabank was brought in from the cold. Also note August 2008 when JPMorgan took over the silver short position of Bear Stearns-the red bars. It's very noticeable in Chart #4-and really stands out like the proverbial sore thumb it is in chart #5. Click to enlarge.
|
|
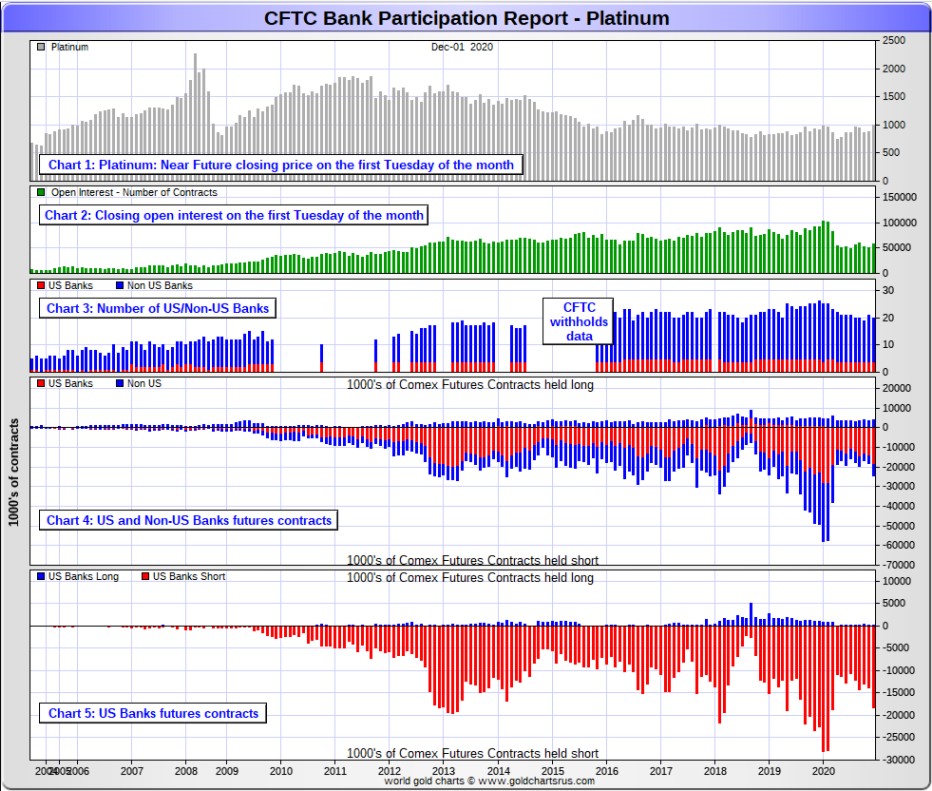
In platinum, 4 U.S. banks are net short 17,992 COMEX contracts in the December Bank Participation Report. In the November BPR, these same 4 U.S. banks were net short 13,665 COMEX contracts...up a very hefty 4,327 COMEX contracts...32 percent...month-over-month. This big rally in platinum that's been going on for a while is not going unopposed.
[At the 'low' back in July of 2018, these same U.S. banks were actually net long the platinum market by 2,573 contracts]
Also in platinum, 16 non-U.S. banks are net short 2,769 COMEX contracts in the December BPR, which is up a very decent amount from the 1,017 COMEX contracts that 17 non-U.S. banks were net short in the November BPR.
[Note: Back at the July 2018 low, these same non-U.S. banks were net short 1,192 COMEX contracts.]
And as of December's Bank Participation Report, 20 banks [both U.S. and foreign] are net short 35.9 percent of platinum's total open interest in the COMEX futures market, which is higher by a fairly decent amount from the 28.8 percent that 21 banks were net short in November's BPR. But it's the U.S. banks, or most likely their clients, that are on the short hook big time. They have little chance of delivering into their short positions, although a very large number of platinum contracts have already been delivered in both October and November. But that fact made no difference whatsoever to their short position during the last month. They're still very short the COMEX futures market -- and may be forced to cover the rest at some point. Time will tell.
Here's the Bank Participation Report chart for platinum. Click to enlarge.
|
|
In palladium, 4 U.S. banks are net short 3,061 COMEX contracts in the December BPR, up from the 2,683 contracts that these same U.S. banks were net short in the November BPR. This is the fifth month in a row that the U.S. banks have increased their short position in palladium.
They were short only 1,194 COMEX contract in the July BPR.
Also in palladium, 8 non-U.S. banks are net long 222 COMEX contracts-down a few hundred contracts from the 471 COMEX contracts that these same 8 non-U.S. banks were net long in the November BPR.
And as I've been commenting for almost forever now, the COMEX futures market in palladium is a market in name only, because it so illiquid and thinly-traded. Total open interest at Tuesday's cut-off was only 9,867 contracts.
As of this Bank Participation Report, 12 banks [both U.S. and foreign] are net short 28.8 percent of the entire COMEX open interest in palladium...up a bit from the 21.8 percent of total open interest that these same 12 banks were net short in November. Because of the small numbers of contracts involved, along with a tiny open interest, these numbers are pretty much meaningless. So, for the ninth month in a row, the world's banks are no longer involved in the palladium market in a material way -- and if they are, I suspect that it's their clients that are on the hook, not the banks themselves.
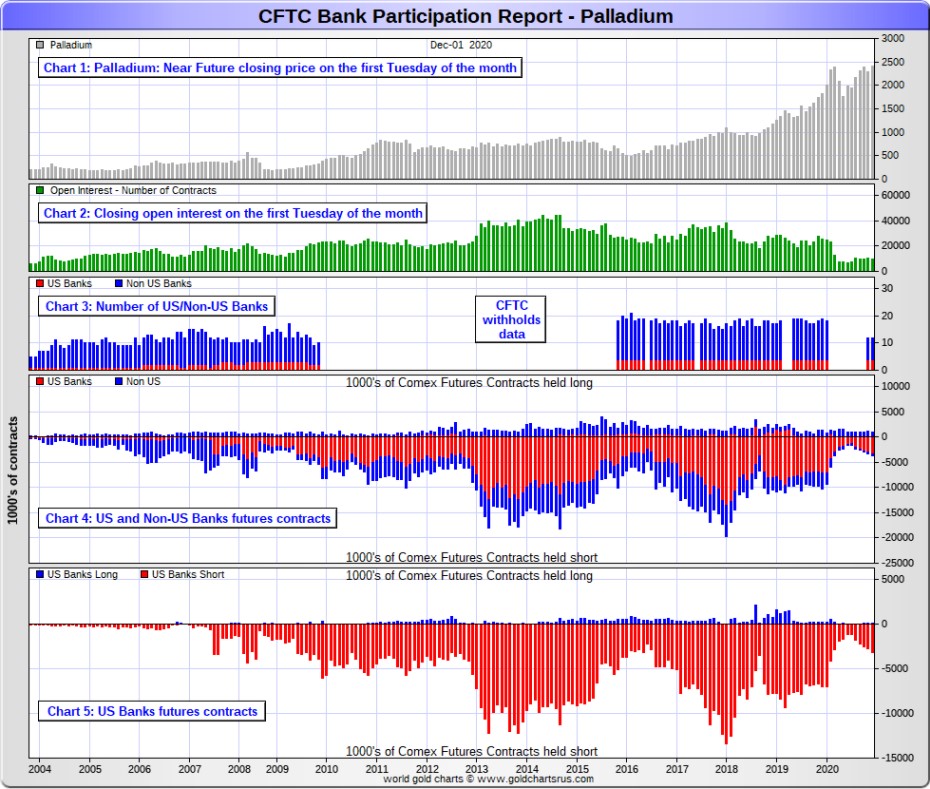
Here's the palladium BPR chart. And as I point out every month, you should note that the U.S. banks were almost nowhere to be seen in the COMEX futures market in this precious metal until the middle of 2007-and they became the predominant and controlling factor by the end of Q1 of 2013. They have imploded into insignificance over the last nine Bank Participation Reports, although their short position has been sneaking higher for the last five months. It remains to be seen if they return as big short sellers again at some point like they've done in the past. Click to enlarge.
|
|
Except for palladium, only a small handful of the world's banks still have meaningful short positions in the other three precious metals -- and in most cases, it's their clients that are on the short hook, not the banks themselves.
I don't know if it means anything, but the one stand-out feature in this latest Bank Participation Report was the fact that the U.S. banks increased their short positions in all four precious metals.
The short or long positions in silver and gold that JPMorgan may or may not hold, are immaterial -- and have been since March. It's the remaining Big 8 shorts that are on the hook in everything precious metals-related -- and they've been sticking their respective heads further into the lion's mouth since the price tops of early August.
That's the only thing that matters now -- and how it is ultimately resolved.
I have a decent number of stories, articles and videos for you today, including several that I've been saving for my Saturday column for either length or content reasons...or both.
CRITICAL READS
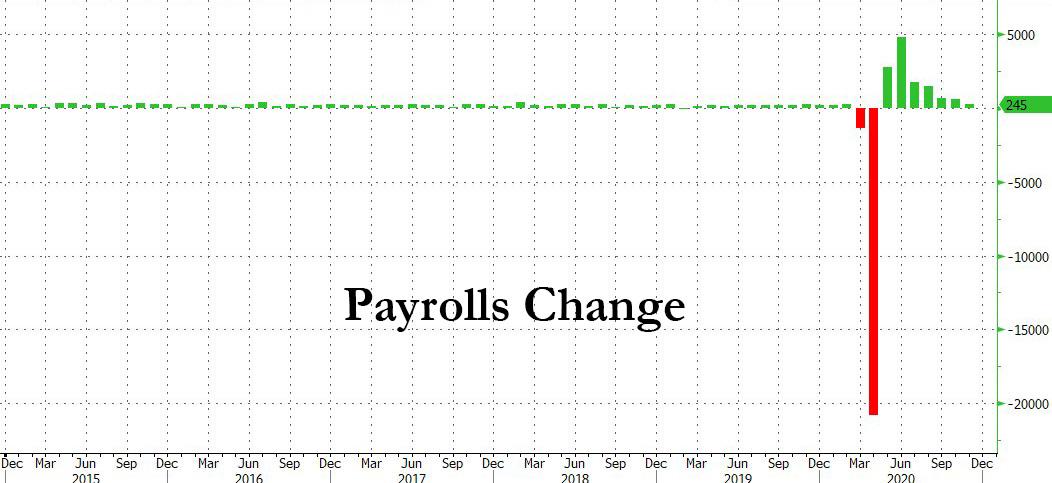
November Payrolls Huge Miss At Just 245K Jobs Added, Unemployment Rate Falls to 6.7%
As noted earlier in our preview, consensus expected a return to weakness in the labor market as surging Covid-19 case counts have led to to a return of lock-down measures, which explicitly means less hiring and sure enough moments ago the BLS reported that in November, a paltry 245K jobs were added, a huge miss to the 470K expectation and a sharp drop from the 610K revised October print. In fact, this was the lowest monthly addition since the April crash. Click to enlarge.
|
|
Confirming the labor picture is getting uglier, the household survey actually declined showing the number of employed people falling in November, by 74,000.
As noted earlier, the biggest hit was in retail trade, as retailers have been crushed due to covid, resulting in a loss of 35,000 retail jobs, "reflecting less seasonal hiring in several retail industries" according to the BLS. Additionally, government employment declined for the third consecutive month, decreasing by 99,000 in November. A decline of 86,000 in federal government employment reflected the loss of 93,000 temporary workers who had been hired for the 2020 Census. Offsetting the contraction in government, private payrolls rose by 344,000, missing economists' median estimate of 540,000.
This somewhat lengthy and chart-filled news item was posted on the Zero Hedge Internet site at 8:33 a.m. on Friday morning EST -- and is the first offering of the day from Brad Robertson. Another link to it is here.
Factory Orders Growth Slows in October, Remains Lower Year-Over-Year
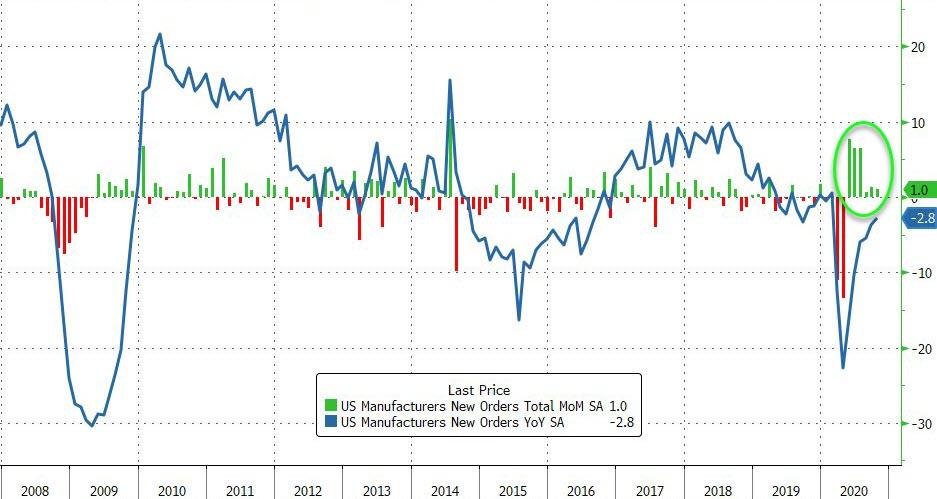
As 'soft' survey data rolls over, and 'hard' data continues to slide, analysts expect Factory Orders growth in October to slow modestly from its surprise pop in September, and it did but slightly better than expected.
Factory Orders rose 1.0% MoM, better than the +0.8% MoM expected (but slower than the upwardly revised +1.3% MoM in September). Click to enlarge.
|
|
This is the 6th monthly rise in factory orders are March and April's collapse, but Factory Orders remain down 2.8% YoY.
The final print for durable goods orders came in line with the preliminary data at +1.3% MoM.
The above four paragraphs and chart are all there is to this very brief Zero Hedge new item that showed up on their Internet site at 10:04 a.m. EST on Friday morning -- and that comes courtesy of Brad Robertson as well. Another link to the hard copy is here. Gregory Mannarino's post market close rant for Friday is linked here.
November Class 8 Truck Orders Third-Highest Ever
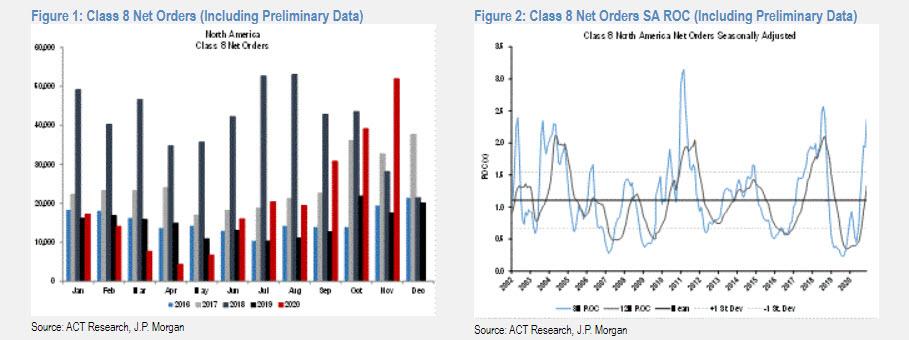
Preliminary Class 8 truck orders posted their third-highest number in history in November, continuing a stunning comeback from pandemic-depressed bookings earlier in the year.
Preliminary net North American Class 8 orders in November were 51,900 units, up 33% from October and 197% higher than November a year ago, ACT Research reported. FTR Transportation Intelligence pegged net orders slightly higher at 52,600. Click to enlarge.
|
|
"The pandemic-impacted economy continues to play into the hands of trucking," said Kenny Vieth, ACT president and senior analyst. "With freight rates surging to record levels the past three months and carrier profits certain to follow, orders accelerated in November."
Class 8 orders on a running basis for the past 12 months stand at 250,000 units, FTR said. Predictions as recently as April called for less than half that number.
"The Class 8 market is trying to rebalance after suffering through woeful order numbers early in the pandemic," said Don Ake, FTR vice president of commercial vehicles.
"Fleets are still trying to catch up with the jump in freight volumes resulting from the economic restart and the generous stimulus money which is being spent predominantly on consumer goods and food," Ake said. "This will only intensify if there is a second round of payouts."
In other words, dear reader, these truck sales would be in the dumpster if it wasn't for all that E-Z money from the Fed. This story appeared on the Zero Hedge website at 9:55 a.m. on Friday morning EST -- and it's another contribution from Brad Robertson. Another link to it is here.
On November 24 the Office of the Comptroller of the Currency (OCC) fined JPMorgan Chase $250 million for wrongdoing that was apparently too deplorable to be spoken out loud to the public. The specific details were cloaked in this phrase: "failure to maintain adequate internal controls and internal audit over its fiduciary business."
We went to the OCC's Consent Order connected to the fine to see if there were the typical smoking gun internal emails or at least some clue as to what the actual illegal activity was. There were zero clues, just more obfuscation. What we did see, however, was a dollar figure that popped our eyes wide open. The OCC Consent Order said this:
"The Bank maintains one of the world's largest and most complex fiduciary businesses with total fiduciary and related assets of $29.1 trillion, including $1.3 trillion in fiduciary assets and $27.8 trillion of non-fiduciary custody assets."
To put that $29.1 trillion into the proper perspective, the Federal Deposit Insurance Corporation (FDIC) is reporting that as of November 30 of this year, there were a total of 5,031 federally-insured banks and savings associations in the United States. The amount of assets held by all 5,031 of these financial institutions was $21 trillion - $8 trillion less than JPMorgan Chase has in custody assets.
JPMorgan Chase is the largest bank in the United States. To put the $29.1 trillion into even sharper focus, JPMorgan Chase Bank N.A., according to the FDIC, has a total of just $2.87 trillion of its own assets. But, somehow, it has managed to attract more than 10 times its own assets on a custodian basis.
This slightly longish, but very interesting commentary by Pam and Russ Martens showed up on the wallstreetonparade.com Internet site on Friday sometime -- and I found it on the gata.org Internet site. Another link to it is here.
The End Game: Episode 12 -- Grant Williams interviews Fred Hickey
Bill and Grant are joined by their mutual friend, Fred Hickey, author of The High Tech Strategist for over 30 years.
Despite a couple of technical glitches, what follows is an extraordinary deep dive into Fred's process for producing his incredible monthly letter, an examination of gold's role in a portfolio and some detailed explanations as to why gold and, in particular, some of the companies that pull it from the ground have an important role to play in The End Game.
Yes, Bitcoin is discussed. No, Bitcoin fans won't like what's said, but their time will come so don't let that distract you from what is an absolutely phenomenal contribution to our search for The End Game...
I've listened to the first forty-five minutes of this one hour and twenty-five minute audio interview. Fred has been around forever -- and is a really sharp cookie. Although he says in the interview that he studies the COT Report religiously, he is factually wrong in his assertions that "the funds" are the ones that are manipulating precious metal prices downwards. You know better, dear reader, as it's the Big 8 shorts...the big banks and investment houses...not the Managed Money or Other Reportables traders that are doing this...they've been doing the opposite of that. And why he won't admit the obvious, even though it's in front of him in black and white every week, is a mystery. So keep that in mind if you decide to listen to this. I thank Judy Sturgis for sending it me on Wednesday and, for obvious reasons, it had to wait for today's column. Another link to it is here.
Did They Steal the Election From Trump? -- Jim Rickards
Let's begin with the easy stuff. There was fraud in this election. The Trump team has hundreds of sworn affidavits by a variety of poll workers, poll watchers and Postal Service employees, among others, attesting to fraud.
An affidavit is not a casual claim. It's a sworn statement under oath. Anyone who lies on an affidavit can be charged with fraud or other crimes. So, let's give credence where it's due and assume that at least most of these claims are true.
The claims themselves relate to acts such as banning poll watchers from the counting rooms, obstructing them when they were allowed inside, failure to verify signatures where required, receiving mail-in ballots past deadlines, backdating postmarks on mail-in ballots to make it appear they were received timely when they were not, trashing Trump ballots, running Biden ballots through scanners multiple times and more.
Other allegations involve more serious efforts such as a busload of Biden campaign workers in Nevada who received blank ballots after the polls had closed, quickly marked them for Biden, and then dumped them in boxes at polling stations where they were quickly added to the count to put Biden ahead.
Workers on the bus formed a human wall to obstruct Republican poll watchers and the media from observing the act of bringing the ballots off the bus before stuffing the ballot box.
Recounts don't solve problems like this. If the ballots were fraudulently obtained, they will still be fraudulent no matter how many times you recount them. The root problem is still not addressed.
The only way the election will be reversed is if the Trump campaign and their lawyers have clear evidence of a vote-rigging effort that was so large and pervasive that it not only changed the outcome of the election, but it constitutes an ongoing threat to the rule of law and the Constitution. They might...
The allegation (and, so far, it's only an allegation with no clear proof) involves a company called Dominion Voting Systems that manufactures voting machines that use software from another company named Smartmatic.
These voting machines are not the simple scanner-tabulator type used in many jurisdictions. The Dominion machines look more like ATMs with touch screen features. They include computer chips and are networked to servers, some of which are located overseas. Behind the computer chips and server processors is source code written by Smartmatic engineers and developers who are so far unknown to the public.
Dominion's ownership is opaque, but several reports indicate that it is owned by a trio of Venezuelan oligarchs. Early in its existence, Dominion machines were used to conduct rigged elections for Hugo Chavez to ensure that the dictator never lost an "election."
In short, Dominion's expertise in voting machines consists of election rigging. Through lobbyists and others, they have secured contracts to provide voting systems in 28 states and countries abroad.
This interesting commentary from Jim was something that I found on the dailyreckoning.com Internet site on Friday -- and it's worth reading. Another link to it is here.
Doug Noland: Monetary Disorder In Extremis
November non-farm payrolls gained 245,000, only about half the mean forecasts - and down from October's 610,000. It was the weakest job growth since April's employment debacle. U.S. equities rallied on the disappointing news. A few Bloomberg headlines captured the aura:
"Stocks Gain as Jobs Miss Boosts Stimulus Bets;" "Fed Case for Fresh Action Gets Stronger on Soft U.S. Jobs Report;" and "Jobs Data Was a 'Perfect Miss' for Fed and Aid."
Bad news has never been more positively received in the stock market. Some analysts are now anticipating the Fed will soon supersize its already massive monthly bond purchases. Chairman Powell's comments this week did little to dissuade such thinking: "We are going to keep our rates low and keep our tools working until we feel like we really are very clearly past the danger that is presented to the economy from the pandemic."
The U.S. Bubble Economy structure has evolved into a voracious Credit glutton. There's a strong case for significant additional fiscal stimulus. The case for boosting monetary stimulus is not compelling. Financial conditions have remained ultra-loose. Credit stays readily available for even the riskiest corporate borrowers, as bond issuance surges to new heights. While formidable, the remarkable speculative Bubble throughout corporate Credit is dwarfed by what has regressed to a raging stock market mania.
Fed policy is single-handedly the greatest force in propagating inequality, with the past nine months the greatest episode of inequitable wealth distribution imaginable. Gross monetary mismanagement and financial excess are a principle cause of capitalism running amok. And how might egregious Fed stimulus measures now be expected to promote a more equitable and moral allocation of our national wealth across society?
Lost in the discussion is the fact that we're in the throes of a historic experiment in central bank monetary management. The Fed some years ago abandoned the traditional mechanism of operating chiefly through the banking system with subtle adjustments to reserves and interbank lending rates - a process arguably superior at disbursing resources more proportionately throughout the economy.
Having evolved over the past couple decades, the Fed now executes policy directly through the securities markets. Policy stimulus enters the system chiefly through massive purchases of Treasury and agency securities, creating liquidity excess for financial markets generally. Moreover, low (now zero) rates foster stimulus effects through both the promotion of leveraged speculation and by spurring speculative flows into higher-yielding (riskier) securities and other assets.
It's become an only greater challenge to convince readers that what passes these days as normal is anything but. We reached a number of precarious junctures over recent years - that came and went like the passing of the seasons. But let's not lose sight of historic crazy: speculative excess is by far the most egregious I've witnessed in my over three decades of obsessive market analysis. Not only will it renounce "leaning against the wind" (let alone tighten policy), the Fed is poised to continue injecting $120 billion monthly into Bubble markets as far as the eye can see. In the face of raging asset inflation (i.e. securities and home prices), the Federal Reserve is apparently more likely to boost QE than to tapper. Crazy.
This very worthwhile commentary from Doug showed up on his Internet site in the wee hours of Saturday morning -- and another link to it is here.
Pound Tumbles as Chief E.U. Negotiator Says Brexit Talks Are "Paused"
Yet again, Brexit headlines on Friday have now come full circle as a day that began with surging optimism about the prospect for talks has given way to more FUD. Despite earlier reports that talks were continuing Friday night in London, the E.U.'s Michel Barnier has reportedly 'paused' the negotiations, following what's been said to have been an extremely unproductive week of negotiations.
However, Barnier has confirmed earlier reports about talks between BoJo and the E.U. Commission President Urusla von der Leyen expected in the morning, as the top negotiators apparently need to take a step back and let the leaders take a shot at discussing the "state of play".
Get ready for a weekend of leaked status reports as both sides continue bashing their skulls against a wall, appearing to have made practically no progress on the deal's main sticking points, since the transition period began.
Yesterday, we reported on chatter that the chances of a Brexit Deal before Jan. 1 - when the U.K. will finally complete its official separation from the E.U. - were "receding" as no real progress had been made on the deal's biggest sticking points, which include: fisheries access, rules about a "level playing field" for businesses and issues of legal sovereignty.
Summing up the events of yesterday, Sky News reported that the Thursday talks "did not go well".
But by Friday morning in the U.K., the outlook had apparently improved somewhat after Reuters reported that a deal between the two warring parties might be "imminent", and that investors could expect a resolution by the end of the weekend. Since we weren't born last night, we understand that any deal optimism should be taken with a grain of salt.
Assuming we don't get a deal this weekend, Brussels' new strategy is pretty clear: Hold out on a deal, wait for Britain to suffer the severe economic disruptions and financial hardships that economists have been doom-saying on for a few years now. Once the Tories have been suitably chastised, a chastened Lord Frost will perhaps return to the bargaining table.
Of course, the U.K. crashing out of the E.U. without a deal would be a double-edged sword for the bloc.
Plus, there's reason to suspect that Boris Johnson, who has carefully cultivated his reputation for hard-nosed deal-making, won't ever cave.
Whatever happens, this is shaping up to be one epic game of geopolitical 'chicken'.
This story put in an appearance on the Zero Hedge website at 2:28 p.m. on Friday afternoon EST -- and I thank Brad Robertson for sending it our way. Another link to it is here.
Israel's gift to Joe Biden, 52 days before he even takes office: War with Iran -- Scott Ritter
Having gone on record regarding its belief that Iran continued to maintain covert nuclear weapons ambitions, the Trump administration was confronted with the reality that it had, according to its own beliefs, empowered Iran to produce a nuclear weapon in a time frame that posed a direct threat to the US and its regional allies, in particular Israel and Saudi Arabia. This concern was behind recent press reports that President Trump was considering military options against Iran's nuclear program.
For Israel, the issues are even more acute; whereas Iran's potential acquisition of a nuclear weapons capability would pose a policy conundrum for the U.S., for Israel an Iranian nuclear weapon would represent an existential threat. For this reason, Israel has historically pulled few punches when it comes to confronting even the possibility of an Iranian nuclear weapons capability.
While much of the intelligence underpinning the U.S. and Israeli assessments regarding the existence of a nuclear weapons program are derived from sources of questionable provenance and are not conclusive, Israel has taken an absolutist posture; it's given credence to sources that otherwise might be consigned to the bottom drawer.
In its effort to win support for this position, Israel has exaggerated - even fabricated - intelligence on Iran, undermining its credibility to such an extent that, when Israel reported that its intelligence stole a nuclear archive from Iran in early 2018, the veracity of this claim was called into question after documents previously held to have been forged were claimed to be part of the document trove.
Israel's actions against Iran's nuclear program have been anything but passive; in 2009-2010, Israel worked with US intelligence to launch a cyber attack using the Stuxnet virus to infect Iranian centrifuge operations at Natanz. This was followed by a program of targeted assassinations which killed four Iranian nuclear scientists between 2010-2012 (a fifth attack narrowly missed killing the head of the Iranian Atomic Energy Organization).
Israeli intelligence is also said to be behind a series of mysterious explosions at Iranian nuclear-related facilities earlier this year which caused significant damage and disruption to Iran's centrifuge program. While Israel has not taken responsibility for the assassination of Mohsen Fakhrizadeh, his murder can logically be viewed as a continuation of Israel's efforts to degrade Iran's nuclear capabilities.
The author of this op-ed piece, Scott Ritter, is a former U.S. Marine Corps intelligence officer and author of 'SCORPION KING: America's Suicidal Embrace of Nuclear Weapons from FDR to Trump.' He served in the Soviet Union as an inspector implementing the INF Treaty, in General Schwarzkopf's staff during the Gulf War, and from 1991-1998 as a U.N. weapons inspector. Based on that, one would assume that he is qualified to opine on this subject. It appeared on the rt.com Internet site back on November 28 -- and I thank Garry Johnston for pointing it out. Another link to it is here.
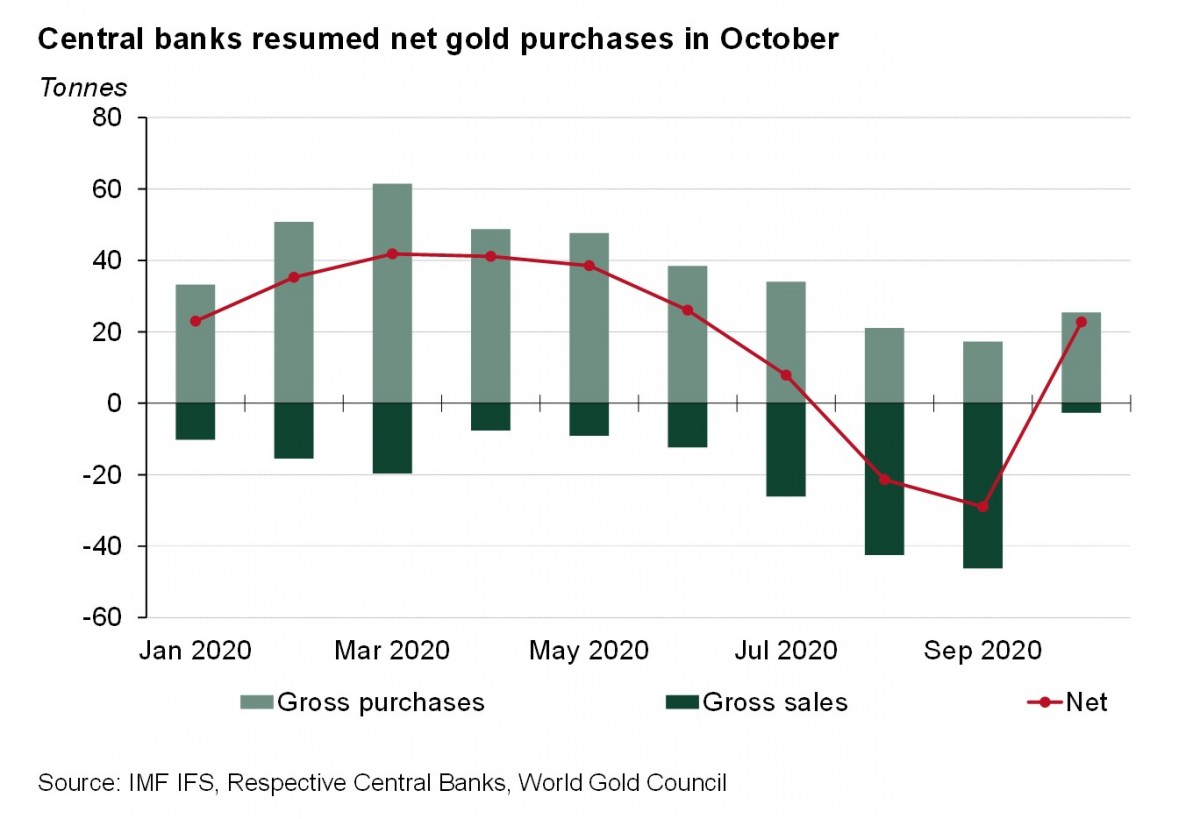
Central banks resume gold buying in October -- WGC
|
|
Following two consecutive months of net sales, central banks resumed buying in October: global official gold reserves rose by 22.8t on a net basis. Levels of buying remained consistent with the previous two months, but selling activity was far reduced. As we noted in our Q3 Gold Demand Trends report, Q3 2020 was the first quarter of net sales since Q4 2010, largely due to hefty sales from Uzbekistan and Turkey. This prompted a renewed focus on central bank gold demand and whether it signalled a change in mindset towards gold accumulation.
Gold (+18.6% y-t-d1) has continued to outperform many other traditional reserve assets this year, providing central banks with the added firepower needed to stabilise markets and currencies amid unprecedented levels of uncertainty. While it is unsurprising to see some selling, given gold's role as a safe, liquid reserve asset, the continued accumulation by central banks underscores its importance to central bank portfolios.
Familiar banks continue to drive demand. At a country-level, activity in October was concentrated among a familiar roster of emerging market central banks, a trend which has been in place for some time. Gross purchases totalled 25t in October, with five central banks almost entirely responsible for this growth: Uzbekistan (8t), Turkey (7t), UAE (6t), Qatar (2t), and India (2t). In contrast, gross sales were just under 3t during the month, with Mongolia for accounting for the majority of this.
Y-t-d, central bank net purchases continue to sit between 200-300t. Buyers have outnumbered sellers so far in 2020 (9 vs 8), with buying coming from several countries that mostly have relatively low ratios of gold-to-total reserves, demonstrating a continued appetite to grow gold holdings at a strategic level.
This rather brief gold-related news item put in an appearance on the gold.org Internet site on Thursday -- and it's the first of two gold-related stories that I found on Sharps Pixley. Another link to it is here.
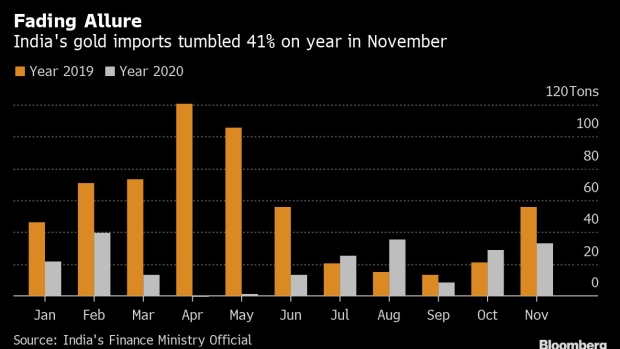
India's Gold Imports Slump as Festival Fails to Light Up Demand
|
|
Gold imports by India tumbled last month as the festival of lights failed to revive demand in the world's second-biggest consumer.
Overseas purchases fell 41% in November from a year earlier to 33.1 tons, according to a person familiar with the data, who asked not to be identified as the information isn't public. Still, imports showed an improvement from the 29 tons in October. Finance Ministry spokesman Rajesh Malhotra didn't immediately respond to a call to his mobile phone.
Jewelers in India may be staring at one of their worst years for sales in 2020 as the coronavirus pandemic, high prices and a weak economy slam the ability of buyers to purchase gold. Demand during Diwali, the biggest occasion for the country's more than 900 million Hindus to purchase jewelry, was only about 70% of last year's levels, according to the the All India Gem and Jewellery Domestic Council.
India's imports in the January to November period are down 63% from a year earlier to 220.2 tons, according to Bloomberg calculations.
The above four paragraphs are all there is to this brief Bloomberg article that was picked up by the bnnbloomberg.com Internet site on Friday sometime. I found it onSharps Pixley -- and another link to it is here.
The PHOTOS and the FUNNIES
We're finally on Deadman River Road on May 17...heading towards the "center of the universe" at Vidette Lake. The first two photos were taken from the exact same spot...the first in the direction we were headed...north -- and the second looking mostly south. The muddy waters of the Deadman River can be seen in the center-left of the second photo...caused by snow melt and run-off from the Bonaparte Plateau that surrounded us on all sides. The third shot was take from the same place as the first two shots, but I included the car in this photo. It was squeaky clean here, but that didn't last much longer. The last photo was taken from the now turned-to-gravel/dirt road as we continued up the valley. Click to enlarge.
|
|
|
|
|
|
|
|
|
|
|
|
The WRAP
"When plunder becomes a way of life for a group of men in a society, over the course of time they create for themselves a legal system that authorizes it -- and a moral code that glorifies it." -- 19th-century French economist Frédéric Bastiat
Today's pop 'blast from the past' is a country & western cross-over tune from 1962 -- and I remember this gentleman's first big hit from back in 1956 when I was 8 years young, as it was on the radio all the time. Although today's tune is obviously not his first big hit, it was certainly up there in the top 10 -- and got lots of airplay back in those day. This is real music. The link is here.
Today's classical 'blast from the past' is one I featured earlier this year. But that was a long time ago now, so I'll post it again.
Romeo and Juliet, is an orchestral work composed by Pyotr Ilyich Tchaikovsky. It is styled an Overture-Fantasy, and is based on Shakespeare's play of the same name. Like other composers such as Berlioz and Prokofiev, Tchaikovsky was deeply inspired by Shakespeare and wrote works based on The Tempest and Hamlet as well.
But the overall design is a symphonic poem in sonata form with an introduction and an epilogue. The work is based on three main strands of the Shakespeare story. It starts off in F-sharp minor -- and then segues into B-minor -- and ends up B-major.
It was not well received at its premiere on March 16, 1870 -- and Tchaikovsky was forced to rewrite much of it -- and he revised the ending once again ten years later. That version is the one that we know today, which was premiered in Tbilisi, Georgia on May 1, 1886.
Today's concert is by the Netherlands Radio Philharmonic Orchestra, led by conductor Slobodeniouk -- and the performance dates from November 16, 2018. The link is here.
With low volumes it both gold and silver, the Big 8 shorts et al. had little trouble keeping precious metal prices in line yesterday. Their presence was most obvious when the dollar index 'rally' commenced at 9:45 a.m. in New York -- and that 'rally' looked just as manufactured as the accompanying sell-offs in all four precious metals that began at that precise moment as well.
And while on the subject of the Big 8 shorts, I was certainly taken aback by the fact that they piled further onto the short side during the last reporting week...especially in gold -- and that had to have happened on the big rally on Tuesday, the cut-off day for this week's COT Report, when gold rallied above and close above its 200-day moving average.
They obviously made little if any attempts to cover even a small portion of their short positions in silver and gold during the first four days of the past reporting week -- and by extension, one would expect that they haven't done anything in either platinum or palladium, as it's a given that they're the predominate short sellers in those two precious metals as well.
I don't know what their plan is, if that have one that is -- and they haven't been able to improve their short positions by delivering into them, either. To make matters worse is the fact that the Managed Money traders don't look like they're overly eager to go back on the short side like they've done in the past -- and on top of that is record amount of net long contracts that have been built up by the the traders in the 'Other Reportables' category, as they were the big buyers in gold futures during this past reporting week. They were one of the predominate buyers in silver as well.
So the Big 8 are not only stuck on the short side, they've been digging their graves ever deeper over the last many months...especially this past week. It's a mystery that awaits resolution -- and I must admit that I'm not entirely sure what that might be, although a short covering rally for the ages appears to be their only option at this stage of the game. I'll believe it when I see it.
But with their backs to the wall, it would be not be wise to underestimate their treachery.
However, the current market structure in the COMEX futures market is very bullish in both precious metals, so it remains to be see what they can accomplish in the face of that.
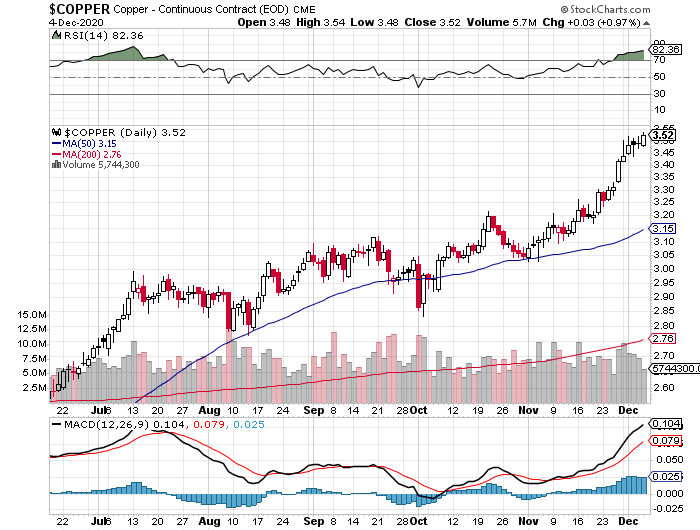
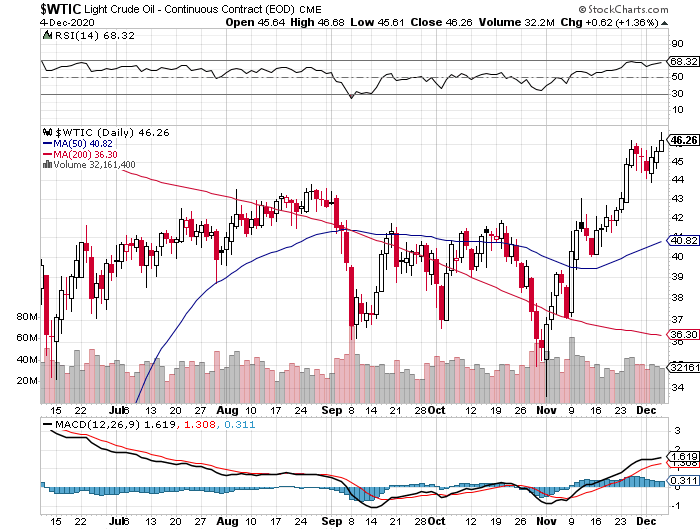
Here are the 6-month charts for the Big 6 commodities, courtesy of stockcharts.com as always. Gold's rally appears to be stalling, thanks to the Big 8 shorts, but I could be mistaken about that. I think the same of silver, as it closed above its 50-day moving average by 6 cents -- and platinum had another big day, although like palladium, would have closed at heaven-only-knows what price if that engineered dollar index 'rally' hadn't appeared in the nick of time. Copper closed higher by another 3 cents -- and WTIC tacked on another 62 cents a barrel. Click to enlarge.
|
|
|
|
|
|
|
|
|
|
|
|
Another week has passed -- and there's still no new or re-elected U.S. president yet declared. The stories about the obvious election fraud are everywhere you care to look. Doug Casey spoke about it in a piece I posted earlier this week when he commented that "something like 75% of Republicans, and even 25% of Democrats, think the election was rigged. It would serve to delegitimize the whole political process." -- and that article is linked here if you missed it. Then there's the commentary by Jim Rickards in today's Critical Reads section -- and that's linked here if you passed on it before.
But what set me back the most on this issue this past week was Lt. General Michael Flynn's first interview since President Trump's pardon, where he talks about the ongoing coup d'état. On the line with him is his life-long friend Lt. General McInerney -- and his comments are even more explosive. The word 'treason' came up multiple times.
The interviews run for 68 minutes -- and they were posted on the worldviewweekend.com Internet site on Friday, November 28. For obvious reasons it had to wait for today's column -- and I thank Judy Sturgis for sending it along. Another link to it is here -- and it's definitely a must listen.
This attempted coup by the deep state has been a long time in the making -- and is the centerpiece of G. Edward Griffin's classic tome..."The Creature From Jekyll Island: A Second Look at the Federal Reserve".
Gregory Mannarino speaks about it often, as a corporate takeover by big business, big banking, Wall Street and the military, as they combine forces with the deep state players entrenched in government. Another name for it is fascism...or worse. Eisenhower was right on the money when he spoke about he dangers of the "military/industrial complex"...as those chickens are coming home to roost now.
From thenewamerican.com Internet site...
"The deliberations of the Constitutional Convention of 1787 were held in strict secrecy. Consequently, anxious citizens gathered outside Independence Hall when the proceedings ended in order to learn what had been produced behind closed doors. The answer was provided immediately. A Mrs. Powel of Philadelphia asked Benjamin Franklin, "Well, Doctor, what have we got, a republic or a monarchy?" With no hesitation whatsoever, Franklin responded, "A republic, if you can keep it.""
I fear greatly for that Republic at this point in history.
So, where do the precious metals...gold and silver in particular...fit into all this?
That's a good question for which I have no answer...nor does anyone else, I suspect.
Any answer given, including mine, falls into the wild-ass speculation category right out of the gate.
I've always been of the opinion over the last number of years that the precious metals will be the only assets worth owning when this Everything Bubble meets its pin...either by design, or by circumstance.
That feeling has grown stronger with each passing year -- and has been reinforced even more by the amount of precious metals that have been going into all the world depositories, mutual funds and ETFs over the last several years...a situation that has accelerated dramatically this year.
I've also been convinced that it was the deep state big money creatures that were doing the accumulating in preparation for the end of this current economic, financial and monetary regime which, in my opinion, is an event that they will precipitate themselves.
I must admit that the election fraud that's been perpetrated on the American people caught even me by surprise at the outset, as not in my wildest imaginations did I think that the deep state would be brazen enough to attempt it. As a matter of fact, it never even crossed my mind.
But over the decades they managed to pull off Pearl Harbor, assassinate one of the most outstanding president's the U.S. has ever had...JFK -- and don't get me started on the events of 9/11...or on this virus thingy, their latest trick.
Gold and silver have been money and stores of value throughout all of human history, notwithstanding what Nixon was forced to do back in 1971 -- and those accumulating it hand over fist for the last several years, know that as well.
And whatever the future holds for the good folks in the U.S.A. -- and the rest of the citizens of Planet Earth, I expect that to continue as long as fiat currencies rule the earth.
I'm just hoping that there will be something left to enjoy when our day in the sun finally arrives.
I'm still "all in".
Ed


