NOTE: Nick Laird of goldchartsrus.com fame -- and whose charts grace this column every day of the year, has opened his website for free access for a week starting now -- and the link to this free gift, which is well worth your while, is here.
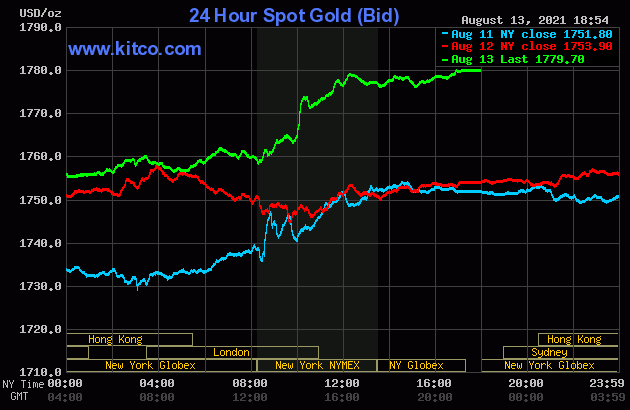
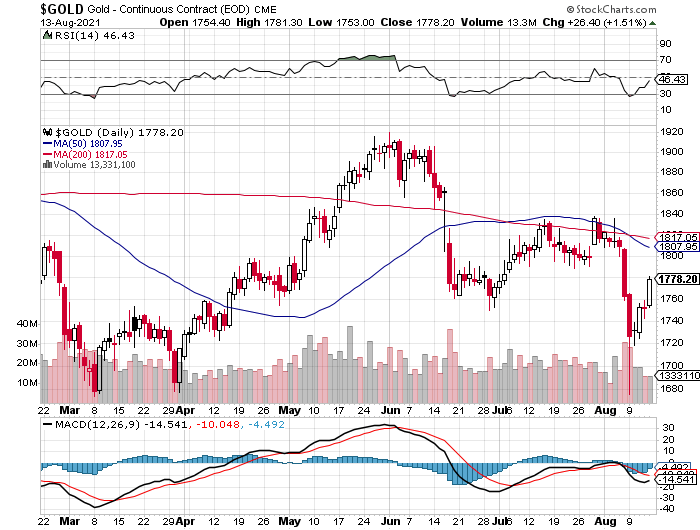
The gold price began to wander quietly and somewhat unevenly higher starting shortly after 9 a.m. China Standard Time on their Friday morning -- and that lasted until the 10 a.m. EDT afternoon gold fix in London. It jumped higher at that point, but obviously ran into 'something' within minutes. It continued to rally a bit from there until 12:15 a.m. in New York trading. It then crept a bit lower until shortly after 3 p.m. in the after-hours market -- and rallied a few more dollars from that juncture until trading ended at 5:00 p.m. EDT.
The low and high ticks in gold were recorded by the CME Group as $1,753.00 and $1,781.90 in the December contract -- and $1,751.60 and $1,779.60 in October. The August/October price spread differential in gold at the close yesterday was 80 cents...October/December was $2.20 -- and December/February was $2.10 an ounce.
To show you how tight the wholesale gold market is right now, the contango between August and February is only $5.10 the ounce in total.
Gold finished the Friday trading session in New York at $1,779.70 spot, up $25.80 from its Thursday close -- and a dollar and a bit off its Kitco-recorded high tick of the day. Net volume was very quiet for the second day in a row at a bit under 135,000 contracts -- and there was 10,500 contracts worth of roll-over/switch volume in this precious metal.
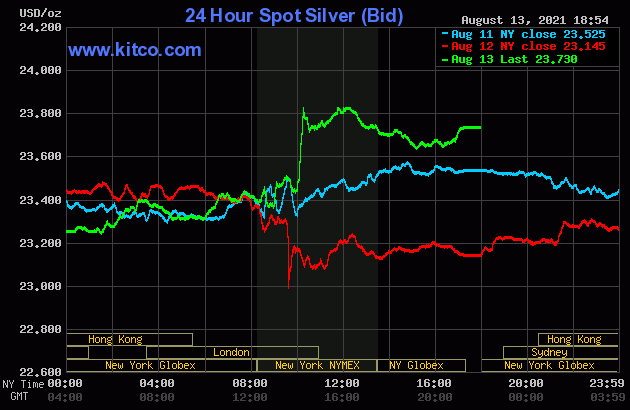
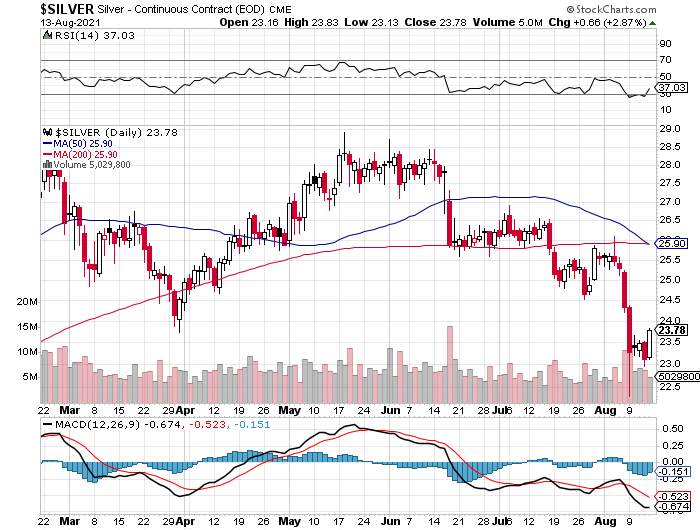
The silver price quietly stair-stepped its way higher in Far East and morning trading in London -- and then blasted higher the moment that the afternoon gold fix was put to bed at 10 a.m. EDT. It was viciously capped minutes later -- and then turned lower at the same time as gold...starting around 12:15 p.m. in COMEX trading in New York. After that, its trading pattern was also similar to gold's, complete with its rally in the after-hours market.
The low and high ticks in silver were reported as $23.13 and $23.83 in the September contract. The September/December price spread differential in silver at the close yesterday was 5.3 cents...December/March was 5.4 cents -- and March/May was 4.1 cents an ounce.
Silver was closed in New York on Friday afternoon at $23.73 spot, up 58.5 cents from Thursday. Net volume was very much on the lighter side at just about 44,500 contracts -- and there was a bit under 10,500 contracts worth of roll-over/switch volume out of September and into future months...mostly December, with a bit into the New Year as well.
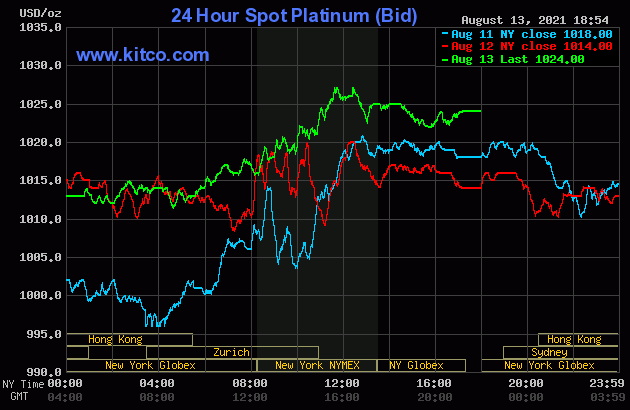
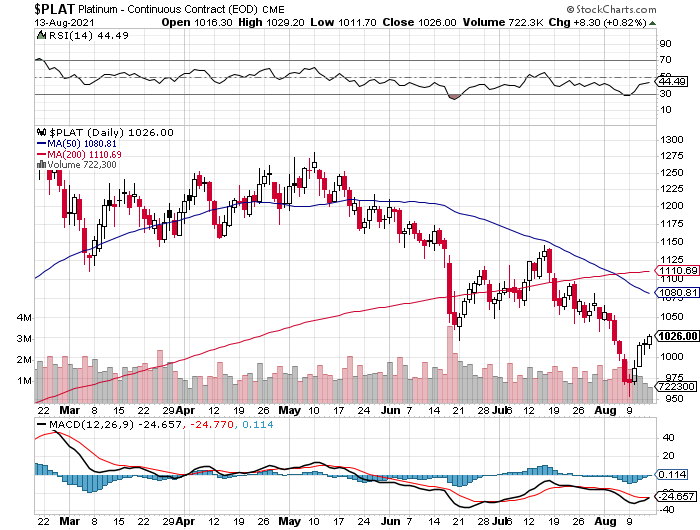
The platinum price was sold a bit lower in the early going in the Far East -- and after recovering a few dollars in short order, didn't do much until a rally of some merit commenced around 11:30 a.m. in Zurich. That ran into 'something' around 11:35 a.m. in New York -- and less than an hour later some quiet selling pressure appeared -- and that lasted until an hour or so before the 5 p.m. EDT close. Platinum was closed at $1,024 spot, up 10 dollars on the day -- and 13 bucks off its Kitco-recorded high tick of the day.
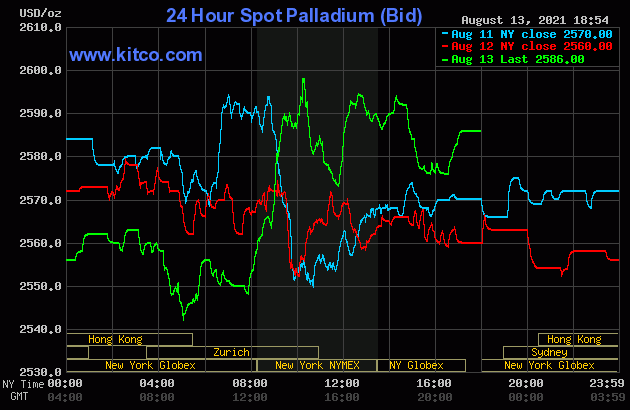
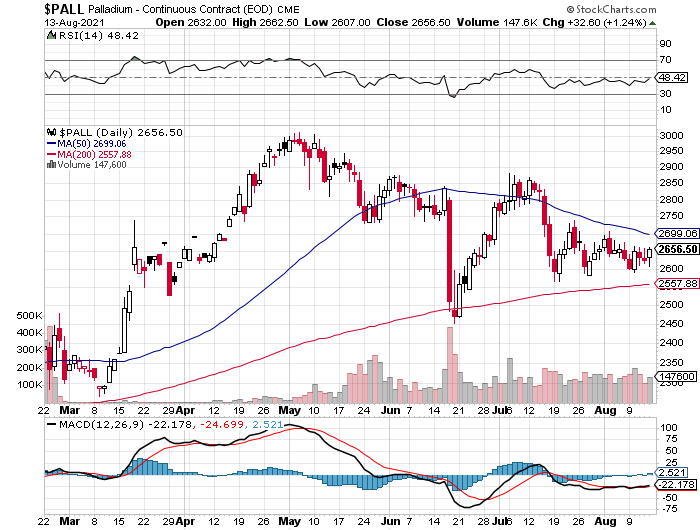
Palladium's jump higher at the 6:00 p.m. open in New York on Thursday evening was capped and turned lower almost immediately -- and from that juncture it wandered unevenly lower until the low tick for the day was set a few minutes after 11 a.m. in Zurich. It then took off higher starting minutes before 2 p.m. CEST/8 a.m. in New York -- and the short sellers of last resort put in fork in it very shortly after the 10 a.m. EDT afternoon gold fix in London. It was sold very unevenly lower from there until the market closed at 5:00 p.m. EDT. Platinum was closed at $2,586 spot, up 26 dollars from Thursday.
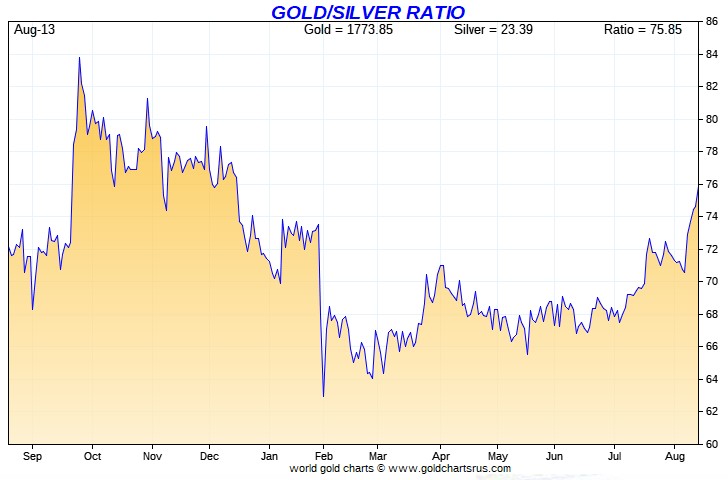
Based on the kitco.com spot closing prices in silver and gold posted above, the gold/silver ratio worked out to 75.0 to 1 on Friday, compared to 75.8 to 1 on Thursday.
And here's Nick's 1-year Gold/Silver Ratio chart, updated with the last five days of data. Click to enlarge.
![]()
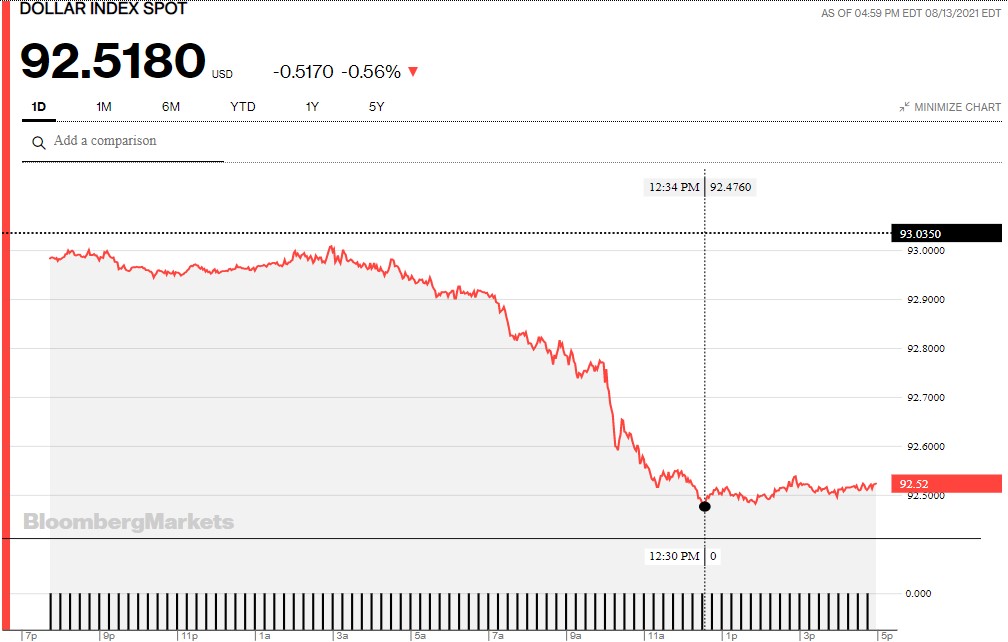
The dollar index closed very late on Thursday afternoon in New York at 93.035 -- and then opened lower by 5 basis points once trading commenced around 7:45 p.m. EDT on Thursday evening, which was 7:45 a.m. China Standard Time on their Friday morning. It had a very quiet down/up between then and its high tick of the day, which came a few minutes before the London open. The ensuing fall from grace ended at its low tick, which came a minute or so before 12:35 p.m. in New York. From that point it crawled a tiny bit higher until trading ended at 5:00 p.m. EDT.
The dollar index finished the Friday session in New York at 92.518...down just about 52 basis points from its close on Thursday.
Here's the DXY chart for Friday, thanks to Bloomberg as always. Click to enlarge.
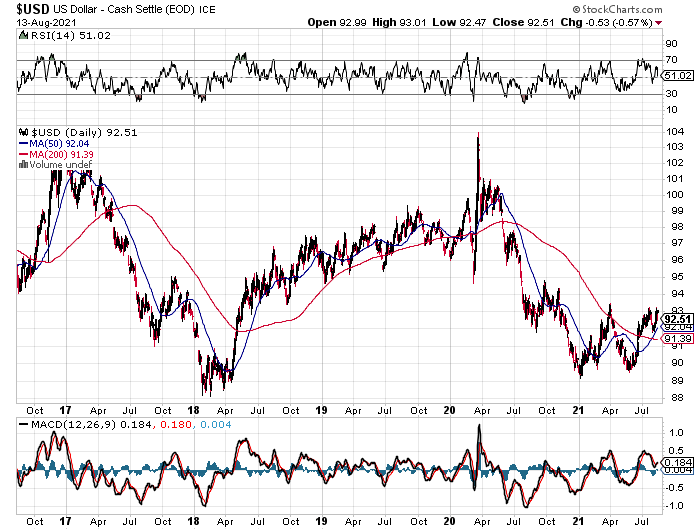
And here's the 5-year U.S. dollar index chart that appears in every Saturday column in this spot -- and comes courtesy of the good folks over at the stockcharts.com Internet site. The delta between its close...92.51...and the close on the DXY chart above, was about 1 basis point below its spot close on Friday. Click to enlarge as well.
The dollar index took a nose dive at, or minutes before the 10 a.m. EDT afternoon gold fix in London -- and 'da boyz' had to cap silver and gold prices at that point. Because from thereon in, despite the fact that the DXY continued to fall until around 12:35 p.m...that part of its decline was not allowed to be fully reflected in the respective prices of either gold or silver.
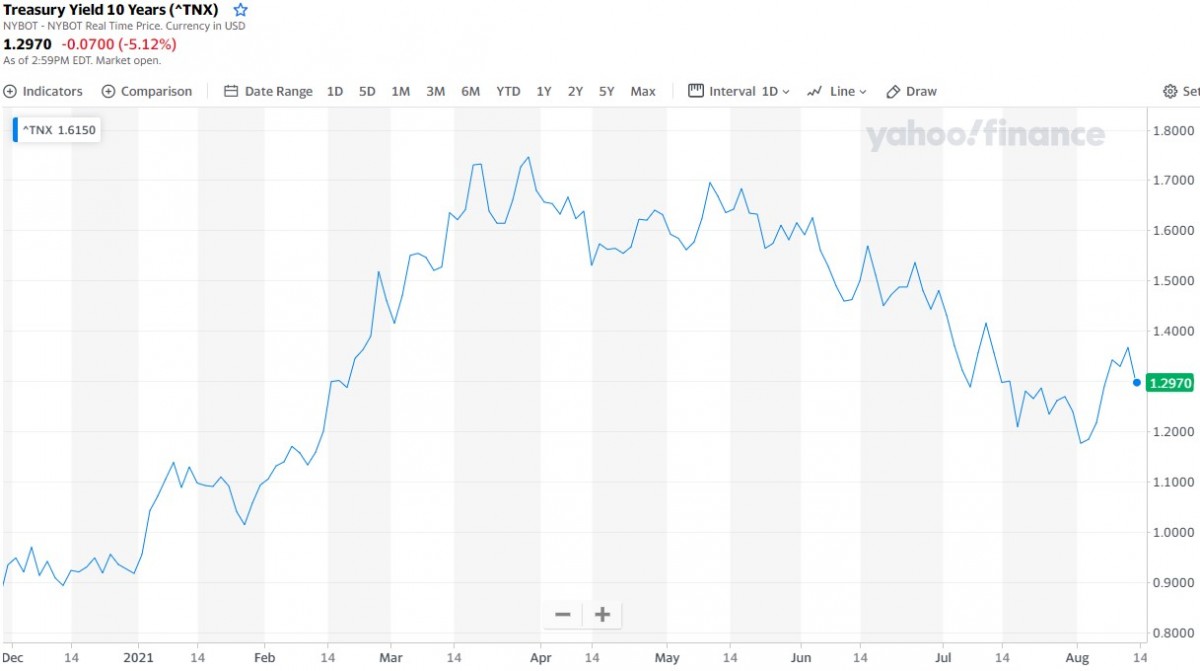
U.S. 10-Year Treasury: 1.2970%...down 0.0700 (-5.12%)...as of 2:59 p.m. EDT.
Here's the one-year 10-year U.S. Treasury chart, courtesy of finance.yahoo.com as always -- and as I keep pointing out, you can see where the Fed began yield curve control in March. Click to enlarge.
![]()
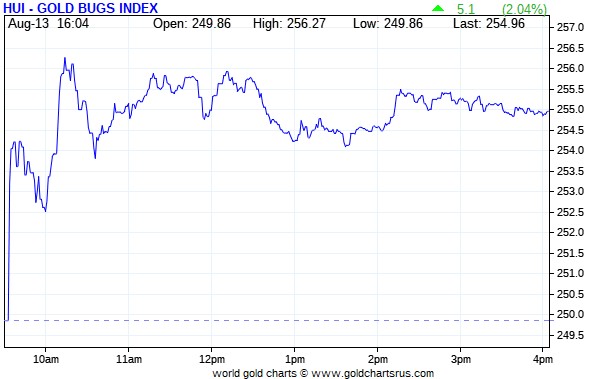
The gold stocks jumped higher in two steps as soon as trading began at 9:30 a.m. in New York on Friday morning -- and their respective high ticks were set when the gold price was capped shortly after 10 a.m. EDT. And despite the fact that the gold price rallied from there until trading ended, the gold stocks were sold a bit lower, before wandering quietly and unevenly sideways until the market close at 4:00 p.m. EDT. I was more than underwhelmed, as the HUI closed higher by only 2.04 percent.
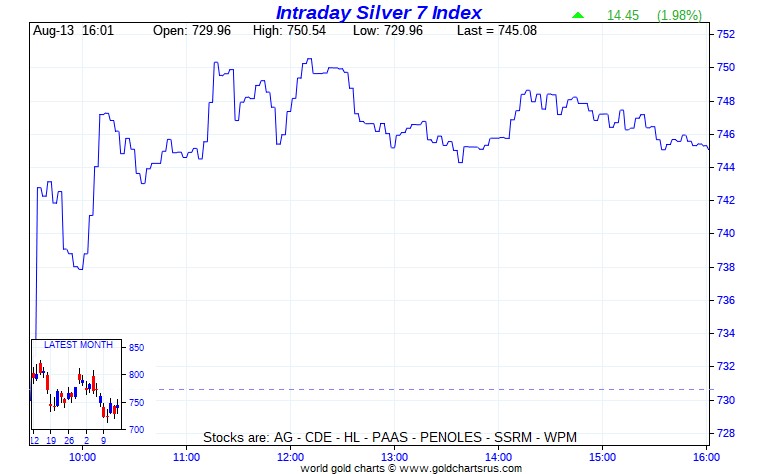
The silver equities fought their way higher until around 11:15 a.m. in New York trading -- and less than an hour later they began to drift lower. That lasted until the market closed at 4:00 p.m. EDT. Nick Laird's Intraday Silver Sentiment/Silver 7 Index closed up only 1.98 percent. I was totally underwhelmed.
Computed manually, the above index closed higher by only 1.93 percent.
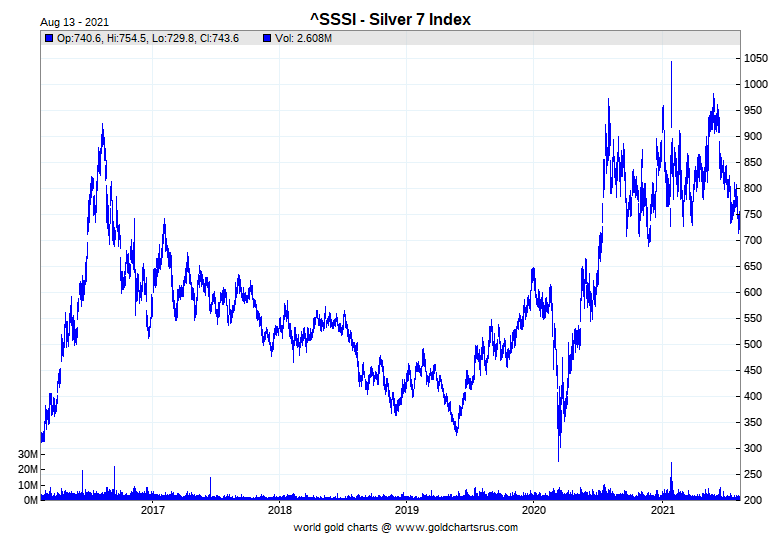
And here's Nick's 5-year Silver Sentiment/Silver 7 Index chart, so you can see what's happening currently vs. the longer term. Click to enlarge as well.
The two stars were SSR Mining and Wheaton Precious Metals, closing higher by 3.82 and 3.47 percent respectively. The absolute dog was Peñoles, as it actually closed down on the day by 1.49 percent -- and on very decent volume for it.
But I should point out that the rally in the silver stocks at the open yesterday morning ran into some fairly stiff [not-for-profit?] selling pressure on the way to their highs of the day -- and that certainly affected the overall performance of the shares.
Here's some new silver eye candy from the reddit.com/Wallstreetsilver crowd. I thank U.K. reader Nigel McHale for sending it our way -- and it's the first photo linked here.
![]()
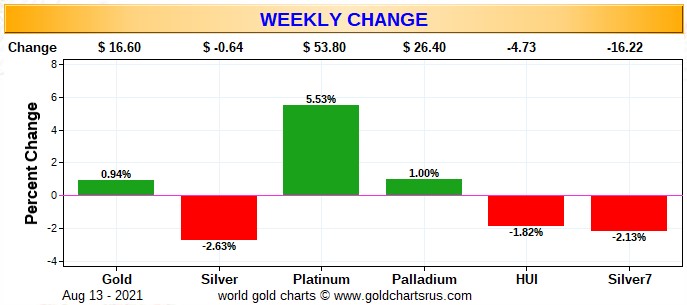
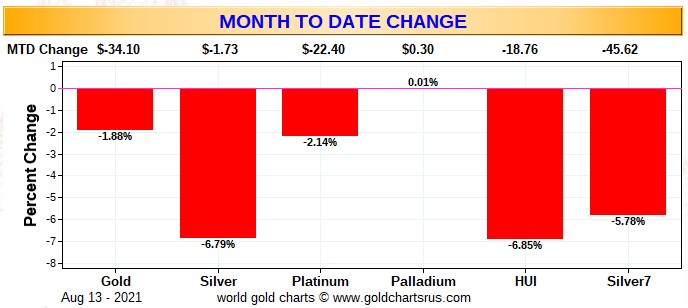
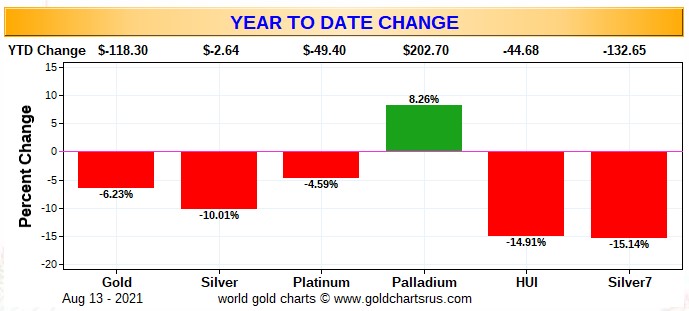
Here are the usual three charts that show up in every Saturday missive. They show the changes in gold, silver, platinum and palladium in both percent and dollar and cents terms, as of their Friday closes in New York — along with the changes in the HUI and the Silver 7 Index.
First off is the weekly chart -- and silver was the obvious 'underperformer'... courtesy of the Big 8 shorts. Even though gold closed higher on the week by a hair, their underlying equities couldn't manage the same feat. Click to enlarge.
Next is the month-to-date chart, which is now two weeks old -- and except for palladium, which is unchanged, it's a sea of red. Of course silver was the big loser, as it's the Big 8 shorts No. 1 problem child -- and it got hit the hardest for that reason. But it should be very carefully noted that the silver equities vastly 'outperformed' their golden cousins, despite that fact. Click to enlarge.
And here's the year-to-date chart -- and palladium is the only thing up on the year. Last week, this chart showed that gold and silver and their associated equities had both 'underperformed' about equally year-to-date, which I thought rather surprising at the time. But with this past week's performance added in, the underperformance of the gold equities is far more noticeable. However, it's a given that the underperformance of both precious metals won't last forever...or for long I would imagine. Click to enlarge.
As Ted Butler has pointed out on many occasions, the short positions of the Big 8 traders in general -- and the Big 4 short commercial traders in particular, are the sole reason that precious metal prices aren't at the moon already, as just about every other group of traders in the COMEX futures market are net long against them in all four precious metals...including all the rest of the traders in their respective commercial categories.
In the COT discussion further down, the commercial net short positions in both gold and silver fell by the expected huge amounts.
But as far as the Big 8 traders in gold was concerned, they barely made a dent in their monstrous short position, as Ted's raptors, the small commercial traders other that the Big 8, were hugely aggressive buyers during the reporting week -- and are now net long the COMEX futures market in gold. In silver, the Big 8 shorts fared far better, but even their improvement was relatively small in comparison to the overall.
The CME Daily Delivery Report showed that 15 gold and zero silver contracts were posted for delivery within the COMEX-approved depositories on the U.S. east coast on Tuesday.
In gold, the sole short/issuer was Marex Spectron -- and of the three long/stoppers, JPMorgan was the largest, picking up 12 contracts for its client account.
The link to yesterday's Issuers and Stoppers Report is here.
So far in the August delivery month, there have been 25,382 gold contracts issued/reissued and stopped -- and that number in silver is 1,939 contracts. There have also been 561 platinum contracts issued and stopped -- and that number in palladium is 2 COMEX contracts.
As Ted has pointed out for about decade now, JPMorgan is the big kahuna in everything gold and silver related. In gold so far this month they have issued 5,796 contracts out of their client account -- and stopped 8,646 contracts for clients as well. They have also stopped 3,929 contracts for their house account. In silver they have issued 1,541 contracts out of their client account -- and have stopped 710 contracts for clients as well.
The CME Preliminary Report for the Friday trading session showed that gold open interest in August dropped by 852 contracts, leaving 254 still around, minus the 15 contracts mentioned a few paragraphs ago. Thursday's Daily Delivery Report showed that 742 gold contracts were posted for delivery on Monday, so that means that 852-742=110 gold contracts vanished from the August delivery month. Silver o.i. in August declined by 14 contracts, leaving 161 still open. Thursday's Daily Delivery Report showed that 14 silver contacts were actually posted for delivery on Monday, so the the change in open interest and deliveries match for the second day in a row.
Total gold open interest at the close yesterday increased by only 768 COMEX contracts -- and total silver o.i. actually declined by 2,863 contracts...most likely short covering in both. These numbers are subject to some revision, usually downwards, by the time the final numbers are posted on the CME's website on Monday morning CDT.
There was a withdrawal from GLD yesterday, as an authorized participant took out 56,133 troy ounces of gold -- and there were no reported changes in SLV.
In other gold and silver ETFs and mutual funds on Planet Earth on Friday, net of any changes in COMEX, GLD & SLV inventories, there was a net 15,560 troy ounces of gold removed, but a net 26,951 troy ounces of silver was added.
The U.S. Mint had a sales report for the second day in a row, but this one was on the smallish side. They reported selling 3,000 troy ounces of gold eagles -- and 2,000 one-ounce 24K gold buffaloes.
Month-to-date the mint has sold 58,500 troy ounces of gold eagles...16,500 one ounce 24K gold buffaloes -- and 1,581,000 silver eagles.
I've been checking the Royal Canadian Mint's website for the last week or so now, hoping to discover their Q2/2021 Report, but so far, nothing...
There wasn't much activity in gold over at the COMEX-approved depositories on the U.S. east coast on Thursday. Nothing was reported received -- and only 10,513.377 troy ounces/327 kilobars was shipped out.
In the 'out' category, there were 280 kilobars that left Brink's, Inc. -- and the remaining 47 kilobars departed HSBC USA.
There was some paper activity, as 22,573 troy ounces was transferred -- and every ounce of that amount made the trip from the Registered category and back into Eligible...13,214.061 troy ounces/411 kilobars over at Malca-Amit USA...followed by the 6,272 ounce that was transferred at Brink's, Inc. The remaining 3,086.496 troy ounces/96 kilobars was transferred in that direction over at Loomis International. The link to all of Thursday's COMEX activity in gold, is here.
It was pretty quiet in silver as well. There was 139,243 troy ounces received -- and all of that ended up at Delaware. Only 975 troy ounces/one good delivery bar was shipped out -- and that departed Brink's, Inc. There was some paper activity, as 175,297 troy ounces was transferred from the 'Registered category and back into Eligible over at Manfra, Tordella & Brookes, Inc. The link to Thursday's silver activity is here.
But the big action on Thursday happened over at the COMEX-approved gold kilobar depositories in Hong Kong on their Thursday. They reported receiving 6,534 of them -- and shipped out 279. Except for the 150 kilobars that was dropped off at Loomis International, the remaining in/out activity occurred over at Brink's, Inc. as always. The link to that, in troy ounces, is here.
![]()
Here are the usual two 20-year charts that show up in this space almost every Saturday. They show the total amount of physical gold and silver in all know depositories, ETFs and mutual funds as of the close of business on Friday.
For the week just past, there was a net 66,000 troy ounces of gold removed -- and in silver, there was a net 1,539,000 troy ounces added. Click to enlarge for both.
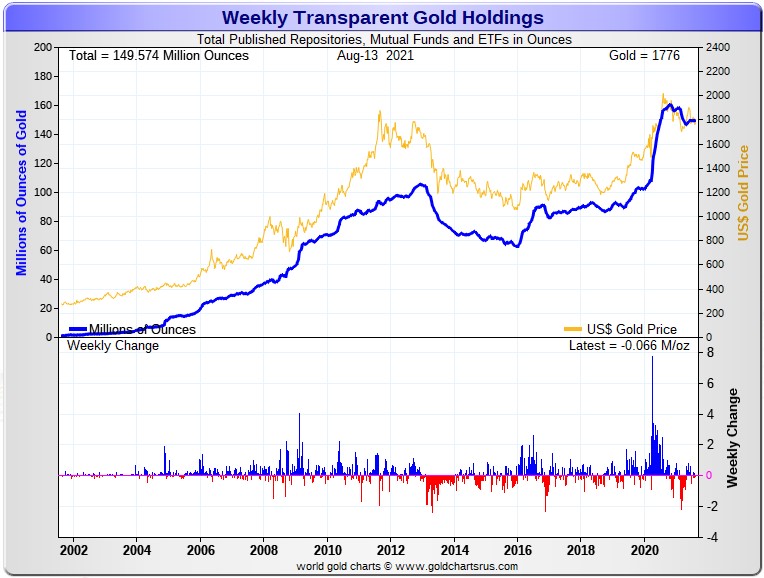
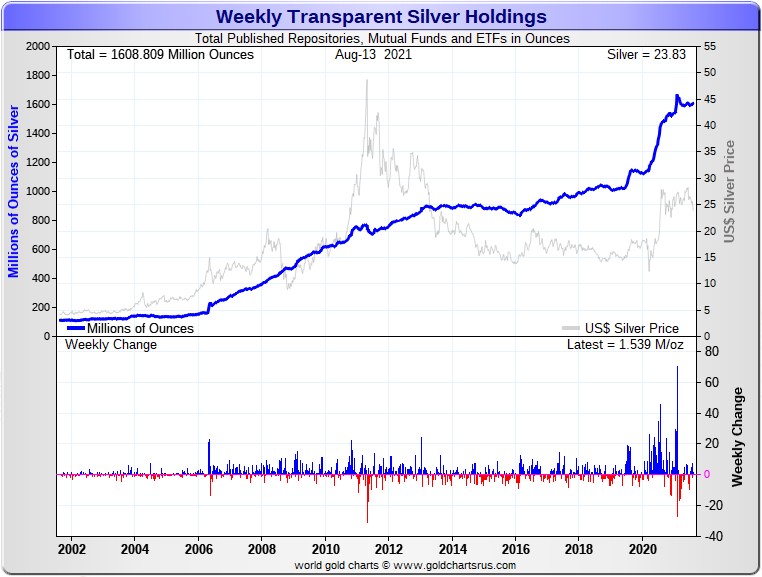
Considering the price action in the precious metals this past week, the above numbers are simply astounding.
The silver number is particularly impressive, although that's mainly because of the 2+ million ounces that was added to SLV a couple of days ago. But even taking that into consideration, that's an incredible number as well.
Looking at the above two charts, one would never know that eye-watering engineered price declines had ever occurred in silver and gold during the last two weeks.
In fact, since late April in silver -- and the start of May in gold, there have been very slight increases in the total amount of gold and silver held in all known depositories, ETFs and mutual funds. That's despite the fact that gold and silver prices have been beaten into the dirt by the Big 8 traders since June 1 for gold -- and mid-June for silver.
That shows you just how tightly held the physical precious metals are -- and investors are hanging onto them with both arms and legs, despite the punishment handed out by the Big 8 shorts over that time period.
They're not fooled, as they know what's coming at some point in the near future.
![]()
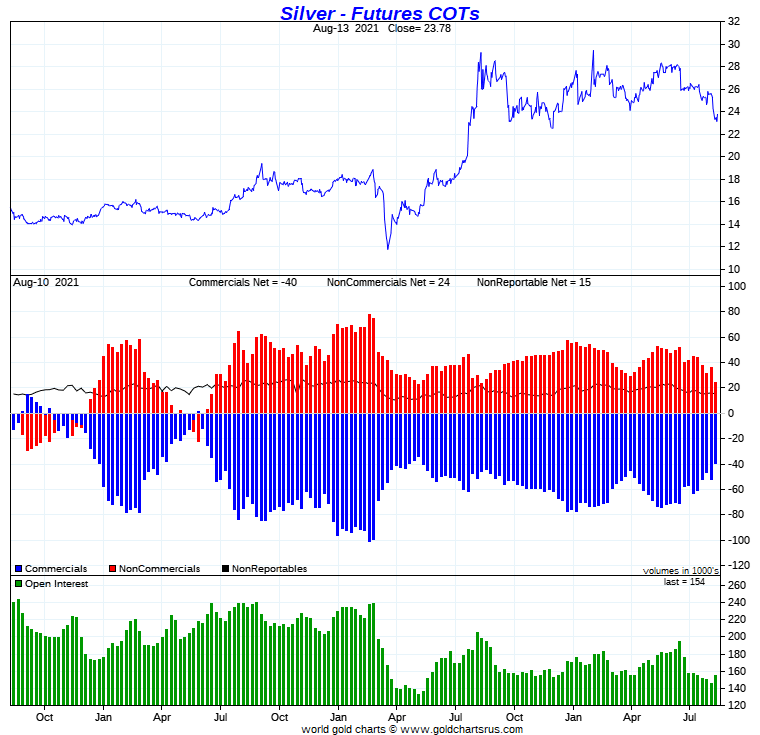
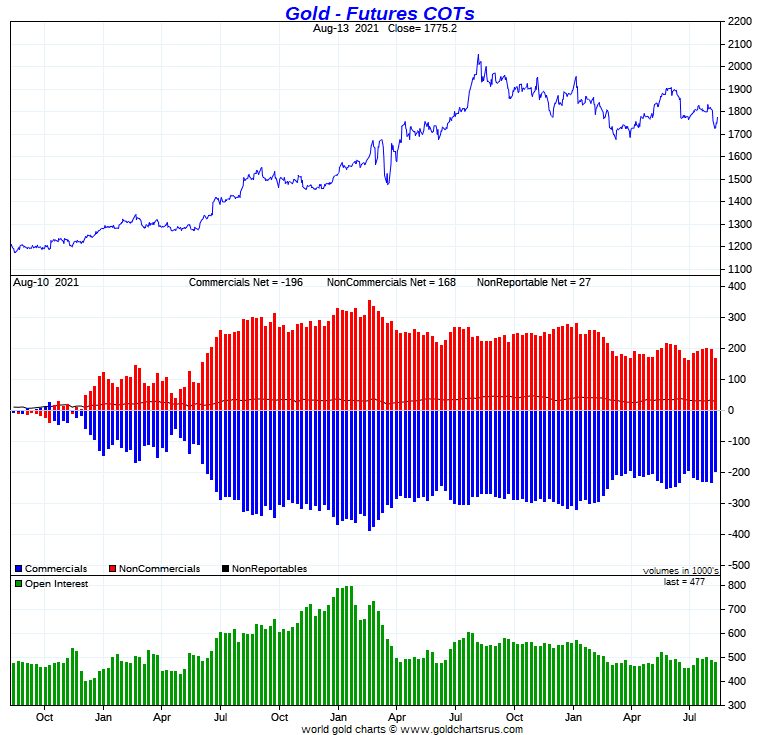
The Commitment of Traders Report, for positions held at the close of trading on Tuesday, August 13 was the blockbuster that both Ted and I were expecting...and then some!
In silver, the Commercial net short position fell by 12,321 COMEX contracts, which equates to 61.6 million troy ounces.
They arrived at that number by increasing their long position by 9,166 COMEX contracts -- and also reduced their short position by 3,155 contracts. It's the sum of those two number that represents their change for the reporting week.
Under the hood in the Disaggregated COT Report, it was all Managed Money traders, plus a bit more, as they reduced their net long position by 13,670 COMEX contracts. Of that amount...9,423 contracts were new short positions put on. Ted wasn't overly happy about that, but I guess it should have come as no surprise.
The Nonreportable traders also decreased their net long position, them by 656 contracts. But the Other Reportables went in the other direction, as they increased their net long position by a fairly hefty 2,005 contracts.
Doing the math: 13,670 plus 656 minus 2,005 equals 12,321 COMEX contracts, the change in the Commercial net short position.
The Commercial net short position now stands at only 199.2 million troy ounces, down from the 260.8 million troy ounces they were short in last week's COT Report.
The Big 8 are short 271.9 million troy ounces of silver in this week's COT Report, compared to the 309.9 million troy ounces they were short in last week's Report...so they improved their short position by a fairly decent amount...38.0 million troy ounces.
However, the Commercial net short position in the headline number in silver dropped by 61.6 million troy ounces during the reporting week...so where did the other 61.6-38.0=23.6 million troy ounce decrease come from?
It came from Ted's raptors, the 31-odd small commercial traders other that the Big 8...as they are all long the silver market. They bought that amount during the reporting week -- and I'll continue the discussion on this in the 'Days to Cover' commentary a bit further down.
The short position of the Big 8 traders is larger than the Commercial net short position in silver by about 136 percent, compared to the 119 percent they were short in last week's COT Report. That increase is because of all the long contracts that Ted's raptor bought, as they're in the Commercial category as well, despite the fact that they're small, as it all adds up.
Here's the 3-year COT chart for silver, courtesy of Nick Laird as always -- and the change should be duly noted. Click to enlarge.
So, are we done to the downside? One would think so, but as Ted continually points out, one can never underestimate the treachery of the Big 4 shorts.
I would suspect that yesterday's rally in silver involved big selling by Ted's raptors, the commercial traders other than the Big 8, who are mega long the COMEX silver market. They would be locking in decent profits. And since silver's current price is well below any moving average that would cause the Managed Money traders to buy, it's a given that the Big 4/8 shorts were buying every long that the small traders have been selling since the Tuesday cut-off.
In gold, the commercial net short position fell by a chunky 35,643 COMEX contracts, or 3.56 million troy ounces.
They arrived at that number by increasing their long position by 3,371 contracts -- and also covered 32,272 short contracts. It's the sum of those two numbers that represents their change for the reporting.
And as impressive as the numbers for silver were in the Disaggregated COT Report, the changes under the hood in gold in that report were simply staggering!
The Managed Money traders reduced their net long position by an absolutely eye-watering 54,470 COMEX contracts, of which 33,442 contracts was new shorting. The Nonreportable/small traders also decreased their net long position by a huge amount...7,714 contracts. 'All of the above' means that the traders in the Other Reportables category had to go long big time -- and they did just that...to the tune of 26,541 contracts.
Doing the math: 54,470 plus 7,714 minus 26,541 equals 35,643 COMEX contracts, the change in the commercial net short position.
The commercial net short position in gold now sits at 19.57 million troy ounces, down big from the 23.13 million troy ounces they were short in last week's COT Report.
The short position of the Big 8 traders stood at 22.10 million troy ounces in this week's COT Report, compared to 22.83 million troy ounces they were short in last week's COT Report...down only 730,000 troy ounces from last week's COT Report.
What?
The headline number showed that that commercial net short position decreased by 3,560,000 troy ounces...a difference of 3,560,000-730,000=2,830,000 troy ounces from the number in the previous paragraph.
That meant that Ted's raptors, the small commercial traders other than the Big 8, were hugely aggressive buyers during the reporting week...increasing their long position by that amount...around 28,300 COMEX contracts!
The Big 8 traders are short about 113 percent of the commercial net short position in gold...up from that 99 percent that they were short in last week's report -- and that's entirely due to the monster long-buying by the small commercial traders during this reporting week.
Here's Nick Laird's 3-year COT chart for gold, updated with Friday's data -- and the weekly change should be noted. Click to enlarge.
But between these raptors and the Other Reportables, who also went mega long in gold during the reporting week, it's my opinion that all their long-buying was most likely insider trading of one type or another...friends, relative and business associates of the Big 4/8 shorts who knew these engineered price declines were coming. I brought this up with Ted -- and he thought that was most likely as well.
Of course the flip side to this is the fact that despite their huffing and puffing, the short position of the Big 4/8 traders improved by a negligible amount -- and Ted is of the opinion that this is the best they're likely to do considering how aggressively the Raptors and Other Reportables are buying longs against them.
However, as he most succinctly pointed out in his mid-week commentary on Wednesday..."Not for a moment would I underestimate the treachery and guile of the COMEX commercial shorts. But regardless of how skilled and corrupt they may be, they are still bounded by the realities that exist."
Those realities may have been reached this week.
Now, all that matters is whether these same Big 4/8 will go back on the short side when the next serious rally in the precious metals is allowed to begin.
Ted thinks not -- and so do I. But there are no guarantees.
In the other metals, the Managed Money traders in palladium increased their net long position by a fairly healthy 440 COMEX contracts during the last reporting week -- and are net long the palladium market by 2,981 COMEX contracts...around 29 percent of the total open interest...up about 5 percentage points from last week's report. In platinum, the Managed Money traders increased their net short position by a further 4,749 contracts -- and are now net short the platinum market by 8,879 COMEX contracts. In a strange twist they, along with the Big 4/8 traders, are the only categories that are short platinum right now. The other three categories are mega long, including the rest of the commercial traders. In copper, the Managed Money traders decreased their net long position by a further 7,544 COMEX contracts -- and are net long copper by only 31,102 COMEX contracts...about 778 million pounds of the stuff -- and about 16 percent of total open interest...down about 2 percentage points from last week.
![]()
Here’s Nick Laird’s “Days to Cover” chart, updated with the COT data for positions held at the close of COMEX trading on Tuesday, August 10. It shows the days of world production that it would take to cover the short positions of the Big 4 — and Big '5 through 8' traders in each physically traded commodity on the COMEX.
I consider this to be the most important chart that shows up in the COT series -- and it deserves a minute of your time. Click to enlarge.
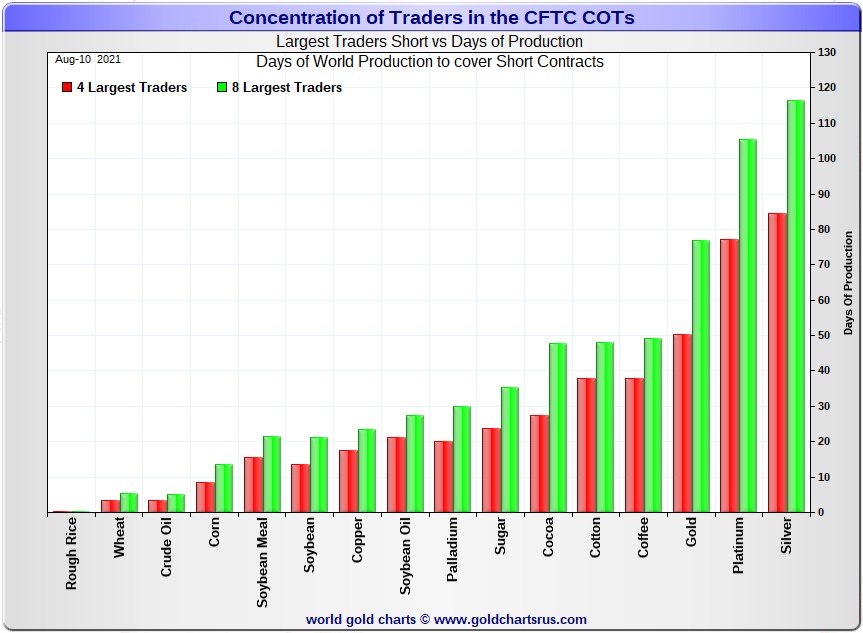
In it, the Big 4 traders are short about 84 days of world silver production, down about 16 days from the prior week's report. The ‘5 through 8’ large traders are short an additional 32 days of world silver production...down about 1 day from the prior COT Report for a total of about 116 days that the Big 8 are short...down a whopping 17 days from last week's COT report. [In the prior reporting period they were short 133 days of world silver production.]
That 116 days that the Big 8 are short, represents just under four months of world silver production, or 271.9 million troy ounces of paper silver held short by the Big 8.
In the COT Report above, the Commercial net short position in silver was reported by the CME Group at 199.2 million troy ounces. As mentioned in the previous paragraph, the short position of the Big 4/8 traders is 271.9 million troy ounces. So the short position of the Big 4/8 traders is larger than the total Commercial net short position by 271.9-199.2=72.7 million troy ounces...up about 23.6 million troy ounces/4,720 COMEX contracts from last week's report.
This long buying by the small commercial traders was in direct competition with the buying by the Big 4/8 shorts.
The reason for the difference in those numbers two paragraphs ago...as it always is...is that Ted's raptors, the 31-odd small commercial traders other than the Big 8, are net long that amount...72.7 million troy ounces.
Another way of stating this [as I say every week in this spot] is that if you remove the Big 8 shorts from the commercial category, the remaining traders in the commercial category are net long the COMEX silver market. It's the Big 8 against everyone else...a situation that has existed for almost five decades in silver, platinum and palladium -- and now in gold as well.
As per the first paragraph above, the Big 4 traders in silver are short around 84 days of world silver production in total. That's about 21 days of world silver production each, on average...down 4 days from last week's COT Report. The four big traders in the '5 through 8' category are short 32 days of world silver production in total, which is 8 days of world silver production each, on average...down a bit from last week's COT Report.
I don't remember the last time that the short positions of the Big 8 was this low, but I know that Ted will have that data in his weekly review this afternoon.
And it's also obvious that the Big 4 shorts were much more aggressive in their short covering than the Big '5 through 8' shorts during this past reporting week...although much more in silver than in gold.
The Big 8 commercial traders are short 35.2 percent of the entire open interest in silver in the COMEX futures market, which is down a knee-wobbling amount from the 42.4 percent they were short in last week's COT report. And once whatever market-neutral spread trades are subtracted out, that percentage would be a bit over the 40 percent mark. In gold, it's 46.3 percent of the total COMEX open interest that the Big 8 are short, which is down only a tiny amount from the 47.0 percent they were short in last week's COT Report -- and something over the 50 percent mark once their market-neutral spread trades are subtracted out.
In gold, the Big 4 are short 50 days of world gold production, down about 3 days from last week's COT Report. The '5 through 8' are short 27 days of world production -- up about 1 day from last week's report, if you can believe it...for a total of 77 days of world gold production held short by the Big 8 -- and down about 2 days from the prior COT Report. Based on these numbers, the Big 4 in gold hold about 65 percent of the total short position held by the Big 8...down about 2 percentage points from the prior week's COT Report.
The "concentrated short position within a concentrated short position" in silver, platinum and palladium held by the Big 4 commercial traders are about 72, 73 and 67 percent respectively of the short positions held by the Big 8...the red and green bars on the above chart. Silver is down about 2 percentage points from last week's COT Report...platinum is also down 2 percentage points from a week ago -- and palladium is down about 1 percentage point week-over-week.
And as I keep saying month after month, despite the recent improvements in the short positions of the Big 4/8 traders...including the price bombings last Friday -- and again on Monday, they're still hugely short in all four precious metals in the COMEX futures market. But it's now mostly the Big 4...or probably just the Big 2 or 3...Citigroup, Bank America and HSBC -- and the above chart tells you all you need to know about their current plight.
They're still stuck on the short side -- and that's for the very simple reason that the Managed Money traders are no longer willing to go mega short like they used to in the past. Yes, they did increase their short positions by notable amounts during this past reporting week, but not enough to make any material difference to the short positions of the Big 8 traders...particularly in gold. And because of that, the Big 4/8 traders can't cover.
The situation regarding the Big 4/8 shorts continues to be beyond obscene, twisted and grotesque...especially the Big 2/4 -- and as Ted correctly points out, its resolution will be the sole determinant of precious metal prices going forward.
I have a very decent number of stories, articles and videos for you today.
![]()
CRITICAL READS
Consumer sentiment measure falls to pandemic-era low, sees one of largest drops on record
A key consumer sentiment reading saw a dramatic drop in early August as the delta variant of Covid-19 increased fears about the path of the economy, the University of Michigan said Friday.
The consumer sentiment index tumbled to 70.2 in its preliminary August reading.
That is down more than 13% from July’s result of 81.2 and below the April 2020 mark of 71.8 that was lowest of the pandemic era.
It was the lowest reading for the measure since 2011. Economists surveyed by Dow Jones were expecting a reading of 81.3 for August.
And a sudden drop of that magnitude is extremely rare for the index.
“Over the past half century, the Sentiment Index has only recorded larger losses in six other surveys, all connected to sudden negative changes in the economy,” Richard Curtin, chief economist for the University of Michigan’s Surveys of Consumers, said in a release. Two of those larger month-over-month movers were April 2020 amid the pandemic and October 2008, during the financial crisis.
This rather brief news item appeared on the cnbc.com Internet site at 10:43 a.m. EDT on Friday morning -- and was updated about five hours later. I thank Swedish reader Patrik Ekdahl for sending it our way -- and another link to it is here. The Zero Hedge spin on this is headlined "American Consumer Sentiment Crashes Below COVID Crisis Lows, Inflation Fears Rebound" -- and a directly related ZH story is headlined ""A Sudden Negative Change in the Economy": Consumer Spending Slides as Majority Now Expect a New Slowdown". Both come to us courtesy of reader B.R.
"Worse Than The '70s" -- Schiff Stunned at Soaring Import/Export Prices
Import price inflation slowed again in July, falling from +11.3% YoY to +10.2% YoY (still high by any measure). However, export prices rebounded unexpectedly to +17.2% from +16.9% YoY ion June (and well beyond the +16.0% YoY expected)...
Notably, Import prices ex-petroleum rose just 0.1% m/m after rising 0.7% in June (and ex-food and fuels saw a 0.1% MoM drop in July).
Additionally, import prices from China are at their highest since Dec 2015...
Given the relative scale of U.S. exports vs. imports this report should ease some fears of growing trade deficits and also supports - at the margin - the idea that U.S. inflation is transitory. However, we would note that we are way beyond base effects here from 2020's crash and these extremely high inflation prints are looking very sticky for now.
Peter Schiff was, as usual, not afraid to share his opinion on these still shockingly high numbers...
"Export prices rose 1.3% in July. YOY they're up 17.2%. The 2021 gain is 13.5%, which annualizes to a shocking is 23%. It's likely that prices of goods we don't export rose by a similar percentage. 23% is a more honest measure of #inflation than the CPI. It's worse than the 1970s!"
This very brief 2-chart article showed up on the Zero Hedge website at 8:39 a.m. EDT on Friday morning -- and I thank reader B.R. for sending it along. Another link to it is here. Gregory Mannarino's post market close rant for Friday is linked here -- and that's from reader B.R. as well.
After stepping down as Fed Chair on February 3, 2018, Janet Yellen began a whirlwind of speaking engagements that netted her millions of dollars over the next two years. But when it came time to disclose those fees after she was nominated by President Biden to become Treasury Secretary, Yellen disclosed only the fees she had made in 2019 and 2020, not the millions she had made in fees in 2018. What Yellen did disclose showed more than $7 million in speaking fees, with the bulk of that coming from Wall Street banks, trading houses and hedge funds.
As the news broke this past January about Yellen’s cash haul, Senior Reporter Jesse Eisinger of ProPublica Tweeted this: “Deeply troubling two-fisted money grab from banks by Janet Yellen. This is corruption, but isn’t called that because it’s so quotidian.” Eisinger added: “Sure, Yellen might think she can make independent decisions once in office. But how arrogant is it to imagine that money corrupts everyone but you?”
Yellen brought this distrust on herself. Now the American people have a right to echo Jesse Eisinger and ask: how arrogant is it for Janet Yellen to think she can black out phone calls and meetings on her daily appointment calendar as U.S. Treasury Secretary and not fall under suspicion.
Yellen’s Daily Appointment Calendar shows that in her first three months in office, she has blacked out (redacted) 73 phone calls or meetings.
This very interesting but not surprising commentary from Pam and Russ Martens put in an appearance on the wallstreetonparade.com Internet site on Friday sometime -- and I thank reader B.R. for pointing it out. Another link to it is here.
David Stockman on Why the Printing Press Is the Most Profitable Business in the World
The Fed is the most profitable company in the world by far.
While it owns nothing except ultra-low-yielding government bills, notes, bonds and GSEs, in 2020 it nevertheless made more net income than Apple, Microsoft, JP Morgan, Facebook, McDonald’s, Coca-Cola, Walmart, Home Depot, Intel, Johnson & Johnson, Bank of America, Nike, Visa, Amazon, and Netflix combined.
Yes, combined!
The $322 billion of net profit was not a COVID-year aberration. The Fed has actually earned an average profit of $350 billion per year for the last decade.
So the question recurs: How does it earn such massive net income on assets that barely generate a yield?
The first order effect of unbridled central bank balance sheet expansion is far lower bond yields than would exist on the free market under a regime of sound money.
The mechanism by which this financial fraud is accomplished is plain as day. When the Fed buys Uncle Sam’s debt, bond supply shrinks, prices rise and yields fall. So doing, the Fed invites all economic actors to borrow like there is no tomorrow because it has deeply and deliberately falsified the cost of carry.
Eventually, the Fed’s money-pumping ultimately leads to CPI inflation. That’s because governments are induced to borrow at will to fund a ballooning level of transfer payments — the wherewithal for household spending which is not matched with an equivalent increase in the supply of goods and services.
Stated differently, the Fed exchanges fiat credits for real financial assets that Washington had previously issued to fund the purchase of labor, capital and technology resources.
The best way to understand today’s inflationary tidal wave and why we are in wholly uncharted monetary waters, is to review the Fed’s actual financial statements. They are almost never remarked upon, but they actually make the idea of creating money from thin air come dramatically alive because money printing is insanely profitable when you have a legal monopoly.
There is really no mystery as to why the Fed is so profitable: It harvests interest income from its $8.1 trillion asset portfolio like a normal bank, modest as the yields may be. But unlike commercial banks, the Fed’s funding costs or liabilities entail hardly any expense at all.
That’s because it prints them!
This rather brief commentary from David showed up on the internationalman.com Internet site on Friday sometime -- and another link to it is here.
I’ve witnessed scores of spectacular booms and busts during my career. I’ve witnessed nothing comparable to China’s Bubble. The world should be panicky. Instead, there is near absolute faith in the Beijing meritocracy.
Late-eighties “decade of greed” excesses were incredible – until they were completely overshadowed by the “roaring nineties”. I thought 1999 was a once-in-a-career experience. The 2008 mortgage finance Bubble collapse destroyed the myth that Washington had everything under control. Yet we’re now into the 13th year of the global government finance Bubble. Especially since the pandemic crisis response, manic excess has gone off the rails. The world should be panicky. Instead, it’s all business as usual, with near absolute faith in the power of central bank QE.
It’s unethical to impose years of negative real returns upon savers, coercing them into the securities markets. Having a small group of central bankers manipulating market yields is the antithesis of free market capitalism. And the longer zero rates and artificially low market yields are imposed, the more extreme the underlying market, financial and economic maladjustment. Injecting Trillions of new “money” directly into the securities markets is pernicious inflationism and a deleterious redistribution of wealth. Yet, to the markets, none of that matters. What matters tremendously is that the Federal Reserve sticks with policies to inflate stock, bond and home prices.
I have posited that the great vulnerability of contemporary finance is that it doesn’t work in reverse. It appears miraculous, so long as finance is expanding and asset prices are inflating. Markets are these days content to disregard myriad risks because of confidence in the Fed’s willingness and capacity to sustain the monetary boom. Non-crisis, open-ended QE changed everything.
Inflation today poses a huge risk. A sustained inflationary surge would force the Fed to withdraw stimulus, ending the illusion of never-ending central bank market support. Historic Bubbles would lose their foundations. To this point, Federal Reserve officials have been able to assert “transitory.” The Fed would be in a precarious situation if inflation angst was stoking bond market instability. But the bond market is underpinned by open-ended QE and prospects for faltering Bubbles and resulting Trillions of additional Fed purchases.
It’s an extraordinary paradox: the bond market’s disregard for inflation risk increases the likelihood inflationary pressures attain self-reinforcing momentum.
Inflation complacency rests on the simple assumption that previous inflation dynamics will be sustained well into the future. Yet there is a confluence of unprecedented developments that point to a new paradigm. We have never witnessed such sustained monetary inflation, both at home and abroad. At the same time, fiscal deficit spending is unprecedented in a peacetime environment.
Doug's column showed up on his website around 1:30 p.m. Pacific Daylight Time this morning -- and another link to it is here.
Beirut Goes Dark As Economic Tailspin Sees Dire Fuel & Electricity Shortages
Starting Wednesday night Lebanon's Central Bank announced that fuel subsidies have been halted, already at a moment where there's been scarcity of both gas and electricity. Fuel prices are expected to at least quadruple, leading to a national scramble for fuel, exacerbating rolling blackouts akin to what's become the tragic "norm" of recent years in neighboring war-torn Syrian.
International reports are underscoring that the enduring economic crisis beginning in 2019 which sparked a year of mass protests and a currency crisis, and subsequent failed attempts to stave off total collapse amid a drastic "shock" change in government, are now coming to a head, sending already impoverished areas of the country of nearly seven million spiraling into steadily worsened conditions.
Regional director of humanitarian aid NGO Crisis Group, Heiko Wimmen, was cited in CNN as saying "This is obviously going to ripple through the whole economy." He emphasized that seemingly overnight basic staples that support daily life have now become a "luxury".
"For a large part of the population, electricity will become a luxury. Driving your car will become a luxury, too. Transportation will become a luxury," Wimmen added.
The cutting of subsidies was expected, but still a "shock" nonetheless. Like everything else in Lebanon energy has been severely mismanaged, after already the government suspended lines of credit to fuel importers.
So the sudden liberalization of fuel prices meant whole villages, towns, and parts of cities were plunged into darkness overnight as not even generators could keep the lights on...
By all accounts things look to get worse before they get better - and compounding all this remains U.S. and E.U. sanctions on both Lebanon and Syria.
This sad, sad story put in an appearance on the Zero Hedge website at 11:45 p.m. on Thursday night EDT -- and another link to it is here.
U.S. Embassy in 'Burn Documents' Stage as Taliban Advances on Afghan Capital
The State Department has ordered the U.S. embassy in Kabul to begin shredding all sensitive and classified materials as the Taliban heads for the capital city:
"A memo obtained by NPR lays out the emergency preparations underway by American diplomats at the U.S. Embassy in Kabul — including the destruction of sensitive documents and computers — as most of them prepare to leave the country.
...The embassy staffers were instructed to destroy important papers and desktop computers before they leave, according to the document."
"Taliban forces are now operating just 50 km [31 miles] from Kabul and have cut power cables leading into the city, depriving it of electricity, Luca Lo Presti, president of Pangea, an Italian humanitarian organisation which operates in Afghanistan," has told Sputnik."
It's a disastrous scene reminiscent of Tehran in 1979 during the Islamic Revolution, which saw the U.S. embassy there attacked, resulting in fifty-two American diplomats and citizens being held hostage, kicking off the lengthy Iran hostage crisis.
Earlier in the day Friday it was widely reported that Washington has formally asked the Taliban to 'spare' the embassy from attack should Kabul fall.
Let the burning and shredding of documents begin...
Despite prior U.S. intelligence assessments predicting Kabul's fall "within six months" or even the latest forecast of "one month to 90 days" - it's increasingly looking like a rapid Taliban blitz on the capital could begin as soon as this weekend or next week.
What's becoming increasingly obvious is that the rapid jihadist gains are due in large part to U.S.-trained Afghan national forces frequently retreating with little or no resistance put up whatsoever. What's also clear is that U.S. Empire is in retreat, humiliated after following the course that all empires have in central Asia, going back to Alexander the Great.
This rather spectacular news story was posted on the Zero Hedge website at 5:40 p.m. on Friday afternoon EDT -- and another link to this is here. Another ZH story [via antiwar.com] on this from earlier in the day is headlined "U.S. Asks Taliban to 'Spare' Its Embassy in Coming Kabul Battle". If you ask me, dear reader, I suspect that the Taliban will bulldoze what's left of the place after they blow up what they can.
CNN: Afghanistan's Fall Is a Neville Chamberlain-esque Failure and It's Joe Biden's Fault
CNN national security analyst Peter Bergen greeted Joe Biden’s vacation with a harsh but factual assessment of the rapidly deteriorating situation in Afghanistan: It is Biden’s fault.
"A group of religious warriors, riding on captured American military vehicles, vanquish a U.S.-trained military, which relinquishes much of its power without a fight.
Sound familiar?
That’s what happened in Iraq after the U.S. withdrawal of troops from the country at the end of 2011. Within three years, an army of ISIS fighters was only a few miles from the gates of Baghdad and had taken many of the significant cities in Iraq.
It was then-Vice President Joe Biden who had negotiated the Obama administration’s draw-down from Iraq."
Anyone who has watched Joe Biden’s career could and should have seen this coming. For all his and his supporters’ claims that he is some foreign policy expert, Joe Biden has been expert at getting foreign policy questions wrong. He wanted to pay Iran cash right after 9-11, just because he wanted to. His own staff killed that notion. He’s still trying to pay Iran in cash, just as the Obama administration did while Biden was vice president. One could surmise that Joe Biden really wants to hand Iran, which backs terrorism against Israel and has declared itself an enemy of the United States since the 1979 revolution, large piles of American cash. One could also surmise that Biden is on course to exceed even Jimmy Carter’s disastrous Middle East foreign policy — a foreign policy that helped beget revolutionary Iran in the first place.
Biden wanted to carve up Iraq along sectarian lines as some kind of solution to the violence that plagued the country following the U.S. invasion. Iran was fomenting much of that violence through proxies with the express intent of hurting the United States, destabilizing Iraq, and extending its influence. Any armchair analyst could see that from the comfort of home in the U.S. I saw it first-hand in Baghdad in 2007 and was given a classified briefing on the situation in detail by American Army officers who had been fighting that war for years. But Biden evidently never saw it and still doesn’t.
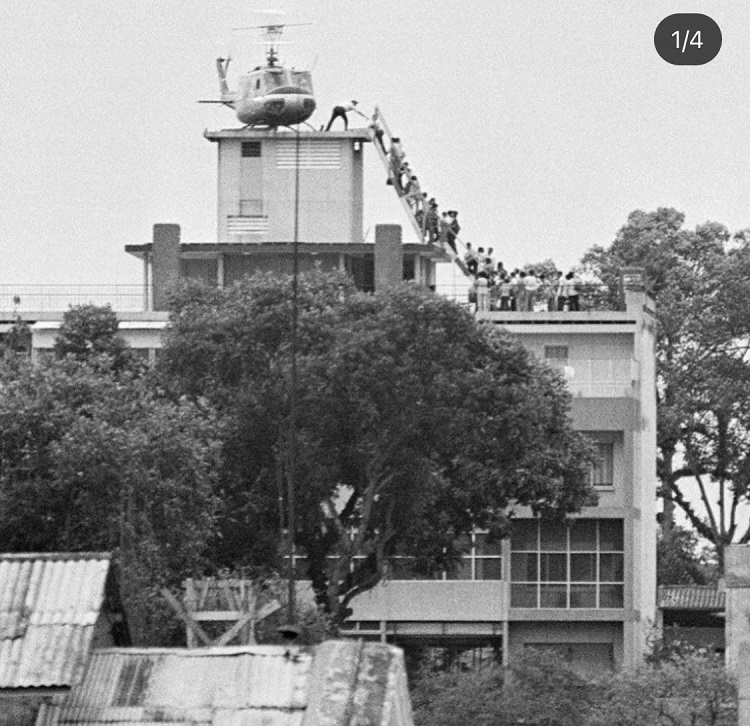
I'm surprised that the rather similar end to the Vietnam war wasn't mentioned in this article, but the author may have been too young to remember it. This very interesting and worthwhile commentary was posted on the pjmeida.com Internet site at 10:40 a.m. EDT on Friday morning. I thank reader Declan Barrett for bringing it to my attention -- and now to yours. I thank reader George Whyte for the B&W photo from Saigon c. 1975. Another link to it is here.
Ted Butler: The Bad, the Ugly and the Good
In the space of two trading days, the world of gold and silver prices was turned on its head. On Friday and Monday, silver plunged to its lowest level of 2021, gold touched its low for the year and the silver/gold price ratio also rose to its most undervalued level for silver of the year. Not that anyone needs reminding, let me first run through the bad and ugly aspects of the price smash before getting into what was good about it. And yes, the bad and the good overlap.
Typically, such out-sized moves occur against a backdrop of great volatility in other markets, but not this time – the extreme price declines in gold and silver were largely self-contained and glaringly specific. As such, it becomes easier to see that there was an intentional and deliberate motive to the bombing of gold and silver prices not camouflaged by movements in other markets. It was clear to see that the smashing of gold and silver was quite unique and specific. It’s bad enough when investors suffer sudden large markdowns in their holdings, but much worse is the thought that the losses were deliberately inflicted. That’s what pushes it into the ugly stage.
Not to keep beating a horse long dead, but the two-day price smash was purely a COMEX paper positioning production, designed and executed for the specific purpose of inducing as much non-commercial selling as possible, so that the commercials could buy as many contracts as possible. As a matter of certainty, this will be confirmed in Friday’s new Commitments of Traders (COT) report, which will undoubtedly feature non-commercial selling and commercial buying. Anyone not seeing this simply refuses to see.
So, once again, a relative handful of large traders manipulated gold and silver prices to their own advantage in paper COMEX dealings with the net result of creating sharp markdowns in the non-COMEX holdings of actual gold and silver metal and mining investments everywhere – not just on the COMEX. That’s the problem with the COMEX silver and gold price manipulation – it doesn’t matter that 99% of precious metals investors don’t deal directly on the COMEX – everyone, like it or not, is affected by it. If that’s not ugly, I don’t know what is.
This longish, but very worthwhile commentary from Ted appeared on the silverseek.com Internet site on Thursday morning sometime -- and I saved it for today column. Another link to it is here.
![]()
The Photos and the Funnies
Still heading north on B.C. Highway 97 on our way to BarkervilleviaQuesnel on September 6...we took a short detour off the highway to check out a small church perched on the east bank of the Fraser RiverValley. Once arriving on the scene, I took photo one looking southwest -- and it was immediately apparent from the jumble of trees at the bottom of the slope, that a large section of the river bank had slid down into the valley very recently...a fate that awaits the church and its associated graveyard in photo two at some point. A few hundred meters past the church I stopped to take photos three and four. The first one looking northwest -- and the river view at this spot was obscured by trees. Turning the camera to the northeast from the same spot, revealed another section of the riverbank that was the initial stages of what happened in photo one. The gravel/dirt road obviously ended up in someone's farm yard, so we went no further. Click to enlarge.


![]()
The WRAP
Today's pop 'blast from the past' certainly needs no introduction -- and neither does the American rock group that performers it. It was one of the three Top 10 singles from their album of the same name -- and was the band's commercial breakthrough, transforming them into international superstars back in 1975. This is a live performance recorded in Australia forty-six years later -- and it sounds identical to the original. The link is here. There's a bass cover to this -- and it's far more complex than I imagined it would be. The link to that is here.
Today's classical 'blast from the past' is the Piano Concerto No. 5 in E♭ major, Op. 73, by Ludwig van Beethoven, popularly known as the Emperor Concerto. It was his last completed piano concerto. It was composed between 1809 and 1811 in Vienna, and was dedicated to Archduke Rudolf, Beethoven's patron and pupil. The first performance took place on 13 January 1811 at the Palace of Prince Joseph Lobkowitz in Vienna, with Archduke Rudolf as the soloist.
The epithet of Emperor for this concerto was not Beethoven's own but was coined by Johann Baptist Cramer, the English publisher of the concerto.
The concerto is scored for solo piano, two flutes, two oboes, two clarinets in B♭ (clarinet I playing in A in movement 2), two bassoons, two horns, two trumpets, timpani in E♭ and B♭, and strings.
I've posted this work before, but it's been many years, so it's time for a revisit. Romanian pianist Alina Bercu is the soloist -- and she's accompanied by the Orchestra of the University of Music FRANZ LISZT Weimar. Nicolás Pasquet conducts. The recording dates from 16 November 2017 -- and except for the conductor and the soloist, nobody in the orchestra looks over 25 years old. Alina was 27 when this recording was made. The link is here -- and it's a wonderful performance. As is always the case, it sounds best on a first rate set of headphones.
It was fairly obvious that 'someone' stepped into the precious metal market during the New York trading session -- and that was particularly evident when both silver and gold took off higher after the 10 a.m. EDT afternoon gold fix in London.
But with gold and silver well below any moving average that mattered to the Managed Money traders, the obvious sellers were Ted's raptors, the small commercial traders other than the Big 8 selling for a profit, with the Big 8 shorts buying every long offered.
With volumes in both very light, Ted doubted that much if any damage was done to the already off-the-charts bullish COMEX future market structure that exists in these two precious metals.
And as I mentioned in my closing commentary on Friday's Commitment of Traders Report further up..."Now, all that matters is whether these same Big 4/8 will go back on the short side when the next serious rally in the precious metals is allowed to begin. Ted thinks not -- and so do I. But there are no guarantees."
And as you can tell from their chart patterns on the Kitco charts posted at the top of today's column, both platinum and palladium ran into price 'resistance' during the COMEX trading session yesterday as well.
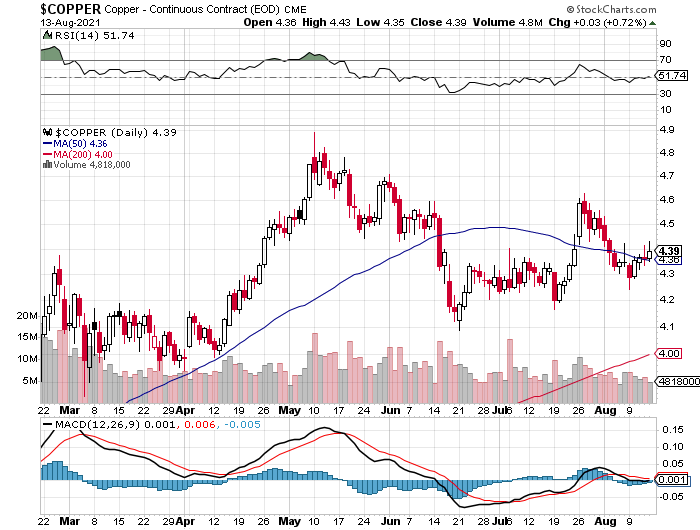
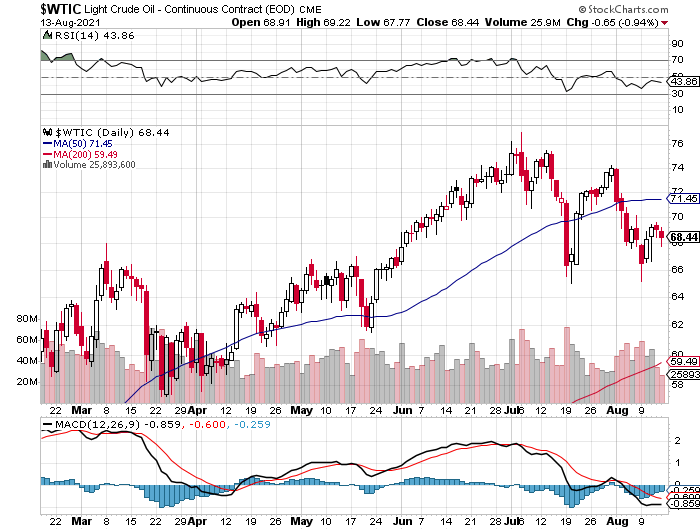
Copper closed higher by 3 cents a pound -- and back above its 50-day moving average by that amount. But WTIC closed down 65 cents a barrel.
Here are the 6-month charts for the Big 6 commodities, thanks to stockcharts.com as usual -- and you can view yesterday's price activity with some perspective. Click to enlarge.
In commentary headlined "A Date That Lives in Infamy" -- and posted on the dailyreckoning.com website yesterday, but for subscribers only...Jim Rickard had this to say:
"We’re just two days away from the fiftieth anniversary of one of the most famous dates in monetary history: August 15, 1971.
That was the day that President Richard Nixon ended the convertibility of dollars into gold bullion by U.S. trading partners. It was not the official end of the gold standard, but it was the beginning of the end.
Nixon said the suspension of convertibility was “temporary.”
I spoke with two of the officials present at Camp David with Nixon the weekend of the announcement, Paul Volcker and Kenneth Dam. They both confirmed to me that the suspension was meant to be temporary.
The plan was to have a new Bretton Woods style conference, devalue the dollar against gold (and against other currencies such as the yen, the Deutsche mark and French francs) and then return to the gold standard at the new valuations.
The first part happened – there was an international financial conference in Washington D.C. in December 1971 – but the rest did not. While the world was waiting for the conference, countries moved to floating exchange rates without reference to gold.
August 15, 2021 will be the Golden Anniversary of Nixon’s break with gold, but there’s nothing celebratory about it. We’ve had inflation and repeated financial crises (1977, 1994, 1998, 2008, 2020) ever since.
Will there be a new Nixon Moment when confidence is rapidly lost in one type of financial system and it is rapidly followed by another system?"
The answer to that is...nobody knows...and if the IMF/BIS/New World Order crowd have something up their sleeves, they're keeping it a closely-guarded secret.
But with that prominent anniversary less that 24 hours away, I'm more than suspicious that the two obviously engineered price declines that have occurred during the last six business days leading up that event, may have been the Big 8 shorts last swing for the fences.
As you know all too well, no financial system has ever survived for long without some sort of precious metal backing -- and the current one won't either.
Since the death of the gold exchange standard on that "Day of Infamy"...the Frankenstein financial system that has risen Phoenix-like from its ashes, has nurtured the biggest 'everything bubble' the world has ever known in all of recorded history.
There's no way out, other than a financial, economic and monetary collapse of Biblical proportions. That is a certainty at some unknown point in the future.
But whether the end comes by either design or by circumstance, matters not at this point in history. It's coming -- and the end to the commodities price management scheme that has been in place for almost the same fifty years, will be a welcome casualty of that collapse.
And whether or not the Big 8 shorts/powers-that-be use such an event to bash the precious metals one more time, remains to be seen. Even if they do, it just further cements into place the spectacular rise in commodity prices in general -- and the precious metals in particular that will follow that event...or run concurrently with it. This is pure speculation on my part, because after the events of the last week in the COMEX futures market, we could already be at that point.
Silver analyst Ted Butler has always been of the opinion that we would see one more big engineered price decline by the powers-that-be that would shake everyone's confidence to the core...even his and mine...before they stepped back and allowed a market-clearing rally of some sort.
He stated that fact once again in his mid-week commentary to his paying subscribers on Wednesday, when he said the following..."[T]he key to the silver (and gold) universe is still what the 8 big shorts intend to do on the next rally – do they add aggressively to shorts on the next rally (as they always have in the past) or do they stand aside and let prices soar (and even buy)? Not only would I continue to play it as the big shorts not adding aggressively to shorts from here on out, I can’t help but think this recent deliberate rout to the downside may be the signal that this is the grand finale in a manipulation that has run for decades."
From his lips to God's ears, dear reader -- and I'll see you here on Tuesday.
Ed
About the author

SUBSCRIBE: https://edsteergoldsilver.com/

Ed Steer’s Daily Analysis of the Gold and Silver Markets
After eight years of writing about the precious metals for Casey Research, the folks at Stansberry & Associates—who just recently purchased controlling interest in the company—decided that my ‘niche market’ column didn’t fit into their plans.
Since the time that Casey Research was kind enough to offer me a stand-alone column, it became their most highly-rated blog almost from the outset—and has remained that way up to this date...