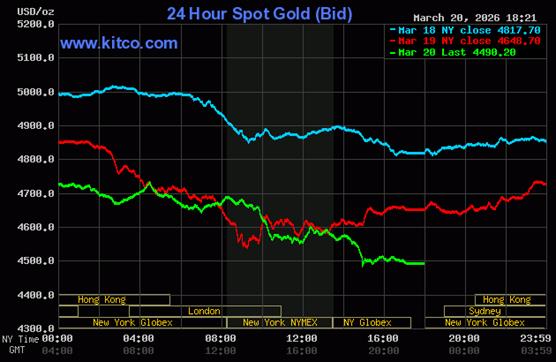
Gold's rally in early Globex trading in the Far East was capped around 11:15 a.m. China Standard Time on their Friday morning -- and from that point it was sold/engineered unevenly lower until they set its low tick around 2:55 p.m. in after-hours trading in New York. It then had a very quiet up/down move until the market closed at 5:00 p.m. EDT.
The high and low ticks in gold were reported as $4,738.20 and $4,478.40 in the April contract...an intraday move of $259.80 an ounce. The April/June price spread differential in gold at the close in New York yesterday was $34.70 ...June/ August was $36.30...August/October was $34.60 -- and October/ December was $35.70 an ounce.
Gold was closed in New York on Friday afternoon at $4,490.20 spot...down $158.50 on the day...and only $13.30 off its Kitco-recorded low tick. Net volume was only a tad on the heavier side at a bit under 166,000 contracts -- and there were 61,000 contracts worth of roll-over switch volume out of April and into future months in this precious metal...mostly June.
I saw that 235 gold, plus only 45 silver contracts were traded in March yesterday and, as is always the case, it remains to be seen just how much of these amounts show up in tonight's Daily Delivery and Preliminary Reports further down in today's column.
![]()
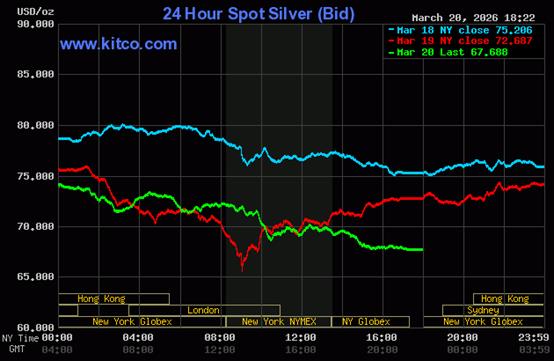
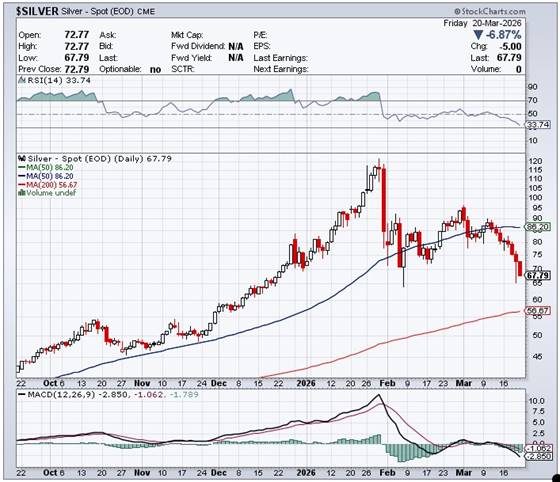
Silver's price path was managed in almost the same fashion as gold's, with its engineered low tick set around 3:25 p.m. in after-hours trading in New York. It didn't do much after that.
The high and low ticks in silver were recorded by the CME Group as $74.62 and $67.74 in the May contract...an intraday move of $6.88 an ounce. The March/May price spread differential in silver at the close in New York yesterday was 30.4 cents...May/July was 51.9 cents...July/September was 52.6 cents -- and September/ December was 70.8 cents an ounce.
Silver was closed on Friday afternoon in New York at $67.688 spot...down $5.00 from Thursday -- and only 13 cents off its Kitco-recorded low tick. Net HFT gold volume was on the lighter side at a tad under 41,000 contracts -- and there were just about 9,000 contracts worth of roll-over/switch volume in this precious metal.
![]()
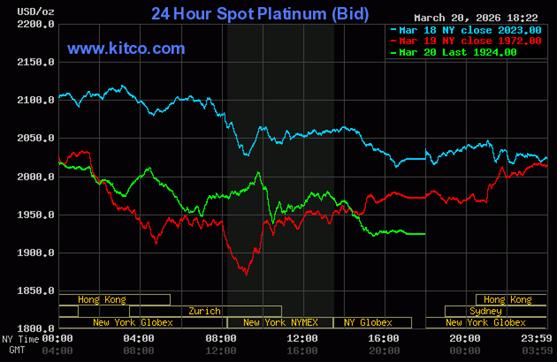
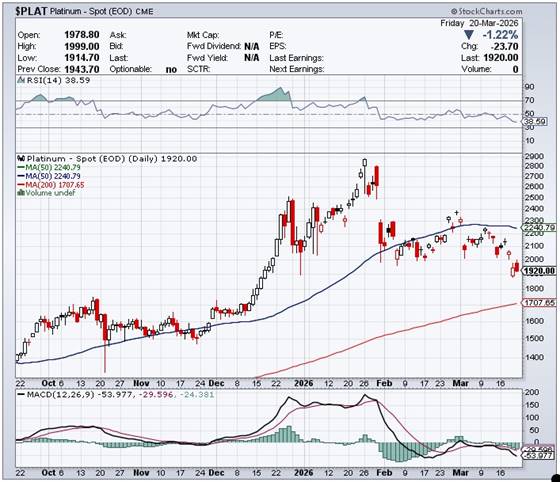
All rally attempts by platinum in both Globex trading overseas -- and in COMEX trading in New York, met the same fate. 'Da boyz' set its low tick around 3:15 p.m. in after-hours trading -- and it didn't do anything after that. Platinum was closed at $1,924 spot...down a further 48 bucks -- and only 5 dollars off its Kitco-recorded low tick.
![]()
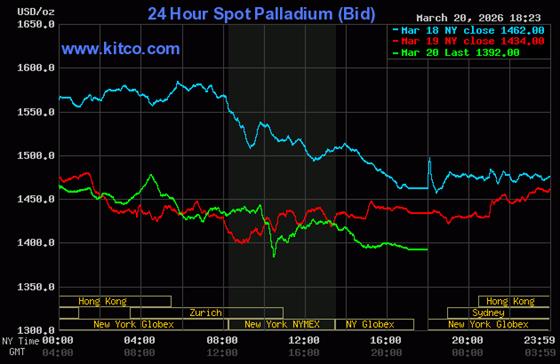
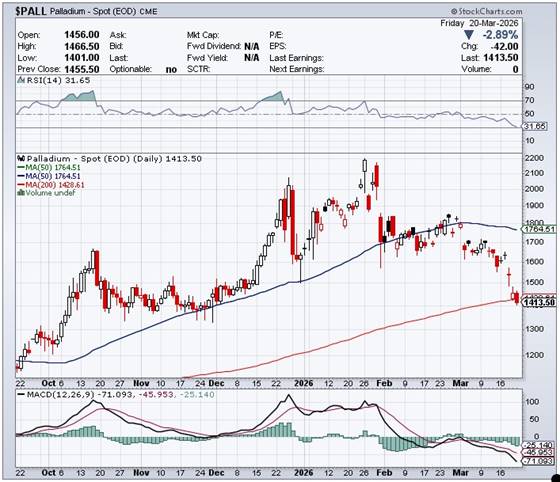
Palladium's price path was managed in about the same manner as silver and gold's...except its low tick was set around 10:25 a.m. in COMEX trading in New York -- and from that juncture had a slightly ascending up/down move until the market closed at 5:00 p.m. EDT. Palladium was closed at $1,392 spot...down 42 bucks on the day -- and 9 dollars off its Kitco-recorded low tick.
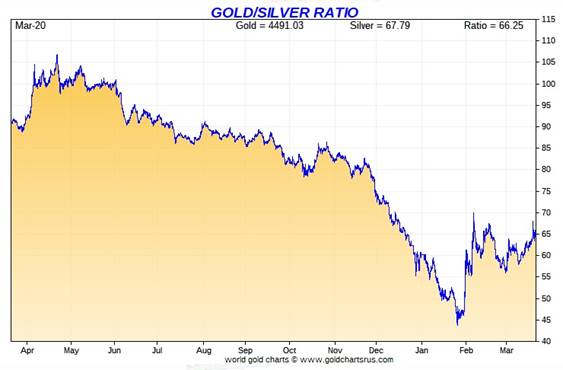
Based on the kitco.com spot closing prices in silver and gold posted above... the gold/silver ratio worked out to 66.4 to 1 on Friday... compared to 64.0 to 1 on Thursday.
Here's the 1-year Gold/Silver Ratio chart from Nick Laird -- and updated with this past week's data. Click to enlarge.
![]()
The dollar index was closed at 99.23 very late on Thursday afternoon in New York -- and then opened higher by 5 basis points once trading commenced at 7:45 p.m. EDT on Thursday evening...which was 7:45 a.m. China Standard Time on their Friday morning. It chopped sideways until 9:15 a.m. CST -- and then headed higher until exactly 2 p.m. CST. It chopped a bit lower and back to about unchanged on the day by around 8:25 a.m. in London. Its two rally attempts from there ran into willing sellers, with its high tick coming at 10:28 a.m. EDT. It then proceeded to chop/wander broadly and quietly lower until the market closed at 5:00 p.m.
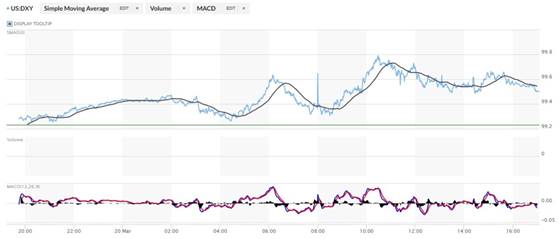
The dollar index was marked to close on Friday afternoon in New York at 99.65...up 42 basis points on the day -- and 15 basis points above it indicated close on the DXY chart below.
Here's the DXY chart for Friday...thanks to marketwatch.com as usual -- and the above-mentioned discrepancy should be noted. Click to enlarge.
![]()
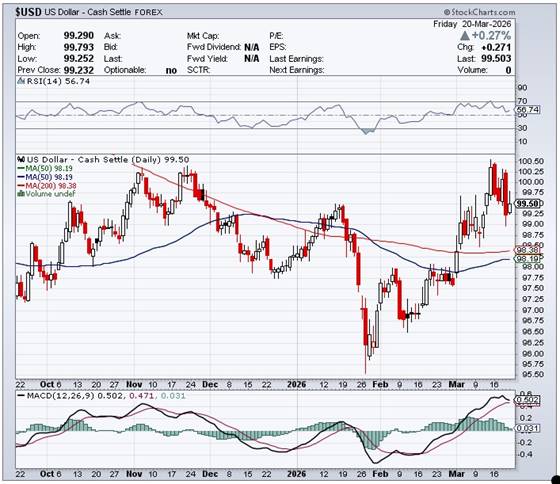
Here's the 6-month U.S. dollar index chart...courtesy of stockcharts.com as usual. The delta between its close...99.50...and the close on DXY chart above, was 15 basis points below that. Click to enlarge.
![]()
The dollar index had a lot of help staying in the green on Friday -- but if left to its own devices, would have certainly crashed and burned.
U.S. 10-year Treasury: 4.3910%...up 0.1100/(+2.57%)...as of the 1:59:54 p.m. CDT close
The ten year yield appeared to get capped around 10:25 a.m. CDT when then the Fed showed up for a bit...but from 11:15 a.m. CDT onwards it crept higher until the market closed. The ten-year yield only closed a hair off its high.
For the week, the ten-year yield closed up a further 10.60 basis points...on top of the 32.30 basis points it was up over the last two weeks. The yield on the ten-year would have been up far more than that if the Fed hadn't worked its magic from time to time.
Here's the 5-year 10-year U.S. Treasury chart from the yahoo.com Internet site -- which puts the current yield into a somewhat longer-term perspective. Click to enlarge.
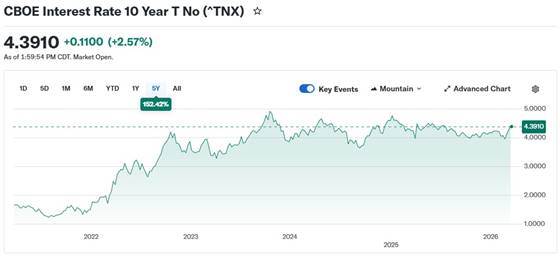
As I keep pointing out in this spot every Saturday, the 10-year hasn't been allowed to trade above its 4.92% high set back on October 15, 2023...but it's now obvious that we've seen the 3.9482% low for this cycle...which was set back on October 22, 2025. The 42.9 basis point increase over the last three weeks is ominous, but the Fed continues to fight it tooth and nail all the way -- which certainly means that its yield would be far higher than it is now without their market management. Rising bond yields are now a global phenomenon.
![]()
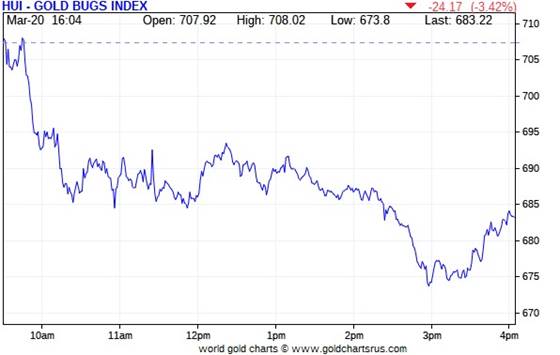
The gold shares opened unchanged and hung in there until the collusive commercial traders pulled the pin on the gold price fifteen minutes later -- and the stock followed...hitting their low ticks a minute or so before 3 p.m. EDT. Some bottom fishing appeared -- and they then rallied a decent amount until the markets closed at 4:00 p.m. The HUI closed down 3.42 percent. It could have been worse.
![]()
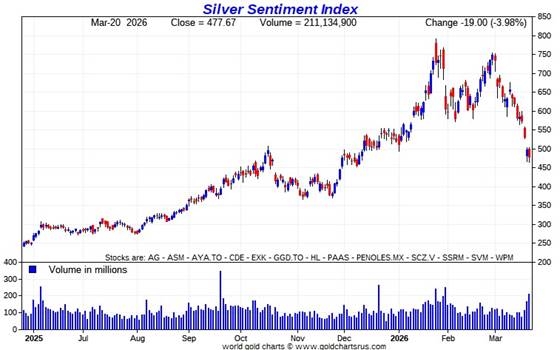
Of course the silver equities got it a bit worse once again, as Nick Laird's Silver Sentiment Index closed lower by a further 3.98 percent. But considering how badly silver got beaten up yesterday, a decline of only that percentage amount feels like a win. Click to enlarge.
![]()
The star yesterday was Peñoles...closing higher by 2.41 percent.
There was this news from Coeur Mining.
And as I've pointed out in this spot for the last three days..."the question needs to be asked as to whether all those precious metal shares sold in a panic yesterday were purchased by white hat/value investors...or 'da boyz' with the black hats looking to sell them into the next rally in order to kill their gains. As you know, it's become obvious that 'da boyz' are managing the precious metal share prices, just as much as the metals themselves."
Silver was closed down by a further 6.88% on Friday...the Silver Sentiment Index by 3.98% -- and Sprott's PSLV closed lower by 6.53%
Gold was closed lower by 3.41%...the HUI closed down 3.42% -- and Sprott's PHYS finished the day down by 3.42% as well.
The Shanghai/U.S. price premium in silver was 12.06 percent yesterday.
The reddit.com/Wallstreetsilver website, now under 'new' and somewhat improved management, is linked here. The link to two other silver forums are here -- and here.
![]()
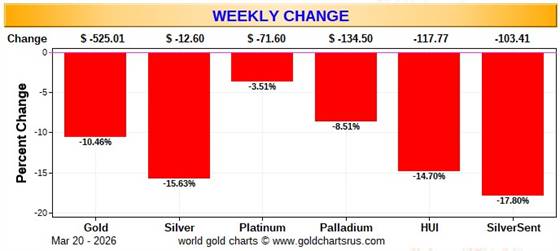
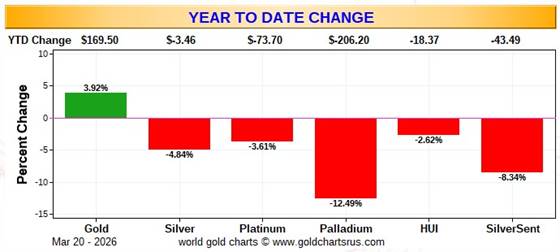
Here are the usual three charts that appear in this spot in every weekend missive. They show the changes in gold, silver, platinum and palladium in both percent and dollar and cents terms, as of their Friday closes in New York — along with the changes in the HUI and the Silver Sentiment Index.
Here's the weekly chart -- and it's no surprise that it's an ugly wall-to-wall red once again. Click to enlarge.
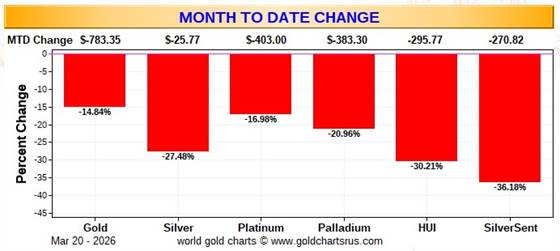
Here's the month-to-date chart -- and it's equally as ugly. Click to enlarge.
Here's the year-to-date chart -- and only gold remains up on the year. At times like this, it's hard to be optimistic, but it's a given that these charts will be as green as grass before the year is out. Click to enlarge.
Despite the fact that silver has now broken the $120 barrier...albeit briefly -- and the silver well in London came close to running dry...the gold/silver ratio remains at a farcical 66.4 to 1 as of the Friday's close. The 'normal' and historical ratio is around 15 to 1...which would put silver at around $300 based on gold's closing price yesterday. And if priced at the ratio of 7:1 that it comes out of the ground at, compared to gold...that would put silver at around $640 an ounce. So a rather impressive triple-digit silver price is in our future...most likely somewhere between those two numbers. As I say in this spot every Saturday...all that remains to be resolved is what that price will be -- and how soon 'da boyz' allow it to happen. Its first attempt to reach one of these values was obviously crushed. But in the face of the continuing structural deficit in silver -- and all the other stuff going on in the world today, they can't keep it up forever.
![]()
The CME Daily Delivery Report for Day 17 of March deliveries showed that 749 gold -- and only 32 silver contracts were posted for delivery within the COMEX-approved depositories on Tuesday.
In gold, the only short/issuer of the four in total that mattered was Morgan Stanley, issuing 710 contracts out of its client account. The two largest long/ stoppers were British bank Barclays and Deutsche Bank...picking up 341 and 24 contracts respectively...the latter for their house account. The next two down the list were JPMorgan and Canada's BMO [Bank of Montreal] Capital, stopping 103 and 45 contracts respectively...the latter for their house account.
In silver, the two biggest short/issuers were JPMorgan and Advantage... issuing 20 and 11 contracts out of their respective client accounts. The two long/stoppers were Canada's BMO [Bank of Montreal] Capital and ADM, picking up 19 and 13 contracts respectively...the former for their house account.
In platinum there were 200 contracts issued and stopped -- and in palladium, it was 1 lone contract.
But in copper, there were an eye-watering 1,685 contracts issued and stopped...42.125 million pounds of the stuff.
The link to yesterday's Issuers and Stoppers Report is here.
So far in March, there have been 12,532 gold, plus 8,713 silver contracts issued and stopped -- and those number in platinum and palladium are 641 and 814 contracts respectively.
On First Day Notice for March deliveries back on February 26...there were 2,604 gold...plus 6,214 silver contracts still open...so you can see that a hefty number of contracts have been added to both so far...gold in particular...4.81x
The CME Preliminary Report for the Friday trading session showed that gold open interest in March dropped by 555 contracts, leaving 859 still around...minus the 749 gold contracts out for delivery on Tuesday as per the above Daily Delivery Report. Thursday's Daily Delivery Report showed that 552 gold contracts were actually posted for delivery on Monday, so that means that 555-552=3 gold contracts vanished from March deliveries.
Silver o.i. in March declined by 130 contracts, leaving 123 still open...minus the 32 contracts out for delivery on Monday as mentioned a bunch of paragraphs ago. Thursday's Daily Delivery Report showed that 132 silver contracts were posted for delivery on Monday, so that means that 132-130=2 more silver contracts were added to the March delivery month.
Total gold open interest in the Preliminary Report on Friday night fell by 5,102 COMEX contracts. Total silver o.i. dropped by 458 contracts.
Considering the bashing they got yesterday, these are tiny changes.
[I checked the final change in total open interest for gold on Thursday -- and it showed a relatively decent decline...from -2,933 COMEX contracts, down to -6,616 contracts. I was hoping for a big downward adjustment once again...but no luck. The final change in total silver o.i. for Thursday was down a tiny amount...from -1,382 contracts, down to -1,464 COMEX contracts.]
Gold open interest inApril in the CME's Final Report on Friday morning fell by a further 15,769 COMEX contracts, leaving 160,469 COMEX contracts still around. April o.i. will continue to decline as we approach First Day Notice for April deliveries in gold on Monday, March 30. Silver o.i. in April dropped by 111 contracts, leaving 1,946 contracts still open.
![]()
There was further withdrawal from GLD, as an authorized participant removed 165,372 troy ounces of gold -- and 35,623 troy ounces of gold were taken out of GLDM as well. However, an a.p. added 1,992,294 troy ounces of silver to SLV -- and considering the price action lately, one has to suspect that this amount was added to cover an existing short position. It's too bad that it won't show up in next Tuesday's short report.
The SLV borrow rate started the Friday session at 0.44% -- and ended at 0.83%...with 8.9 million shares available. The GLD borrow rate began the day at 0.32% -- and finished it at 0.33%...with 5.8 million shares available.
In other gold and silver ETFs and mutual funds on Earth on Friday ...net of any changes in COMEX, GLD, GLDM and SLV activity, there a net 121,581 troy ounces of gold taken out -- and a gross 885,481 troy ounces of silver were removed as well, because their were no additions.
![]()
For only the second time this month, there was no in/out activity in gold over at the COMEX-approved depositories on the U.S. east coast on Thursday. But there was some paper activity, as 144,583.047 troy ounces/ 4,497 kilobars were transferred from the Registered category and back into Eligible over at Brink's, Inc...done so most likely to save on storage fees.
There were 20,404 troy ounces transferred from the Eligible category and into Registered over at JPMorgan -- and that's most likely getting teed up to go out for delivery real soon.
The link to what little COMEX gold activity there was on Thursday, is here.
But there was no let-up in silver. There were 40,890 troy ounces reported received over at CNT -- and 2,030,354 troy ounces were shipped out.
The only two 'out' amounts that mattered were the 1,413,221 troy ounces that departed Manfra, Tordella & Brookes Inc. -- and the 616,162 troy ounces that left Brink's, Inc.
There was some paper activity, as 212,172 troy ounces were transferred from the Registered category and back into Eligible involving five different depositories. The largest amount were the 102,298 troy ounces that made that trip over at Asahi.
The link to all of Thursday's COMEX silver activity is here.
Since the 20th of the month fell on a weekday, the good folks over at The Central Bank of the Russian Federation updated their website with February's data -- and it showed that during that month they sold 200,000 troy ounces of gold from their reserves...leaving it at 74.3 million troy ounces/ 2,317 metric tonnes.
The Shanghai Futures Exchange updated their silver inventories as of the close of business on their Friday -- and it showed that a net 76,197 troy ounces/ 2.370 metric tonnes of silver were withdrawn... leaving their silver inventories at 11.655 million troy ounces/362.495 metric tonnes.
![]()
Here are the usual 20-year charts that show up in this space in every weekend column. They show the total amounts of physical gold and silver held in all known depositories, ETFs and mutual funds as of the close of business on Friday. Click to enlarge.
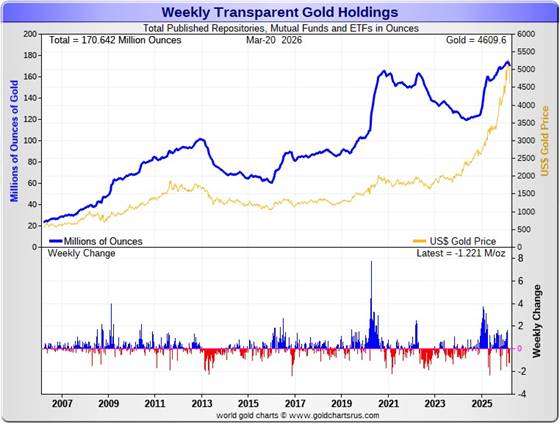
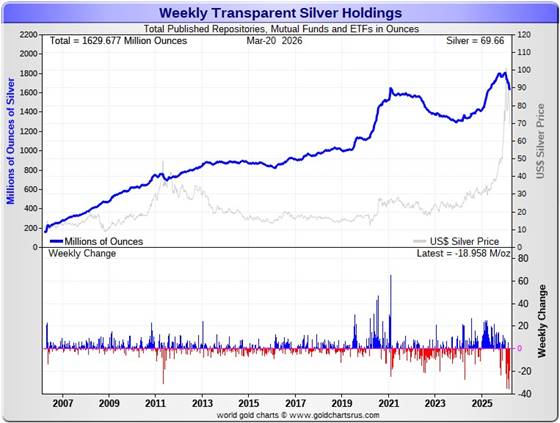
During the business week just past, there were a net 1.221 million troy ounces of gold removed -- and a net and further 18.958 million troy ounces of silver were taken out as well.
According to Nick Laird's data on his website, a net 3.066 million troy ounces of gold were removed from all the world's known depositories, mutual funds and ETFs during the last four weeks. The largest 'in' amounts aren't worth mentioning once again. The largest 'out' amount by far were the 1.720 million troy ounces that left the COMEX -- and the 1.004 million troy ounces that departed iShares IAU. Next were the 706,800 troy ounces that left iShares IAU.
The amount of gold in all the world's ETFs and mutual funds remains barely above its old all-time high of late 2020...see the above chart. But it should be far higher, more than double its current amount, considering gold's current price...far more than double it was back then. Why it isn't, is beyond me.
A net 76.248 million troy ounces of silver were taken out during that same 4-week time period. The largest 'out' amount were the 31.308 million oz. out of the COMEX...followed by the 18.695 million oz. out of SLV -- and the 16.536 million oz. out of the Indian ETFs. The 'out' list goes on and on...
And like in gold, there are no 'in' amounts worth mentioning.
It's been a wild past four or five months in the physical silver space -- and the only explanations for these massive withdrawals over that time period was because of redemptions...or the physical metal was needed elsewhere.
It should be noted that the amount of silver held in all these depositories, ETFs and mutual funds is now back below its old all-time high inventory level of January 2021. But it should be far higher than it is as well, because silver is 2.5x the price it was back then.
Back at its previous inventory peak in late January 2021, silver was around $27 an ounce. Now its about 40 bucks higher. Why the precious metal ETFs aren't doing better is a mystery for which I have no answer, except for what I mentioned two paragraphs ago.
Retail demand remains quiet for the moment. But it also remains obvious that a lot of the more popular silver products remain out of stock at almost all on-line retail bullion stores that I keep track of...with deliveries still stretched out. I've been told that the mints, both sovereign and private, are still going flat out. The delivery time on silver maple leafs from the Royal Canadian Mint is 4 weeks at the moment -- and the buy/sell spreads at some bullion stores are north of 12 percent. In the case of anything less than 0.999+% pure, it's far more than that.
COMEX silver withdrawals have been monstrous since the start of the year... 102 million in January and February combined...plus 26.716 million oz. so far in March. These amount don't include the 43.57 million oz. issued and stopped on the COMEX in the March delivery month so far.
The "rapacious" silver demand will continue until available supplies are depleted -- and we're also well into the sixth year of a structural deficit in silver according to the ongoing reports from The Silver Institute.
The vast majority of precious metals being held in these depositories are by those who won't be selling until the silver price is many multiples of what it is today...if ever.
Sprott's PSLV is the third largest depository of silver on Planet Earth with 216.9 million troy ounces...unchanged for the last six weeks -- and a great distance behind the COMEX, which has now been demoted to the second largest silver depository, where there are 332.7 million troy ounces being held...down a further 9.0 million troy ounces this past week...but minus the 103 million troy ounces being held in trust for SLV by JPMorgan.
That 103 million ounce amount brings JPMorgan's actual silver warehouse stocks down to around the 44.5 million troy ounce mark...quite a bit different than the 147.5 million they indicate they have -- and down a further 4.5 million troy ounces on the week. They've parted with a lot of silver in the last six or so months...around 64 million oz.
But that number doesn't include the silver that JPMorgan owns and has stored at the other COMEX-approved depositories. They've shipped out lots of that over the months and years...especially this year so far.
PSLV remains a very long way behind SLV as well -- still the largest silver depository...with 490.3 million troy ounces as of Friday's close...down a net and further 6.8 million troy ounces from last week.
On a net basis over the last three or so month -- and despite the big spike in the silver price at the end of January, just about every depository or ETF has been hemorrhaging silver.
The latest short report [for positions held at the close of business on Friday, February 27] showed that the short position in SLV fell by a further 18.22%... from the 45.79 million shares sold short in the prior report...down to 37.45 million shares in the latest short report that came out about ten days ago. This amount represents 6.79 percent of total SLV shares outstanding...still a bit obscene, but not nearly as bad as it was a month or so ago. Don't forget that there's no physical silver backing any of it as the SLV prospectus requires.
BlackRock issued a warning almost ten years ago now to all those short SLV, that there might come a time when there wouldn't be enough metal for them to cover. That would only be true if JPMorgan decides not to supply it to whatever entity requires it. Those that remain short SLV shares are in equally dire straits as those short silver in the COMEX futures market -- and I suspect that they're the same entities.
They were obviously able to cover boatloads of those short positions in these latest engineered price declines...as that's the other reason why 'da boyz' have gone after silver as aggressively as they did.
The next short report...for positions held at the close of trading on Friday, March 13...will be posted on The Wall Street Journal's website on Tuesday afternoon, March 24 -- and I'm more than anxious to see what's in it regarding SLV.
Then there's that other little matter of the monster short position in silver and gold held by Bank of America in the OTC market...with JPMorgan & Friends on the long side. Ted said it hadn't gone away. He wrote an article about this back in April 2021 headlined "A New Piece of the Puzzle" -- and linked here.
In the article, the OCC Report stated that BofA had $8.3 billion in precious metal derivatives at the end of Q4/2020 -- and as you'll see in the paragraphs that follow, the BofA's derivatives position is now up to $47.9 billion as of the end of Q3/2025...an almost six-fold increase -- and all because of the increases in the price.
A while after that article came out, he also come to the conclusion that they're short around 25 million ounces of gold with these same parties as well. Once these short covering rallies in both silver and gold really explode higher...we'll see if they need to get taken over, like Bear Stearns did back in 2008 -- and for the same reason.
The latest OCC Report for Q3/2025 was posted on their website almost three months ago now -- and it showed that the precious metal derivatives held by the four largest U.S. banks increased by $137.54 billion/24.4% from Q2/2025 ...up to $704.05 billion...which is a very hefty amount.
JPMorgan's precious metals derivatives rose from $358.5 billion, up to $437.4 billion from Q2/2025 -- and Citigroup's also rose...from $150.7 billion, up to $204.3 billion. BofA's increased by a tiny bit...from $44.7 billion, up to $47.9 billion -- and the derivatives position held by Goldman Sachs is a piddling and immaterial $614 million -- up from the equally piddling $219 million it held in Q2/2025.
But with JPMorgan holding 62.1% of all the precious metals derivatives... Citibank holding 29.0% -- and Bank of America about 7% of the total of the four reporting banks, it's only JPMorgan and Citigroup that matter.
But the caveat to the above would be the precious metals derivatives position held by Wells Fargo and Morgan Stanley. The reason that their data is not included, is because they are not one of the USA's four largest banks by total derivatives held. But you can bet your entire net worth that they hold also hold a derivatives position in the precious metals that would choke a horse...Wells Fargo in particular.
This would indicate that these six U.S. banks held a derivatives position in the precious metals something north of $1 Trillion dollars at the end of Q3/2025.
But as I keep pointing out in this spot every weekend -- and mentioned just above...the OCC indicator is flawed for two very important reasons, as way back 10-15 years ago, this report used to include the top dozen or so U.S. banks -- and included the likes of Wells Fargo and Morgan Stanley, amongst others...that hold derivatives positions, both long and short, in the precious metals. Now the list is down to just four banks...so a lot of data is hidden... which is certainly the reason why the list was shortened. On top of that, the list doesn't include the non-U.S. banks that are short and long the precious metals: British, French, German, Canadian -- and Australian.
Including all theirs, the derivatives/paper held in the precious metals...mostly on the short side...is an eye-watering multi-trillion dollar number...which can never be covered, either in the paper market, or through the delivery of physical metal...without driving the prices of all four precious metals beyond the moon in the process.
The next OCC Report for Q4/2025 is due out this coming week.
![]()
The Commitment of Traders Report, for positions held at the close of COMEX trading on Tuesday, showed the expected declines in the commercial net short positions in both silver and gold.
In silver, the Commercial net short position fell by 3,219 COMEX contracts... 16.095 million troy ounces of the stuff.
They arrived at that number through the purchase of 149 long contracts, plus they also bought back/covered 3,070 short contracts -- and it's the sum of those two numbers that represents their change for the reporting week.
Under the hood in the Disaggregated COT Report, all three categories of traders got the 'sell' memo...as the Managed Money traders reduced their net long position by 642 COMEX contracts...the Other Reportables by 2,055 contracts -- and the Nonreportable/small traders by 522 contracts. I'll have more about this below the chart.
Doing the math: 642 plus 2,055 plus 522 equals 3,219 COMEX contracts... the change in the Commercial net short position...which it must do.
The Commercial net short position in silver now stands at 38,358 COMEX contracts...191.790 million troy ounces...down those 3,219 contracts mentioned above.
The Big 4 collusive commercial traders decreased their net short position by 877 COMEX contracts, down to 30,296 COMEX contracts...their lowest short position on record by a country mile. It's a given that it's even lower than that since the Tuesday cut-off. However, most likely not by a lot.
The Big '5 through 8' also decreased their net short position...them by 783 COMEX contracts...down to 14,804 COMEX contracts...their lowest short position since 24 February.
The Big 8 commercial traders in total are net short 45,100 COMEX silver contracts...down 1,660 contracts on the week...their smallest short position on record. Of course it's shrunk even more since Tuesday.
Ted raptors, the 33 small commercial traders other than the Big 8, were buyers as well this past reporting week, as they increased their net long position by a further 1,559 COMEX contracts -- and are now net long silver by 6,742 contracts.
The purchase of those 1,559 contracts by the small commercial traders had the mathematical effect of decreasing the Commercial net short position... which isn't a decrease at all. All that matters is what the Big 8 did.
Here's the 9-year COT chart for silver thanks to Nick Laird -- and updated with the above data. Click to enlarge.
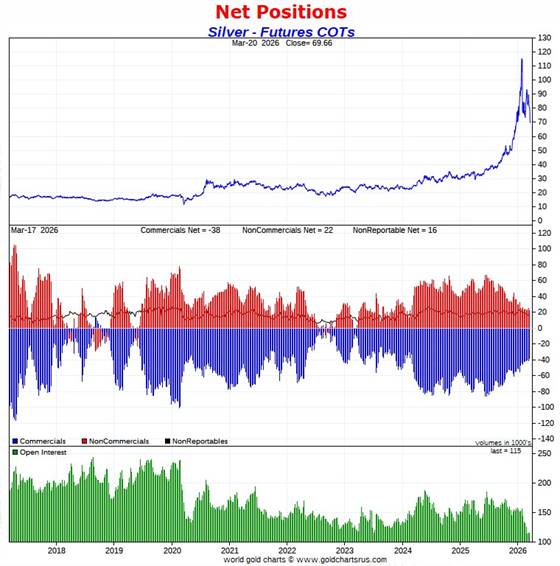
The Big 8 collusive commercial traders are net short 39.3 percent of total open interest in silver in the COMEX futures market...down a bit from the 40.5 percent they were short in last week's report...which is still obscene.
Despite the fact that 'da boyz' peeled over six bucks off the silver price during the reporting week -- and closed it below its 50-day moving average on all five reporting days, the best the Big 8 shorts could do was reduce their collective net short position by 1,660 COMEX contracts.
As I mentioned several times during this past week, the law of diminishing returns sets in at some point, because there comes a time when the Managed Money traders et al. just aren't prepared to sell any more of their long positions, or go further short -- and that's what happened this week. It should be the same in next week's COT Report as well.
The other thing that was noteworthy in this report in that regard was the the Managed Money traders remain net long silver by 9,647 COMEX contracts. At this point in the price cycle in years past -- and this far below silver's 50-day moving average, they would be market neutral or short silver by a bit...but not this time. They're not budging from their current net long position by much.
Of course 'da boyz' have hit silver hard since the cut-off at the COMEX close on Tuesday, so there's obviously been more long selling/shorting by the Managed Money traders et al...but how much?
And despite the pounding laid on silver, total open interest only declined by a piddling 1,466 COMEX contracts during the reporting week -- and sits at a 14-year low.
For all intents and purposes, silver is totally washed out to the downside from a COMEX futures market perspective -- and has been for several weeks now. 'Da boyz' are now down to picking up nickels in front of a steamroller.
However, baring a black swan event, the Big 8 are in total control of the silver price -- and its next rally will only commence when they allow it.
And yes, the set-up for a rally of Biblical proportions remains incandescently white-hot bullish. I've run out of any other adjectives.
![]()
In gold, the commercial net short position fell...but only by 4,328 COMEX contracts...432,800 troy ounces of the stuff.
They arrived at that number through the purchase of 904 long contracts -- and also bought back/covered 3,424 short contracts. It's the sum of those two numbers that represents their change for the reporting week.
Under the hood in the Disaggregated COT Report, the Managed Money traders were surprise buyers, as they increased their net long position by 3,644 COMEX contracts...which meant the other two categories of traders had to have been net sellers -- and they were. The traders in the Other Reportables category reduced their net long position by 6,907 contracts -- and the Nonreportable/small traders by 1,065 COMEX contracts.
Doing the math: 6,907 plus 1,065 minus 3,644 equals 4,328 COMEX contracts...the change in the commercial net short position.
The commercial net short position in gold now stands at 198,648 COMEX contracts/19.865 million troy ounces...down those 4,328 contracts covered this past week.
The Big 4 commercial traders decreased their net short position 4,952 COMEX contracts, down to 129,998 contracts...which is the lowest short position they've held since August 29 of last year.
The Big '5 through 8' commercial traders also decreased their net short position...them by 4,433 contracts, down to 46,898 COMEX contracts held net short...their lowest short position that I have records for -- and by a country mile.
The big surprise was that Ted's raptors, the 41 small commercial traders other than the Big 8, as they increased their net short position, them by 5,056 contracts. Their current net short position is back up to 21,752 COMEX contracts...the highest its been since January 27. That's still very hefty...but miles below the 76,723 contracts they were short back on 14 February 2025.
And like in silver in the past, they would normally be net long gold by tens of thousands of contracts at this point in the price cycle. I also suspect that no more than two or three of these small commercial traders hold the vast majority of this short position.
Here's Nick's 9-year COT chart for gold -- and updated with the above data. Click to enlarge.
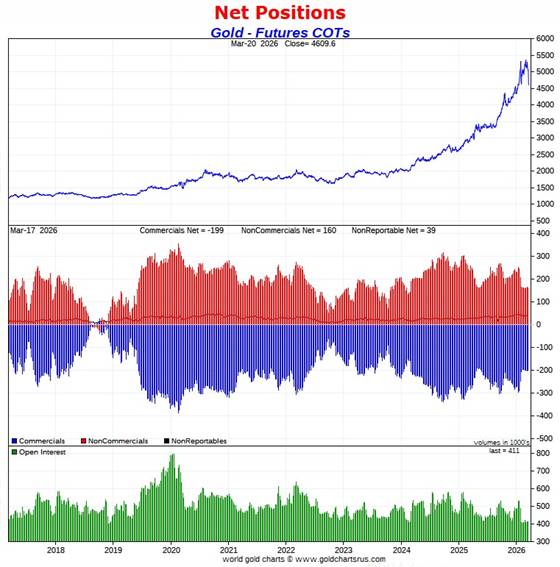
The commercial traders as a group...which includes both the Big 8 -- and Ted's raptors...are net short 48.3 percent of the total open interest in gold in the COMEX futures market...down a tad from the 49.0 percent they were short last week...which remains a perversion.
This week's COT Report in gold is very much yesterday's news, as the collusive commercial traders blew gold down through its 50-day moving average on much heavier than normal volumes starting after the Tuesday cut-off for next Friday's Report.
Factoring in the price carnage in gold since Tuesday, leaves no doubt in my mind that from a COMEX futures market perspective, it has gone from a 'very bullish' set up, to a 'wildly bullish' set-up.
The unhappy part about this process is that we as investors have to endure a lot of price pain in order to arrive at the wildly bullish set up that we have in both these precious metals.
As I've been saying in this spot every Saturday for a few weeks now -- and applies even more this week, is that we appear to be on the launchpad for something. It now remains to be seen if these same collusive commercial traders are about to put their collective heads back in the lion's mouth by going back on the short side in a major way when they allow the next set of rallies to begin. I have more on this in The Wrap.
![]()
In the other metals, the Managed Money traders in palladium decreased their net long position by a further 289 COMEX contracts -- and are now back net short palladium by a piddling 98 contracts.
The commercial traders in the Swap Dealers category are net long palladium by 1,317 contracts...down 322 contracts on the week. The traders in the Producer/ Merchant category are net short 2,700 COMEX contracts...a decrease of 346 contracts from last week. The traders in the Other Reportables category are net short 87 contracts -- and the Nonreportable/ small trader categories are net long palladium by 1,568 contracts.
As you can tell from these numbers, palladium is a very dinky market. Total open interest is down to 15,556 COMEX contracts...the lowest it's been since mid-2023. Open interest in platinum is also the lowest since that time as well.
The world's banks are net short 10.0 percent of total open interest in palladium in the COMEX futures market as of the March Bank Participation Report that came out two Friday's ago...which is a slight decrease from the 10.3 percent that they were net short in February's Bank Participation Report.
This is a very strange and twisted market once you get a look into its internal structure...with platinum not that far behind.
In platinum -- and despite its punk price action during the reporting week... the Managed Money traders increased their net long position by a further 3,115 COMEX contracts -- and are now net long platinum by 10,838 contracts ...despite the fact that it's a very long way below its 50-day moving average. The traders in the Other Reportables and Nonreportable/ small trader category remain net long platinum by very respectable amounts as well.
The commercial traders in the Producer/Merchant category in platinum are net short 13,215 COMEX contracts, a decline of 919 contracts from what they were net short last week. The Swap Dealers in the commercial category increased their net short position, them by 2,920 COMEX contracts this past week -- and are now net short platinum by 9,702 COMEX contracts.
It's mostly the world's banks that are 'The Big Shorts' in platinum in the COMEX futures market, as per March's Bank Participation Report that came out two weeks ago Friday. They didn't do much in the March Bank Participation Report -- and haven't done much of anything in platinum in the last three months.
In copper, the Managed Money traders decreased their net long position by a further and smallish 1,118 COMEX contracts during the past reporting week -- but remain net long copper by 46,558 contracts...1.164 billion pounds of the stuff -- and that's despite the fact that it's price is within a whisker of being oversold on its RSI trace. These longs aren't going anywhere, no matter how low the price goes.
Copper, like palladium, continues to be a wildly bifurcated market in the commercial category. The Producer/Merchant category is net short a grotesque 85,233 copper contracts/ 2.131 billion pounds -- while the Swap Dealers are net long 25,799 COMEX contracts/645 million pounds of the stuff.
Whether this dichotomy in copper means anything or not, will only be known in the fullness of time. Ted Butler said it didn't mean anything as far as he was concerned, as they're all commercial traders in the commercial category. But this bifurcation has been in place for as many years as I've been keeping records -- and that's a very long time.
In this vital industrial commodity, the world's banks...both U.S. and foreign... are net short copper by 1.5% of total open interest in the March Bank Participation Report. Back in the October BPR, these same banks were net long 0.90% of the total open interest in copper in the COMEX futures market. So basically they're market neutral...but only numerically, as that dichotomy between the two groups of commercial traders is still there.
At the moment it's all the commodity trading houses such as Glencore and Trafigura et al., along with some hedge funds, that are mega net short copper in the Producer/Merchant category, as the Swap Dealers are net long, as pointed out above.
The next Bank Participation Report is due out on Friday, April 10.
![]()
Here’s Nick Laird’s “Days to Cover” chart, updated with the COT data for positions held at the close of COMEX trading on Tuesday, March 17. It shows the days of world production that it would take to cover the short positions of the Big 4 — and Big '5 through 8' traders in every physically traded commodity on the COMEX. This chart is a graphical representation of what's shown in the COT Report above. Click to enlarge.
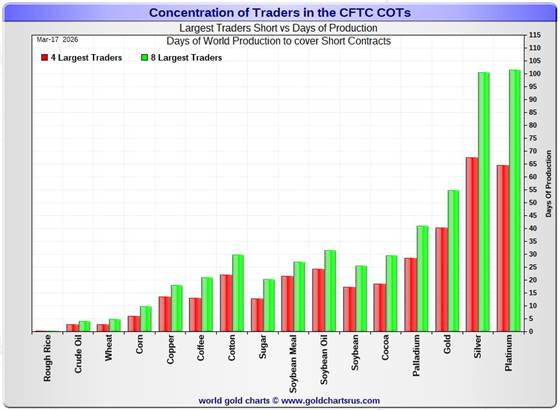
In this week's data, the Big 4 traders are short 67 days of world silver production...down about 2 days from the prior COT report. The ‘5 through 8’ large traders are short an additional 33 days of world silver production...also down about two days from last week's report...for a total of 100 days that the Big 8 are short -- and down about 4 days from that last COT Report -- and the smallest number of days short that the Big 8 have ever been.
Those 100 days that the Big 8 traders are currently short, represents 3.3 months of world silver production, or 225.500 million troy ounces/45,100 COMEX contracts -- and that's very little. That's down from the 233.800 million troy ounces/ 46,760 contracts in last Friday's COT Report.
In gold, the Big 4 are short about 40 days of world gold production...down about 2 days from the prior report -- and the Big '5 through 8' are short an additional 15 days of world production...down 1 day from last week, for a total of 55 days of world gold production held short by the Big 8 commercial traders -- and obviously down 3 days from last Friday's COT Report. This is a very low number for them as well -- and is significantly lower now since the Tuesday cut-off for next Friday's report.
The standout on the chart still remains -- and that's that silver has been bumped out of its No. 1 spot on the above Days-to-Cover chart -- and platinum has taken its place...but only by 1 day. This turn of events has come about because of the aggressive short covering by the Big 8 commercial traders in silver over the last nine or so months.
The other standout of these Days-to-Cover charts, this one included, is the fact that the vast majority of the short positions in the four precious metals, plus other commodities, is held by the four largest traders...the red bars -- and this is particularly the case in gold. Whereas the short positions held by the '5 through 8' large traders....the green bars, minus the red bars...is very small.
In silver, I suspect that a goodly chunk of the short position in the Big 4 traders category is mostly held by only two traders...both of them U.S. banks.
The other thing worth noting in the above charts is that the short positions held by the Big 4 and Big '5 though 8' traders in platinum now mirrors the days of world production that silver is short. This is a graphical representation of why I consider platinum be 'da boyz' No. 2 problem child after silver.
The short position in SLV now sits at 37.45 million shares/troy ounces as of the last short report that came out ten days ago, for positions held at the close of trading on Friday, February 27 -- down 8.34 million shares/ troy ounces sold short from the prior report...a further decrease of 18.22%. This number, which represents 6.79% of total SLV shares outstanding, is not off-the-charts grotesque and obscene as it used to be -- but realistically should be considerably less than half that amount.
Don't forget that there's not a single solitary troy ounces of silver backing any of these shorted shares as the SLV prospectus requires.
The next short report...for positions held at the close of business on Friday, March 13...is due out on next Tuesday, March 24.
In the overall in yesterday's COT Report, the short positions of the Big 8 commercial traders in silver declined by a noticeable amount -- and the set-up in it remains beyond wildly bullish. And since the Tuesday cut-off, the set-up in gold has to be considered extremely bullish as well...but not quite to the same degree as silver.
As Ted Butler had been pointing out ad nauseam, the resolution of the Big 4/8 short positions will be the sole determinant of precious metal prices going forward...although that short position in gold held by his raptors continues to be a negative factor as well -- and has increased a noticeable amount during the last two reporting weeks.
And as he also pointed out over the years, there would come a time when what the numbers show in the COT Report won't matter, as events in the real world...whatever they may be...will overtake them. For the moment, it still does matter a lot, however not for much longer I suspect. Make no mistake about it, the commercial traders of whatever stripe have been moving heaven and earth to reduce their short exposure as much as possible...especially in silver, but in gold this week as well. All that we await now, is its resolution. The big bear raids we've endured over the last month or so...including the ones this week...are all part and parcel of that process. I have more about this in The Wrap.
It's mostly all videos for you today -- and they're worth your time.
![]()
CRITICAL READS & VIDEOS
Bubbles, Dams, War and Cracks -- Doug Noland
Global markets are at the precipice. Nerves are increasingly frayed, yet complacency remains well entrenched. This is not uncharted territory. De-risking/ deleveraging approaches critical momentum, before some policy response swiftly turns things around. The “Fed put,” the “TACO put,” the global policymaker “put”…
When speculative deleveraging momentum gathered pace in the summer of 2019, the Federal Reserve restarted QE. When autumn 2022 UK gilt deleveraging sparked global bond deleveraging, the Bank of England postponed QT and intervened with aggressive gilt purchases (QE) and a temporary liquidity facility.
As the March 2023 SVB/bank crisis spurred fear and deleveraging, the Federal Reserve and Federal Home Loan Banks responded urgently with $500 billion of liquidity injections. During the August 2024 yen “carry trade” unwind (Nikkei plunged 12.4% on August 5th), the forces of de-risking/deleveraging were abruptly reversed by BOJ Governor Shinichi Uchida’s reassuring comments (BOJ won’t raise rates when markets are unstable).
And when markets were at the cusp of unraveling during “liberation day” April 2025 instability, the “TACO put” (tariff pause) unleashed a major short squeeze, unwind of hedges, liquidity surge, and blow-off excess for the ages (i.e., AI arms race, “private Credit” lending finale, crypto blow-off, and caution thrown to the wind across global asset markets).
Risks to global markets, finance, and economies are the most extreme in decades. With inflation risk pummeling global bond markets, now typical central bank QE responses would come with atypical issues and challenges. At the minimum, I would expect central bank liquidity responses to be more cautious – slower and smaller in scope than markets will demand. As for the “TACO put,” it faces the Laws of Diminishing Efficacy. The President does not control war developments.
Doug's weekly commentary is always worth reading -- and this one showed up on his website around midnight PDT last night. Another link to it is here.
![]()
War Means Much Higher Inflation and $15,000 Gold -- Lawrence Lepard
Tom Bodrovics welcomes Lawrence Lepard, Founder and Managing Partner of Equity Management Associates to the show. The discussion centers on the increasingly complex economic and geopolitical landscape, the impact of the recent war and its potential consequences. Lepard highlighted several key indicators to monitor, including the U.S. 10-year yield, gold, Bitcoin, and the price of oil, which he believes are crucial for understanding market dynamics. Lepard expressed surprise that financial markets have held up relatively well despite significant risks, suggesting potential market manipulation by the federal government to maintain stability. He predicts the war could lead to a recession and a rollover in the stock market, although he believes the market might be artificially supported.
Larry also discusses the potential for increased inflation due to higher energy costs and supply chain disruptions, particularly from the Strait of Hormuz, which could impact various commodities and goods. Lepard emphasized the importance of holding assets like gold, silver, and Bitcoin, which he views as safe havens in an environment of potential currency debasement. He argues that the current monetary system is unsustainable and that a return to a sound money standard is necessary to prevent further economic and social issues. Lepard also touches on the private credit bubble, comparing it to the housing crisis of 2008, and warned that the unwinding of this bubble could have significant repercussions for the financial system.
Well, dear reader, Larry is one of the small handful of financial commentators that I have all that time in the world for. This longish 55-minute video interview is definitely worth your while -- and I thank Guido Tricot for finding it for us. Another link to it is here.
![]()
Three important and worthwhile video interviews
1. Ambassador Chas Freeman: Ground Troops in Iran? This Could Collapse Netanyahu’s Strategy
This longish but very worthwhile interview with former U.S. Ambassador Freeman, which runs for 59 minutes, was hosted by Nima Alkhorshid on Friday -- and I always have all the time in the world for what this man has to say. It's definitely worth watching if you have the interest -- and I thank Guido Tricot for sharing it with us. The link to it is here.
2. Iran War Transforms Ukraine War -- Alexander Mercouris
After my column is done at midnight PDT, the first thing I watch is Alexander's 90-minute commentary on theduran.com. Here he is being interviewed by Professor Glenn Diesen. It was posted on the youtube.com Internet site on Friday afternoon -- and I thank Guido for this one as well...plus the one that follows. the link to it is here.
3. INTEL Roundtable w/ Larry Johnson & Ray McGovern: Week of 20 March
This 29-minute video with former CIA analysts McGovern and Johnson was hosted Judge Andrew Napolitano very late on Friday afternoon EDT -- and it's very much worth your while if you have the interest. The link to it is here.
![]()
Danny Day of CapitalCosm interviews your humble scribe
This 24-minute video interview starts off talking about the oil market, which I only know a little about. But once that was over, the rest of the discussion is about the precious metals...silver in particular. The link to it is here.
![]()
India gold discounts ease on festive demand; China premiums ease
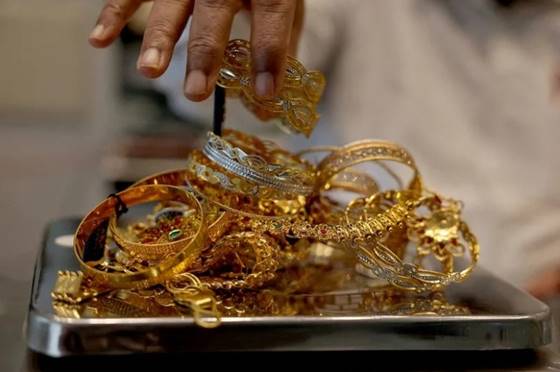
Gold discounts in India eased this week from near decade-high levels hit last week, helped by festive buying and a sharp correction in prices, while premiums in China declined as physical demand softened.
Bullion dealers in India this week offered discounts of of up to $75 per ounce over official domestic gold prices – inclusive of 6% import and 3% sales levies, down from discounts of up to $83 last week, the highest since July 2016.
"Retail buying picked up due to Gudi Padwa and Ugadi festivals, but it was still much lower than usual," said a Mumbai-based jeweller.
The festivals were celebrated earlier this week, mainly in India's western and southern parts, when buying gold is considered auspicious.
Global benchmark spot gold prices have fallen more than 10% since the U.S.-Israeli war on Iran started on February 28, pressured by a stronger dollar, which has emerged as one of the clearest safe-haven winners.
However, demand from Indian jewellers remained muted despite the sharp price correction as they were busy closing their books for the financial year, said a Mumbai-based dealer with a private bank.
This gold-related Reuters story from Thursday was picked up by Yahoo!finance -- and I found it on Sharps Pixley. Another link to it is here.
![]()
On Money Metals Exchange podcast, GATA secretary explains U.S. rigging of gold market
GATA secretary/treasurer Chris Powell is the guest on this week's market wrap-up podcast with Mike Maharrey of Money Metals Exchange, discussing why the U.S. government long has manipulated the monetary metals markets and how it has been done. We also discuss the major gold and silver exchange-traded funds and how they can be used for market manipulation by their "authorized participants" -- the large investment and bullion banks that are agents of central banks and help camouflage government interventions in the gold market.
The interview is a half-hour long and begins at the 8:55 mark -- and is linked again here.
QUOTE of the DAY


![]()
The WRAP
"Understand this. Things are now in motion that cannot be undone." -- Gandalf the White
![]()
It's hard to believe that today's pop 'blast from the past' is already 43 years young, but it is. Where IS the time going??? It was released as the second single from his sixth and most successful studio album. Neither the song, nor the artist needs any introduction -- and the link is here. Of course there's a killer bass cover to this -- and that's linked here.
Today's classical 'blast from the past' was preordained by the date. Welcome to spring in the northern Hemisphere! Here's Antonio Vivaldi's violin concerto No. 1 in E-major, Op. 8...featuring the San Francisco-based Voices of Music...with soloist Alana Youssefian. This is as good as it gets -- and the link is here.
![]()
Despite what was going on in the world financially, economically and militarily ...'da boyz' continued their mission again on Friday...which may or not have been aided and abetted by that phony baloney dollar index 'rally'.
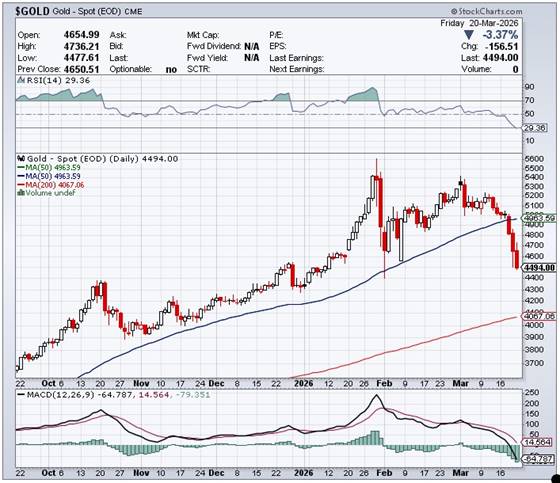
I'd certainly pay a pretty penny to get a peek at a Commitment of Traders Report in both gold and silver as of the 5:00 p.m. close on Friday...because, without a doubt, the set-up for a blockbuster rally in gold is now in place as well. It's also into oversold territory by a bit on its RSI trace. Can 'da boyz' get it ever more oversold than that...sure, but it would take lower prices to accomplish that.
Despite the fact that 'da boyz' have closed silver lower for eight straight trading sessions -- and it's been below its 50-day moving average all that time...silver remains a bit above the oversold mark on its RSI trace. For silver, this a rather meaningless metric, as it's far overshadowed by it's incandescent white-hot bullish set-up in the COMEX futures market.
The other thing about silver that I noticed was that they were unable to close it...or their No. 2 problem child, platinum...below their intraday low ticks they set in both of them on Thursday. They had no problem doing that in either gold or palladium.
How long the Big 8 commercial shorts can keep up this price pressure in silver and gold is unknown. But as long as the Managed Money traders et al. are prepared to sell longs and go short, I suspect that 'da boyz' will keep it up. However, as I've pointed out on a number of occasions earlier in the week -- and in my silver COT commentary further up, the law of diminishing returns is coming up hard.
Platinum and palladium were also handed losses again yesterday -- and the latter was closed below its 200-day moving average for the first time since very late May of last year. It's also in oversold territory on its RSI trace.
But one thing is for sure, we're far, far closer to the end of this current 'wash, rinse & spin' cycle than we are to its beginning.
On top of that, gold open interest continues to slide -- and is down to 405,419 COMEX contracts...the lowest it's been since April/May of 2015. Ditto for silver, as its open interest is down to 112,034 contracts...the lowest since April/May of 2012. These are more signs that these two markets are cleaned out to the downside.
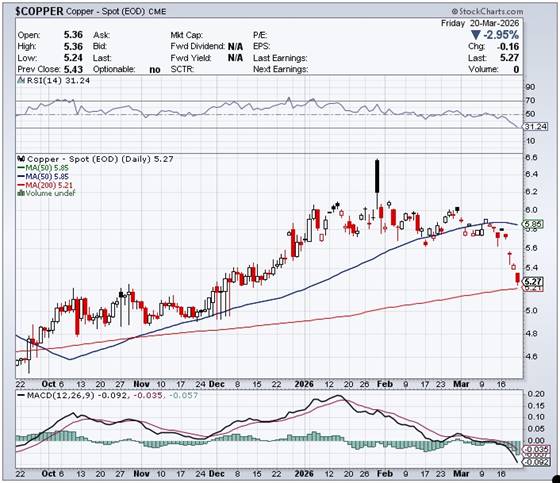
Copper got hit by a further 16 cents/2.95% -- and was closed at $5.27/pound. It came within 3 cents of its 200-day moving average at its intraday low tick on Friday -- and is within a whisker of being oversold on its RSI trace. I pity the traders in the Producer/Merchant category in the Disaggregated COT Report who are mega net short copper, with no way out. They are the only category in that report that are net short copper....against everyone else, who are net long.
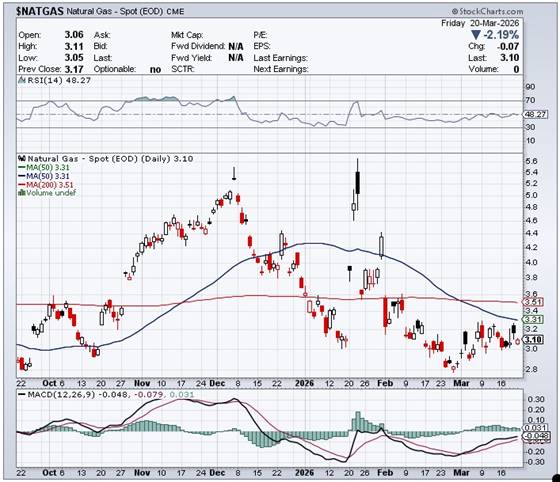
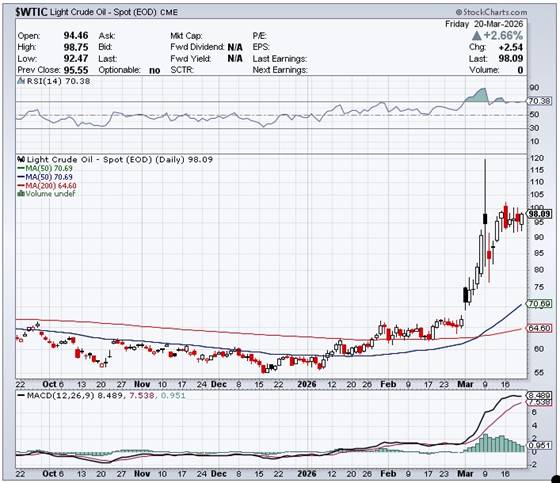
I was surprised that natural gas [chart included] closed down on the day...it by 7 cents at $3.10/1,000 cubic feet. But I was not at all surprised that WTIC's gain was kept small enough to ensure that it didn't trade above, or close above $100/barrel. It gained $2.54...closing at $98.09/barrel. Looking at its 6-month chart below should leave no doubt in anyone's mind that its price is being actively managed...despite what those in the Trump administration say.
Here are the 6-month charts for the Big 6+1 commodities, courtesy of stockcharts.com as always -- and the WTIC chart is worth a look. Click to enlarge.
Now that we're pretty much done to the downside, or just a chip shot away, it's time to look ahead to what their next rallies will look like when they're allowed to begin.
One thing that I didn't notice until I checked just now -- and never mentioned in my COT discussion on gold, is that the Big 8 commercial short position in it is the lowest it's been since early November of 2022 -- and that was before the carnage began this past Wednesday... the day after the cut-off for yesterday's report.
It nearly goes without saying that, with the heavier volume we've had in it over the last three trading sessions, the short position of the Big 8 in gold is also at or close to the lowest on record. Since September 19 of last year, they've bought back/covered 74,000 short contracts in gold -- and almost 42,000 contracts in silver.
As I pointed out in this spot last week, this is one of the reasons that their respective prices have been rising...with the speculators and panic short covering coming in during the last bit...resulting in their parabolic rises. That was when 'da boyz' had to step in to prevent Ted Butler's Bonfire of the Silver Shorts from going supernova.
So, they've spent the last six month carefully reducing their short position in gold to at or close to a record low -- and in the case of silver, it's been nine months in the making to get to their lowest short position on record. Are they going to step back into the lion's mouth by piling back onto the short side as the Managed Money traders et al. begin to go long and cover their short positions when the next rally is allowed to get underway?
That's a good question with no answer at the moment. Many times over the last fifteen or so year, both Ted and I had thought that the stage was set for the collusive commercial traders to back away from the the West's price management scheme that's been in place for 50+ year...but every time we thought that 'this was it'...we ended up being disappointed...as the 'da boyz' returned.
Now we're back on the launch pad one more time...with more rocket fuel on board than there's ever been. And never have the external circumstances surrounding this wildly bullish set-up in the precious metals been as extreme as they are at this point in history....politically, economically, financially, monetarily...or militarily.
You know as well as I, that precious metal prices...along with the prices of a great many other commodities...should be far higher than they are now -- and there's only one reason whey they're not.
Whatever event, or series of them, that is allowed to set the next precious metal rallies in motion, will be tantamount to a 'Great Reset' in many things if the Big 8 commercial traders don't return as short sellers of last resort. And with WW3 creeping up on us at an ever-increasing rate, one should be careful what we wish for.
To quote Hemingway one more time..."War is no longer made by simply analyzed economic forces if it ever was. War is made or planned now by individual men, demagogues and dictators who play on the patriotism of their people to mislead them into a belief in the great fallacy of war when all their vaunted reforms have failed to satisfy the people they misrule."
...or Aldous Huxley..."Liberty, as we all know, cannot flourish in a country that is permanently on a war footing, or even a near war footing. Permanent crisis justifies permanent control of everybody and everything by the agencies of central government."
So we wait some more -- and with some trepidation on my part, I must admit.
However, I'm still "all in" -- and will remain so to whatever end.
I'm done for the day -- and the week -- and I'll see you here on Tuesday.
Ed
About the author

SUBSCRIBE: https://edsteergoldsilver.com/

Ed Steer’s Daily Analysis of the Gold and Silver Markets
After eight years of writing about the precious metals for Casey Research, the folks at Stansberry & Associates—who just recently purchased controlling interest in the company—decided that my ‘niche market’ column didn’t fit into their plans.
Since the time that Casey Research was kind enough to offer me a stand-alone column, it became their most highly-rated blog almost from the outset—and has remained that way up to this date...