If the cumulative global silver deficit since 2004 of one billion ounces wasn’t large enough, a data revision published by the Silver Institute shows the actual figure was much higher. How much higher? A great deal when the additional revised amount would totally wipe out all the silver at the Comex and Shanghai Futures Exchange warehouses.
The Silver Institute receives its figures from the GFMS Team at Thomson Reuters. The GFMS Team also puts out the World Silver Surveys. Some of the data from the World Silver Surveys are published on the Silver Institute website.
Before I get into the details of this deficit revision, I want to discuss the notion put forth by many precious metals investors that “NONE” of the information from the Silver Institute should be trusted. These folks claim that “ALL” the data is manipulated.
While I agree that this data is being researched, quantified and published by Thomson Reuters, one of the largest data-news organizations in the world, there is a lot of good information in these World Silver Surveys. Matter-a-fact, much of the silver mine supply data is taken from government sources such as the USGS in the United States.
Of course, some precious metals investors will say this government mining data shouldn’t be trusted either. Well, if that is true, then the person we are married to or in a relationship with may actually be an alien from some foreign planet. The conspiracy mantra can go to absurd levels. While I believe conspiracies do indeed take place, not everything is manipulated or a conspiracy.
For example, government mining data is pretty accurate because it’s done by bureaucrats who are just doing their job. Furthermore, we can check silver mine supply which is reported by private and public companies and then match it up with the government data. For the most part, this jives nicely.
Of course there are still some precious metals investors who believe all the public and private mining data is manipulated. They may believe that the companies are either under-reporting production or there are a bunch of hidden out-of-the-way mines that are not included in the data. Sure, there could be some mines that are missed or excluded on purpose, but this would be a small amount. We must remember, there are State and Federal taxes that are collected from these mines. Neither the State nor the Federal Govt will forgo receiving taxes just to keep a mine hidden (for the most part).
Lastly, if we look at the trend of all metals production since 1900, they have all gone up exponentially in the same fashion and to the same degree. Regardless, the World Silver Survey is the best information source we can go by, much better than the CPM Group’s Silver Yearbook… in my opinion.
The Cumulative Global Silver Deficit Surges On Revised Data
When the Silver Institute first published their global silver supply and demand table for 2014 in May 2015, it showed a net balance surplus for 2014 (in green):
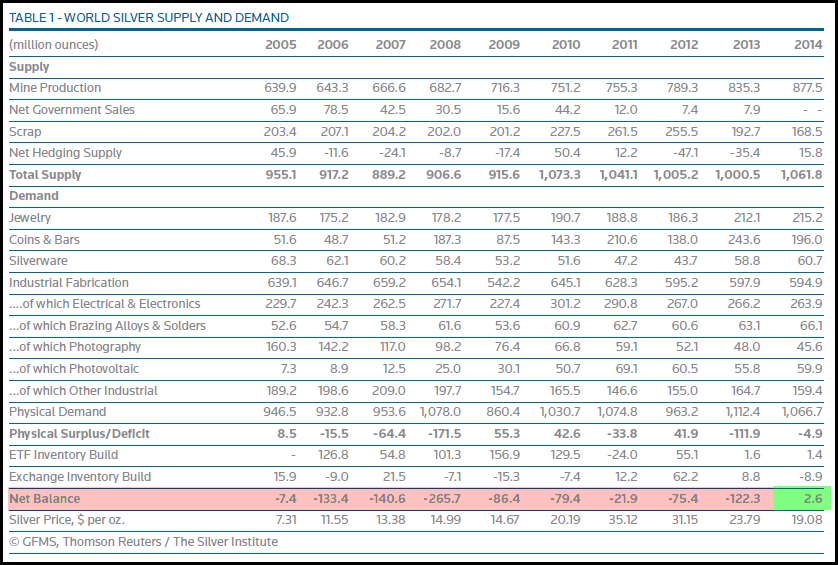
According to the GFMS Team, the world suffered net annual silver deficits from 2005 to 2013. However, this became a small surplus of 2.6 Moz in 2014. Again, this was published back in May of 2015. When they provided their Nov. 2015 Silver Interim Report, they revised their figures to show a 27.5 Moz net deficit for 2014 and a 21.3 Moz deficit for 2015:
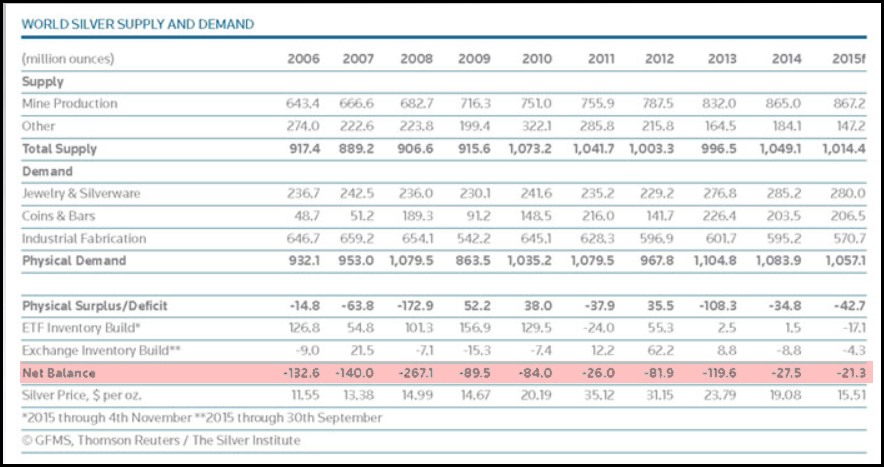
So, now the GFMS Team shows continued annual net silver deficits since 2006. The net deficits did occur in 2004 and 2005, however they were not included in this table. I took the data from this chart as well as the figures for 2004 and 2005 and made my own chart below:
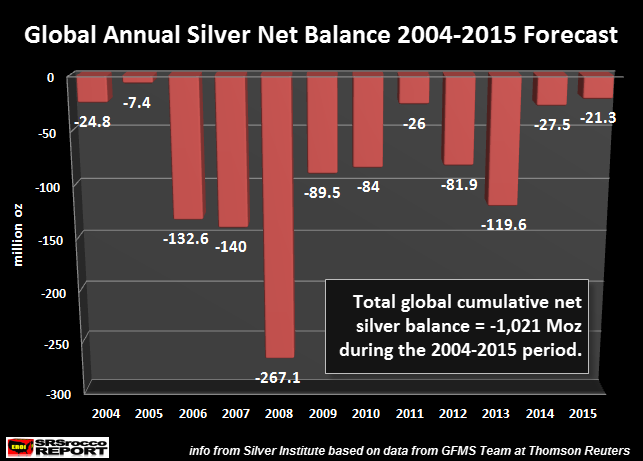
Going by this forecast for 2015, including new data for 2014, the world suffered a cumulative 1,021 Moz net silver supply deficit since 2004. These figures represent changes in Exchanges & ETF’s. The Physical Surplus or Deficit figure shown two lines above the Net Balance figure in the GFMS data tables do not include inventory changes in the Exchanges (Comex & Shanghai Futures Exchange) or the many Electronically Traded Funds (ETF’s). Thus, this net balance figure is the most accurate.
That being said, let’s get to the large global silver supply deficit revision. I mentioned in previous articles, that I had an email exchange with the GFMS Team on the subject of “Private Silver Bars & Rounds” not being included in their figures. They responded by letting me know they were working on including private rounds and bars, but I thought it wouldn’t be for a few years. However, they included private silver rounds and bars in their 2016 World Silver Survey.
Not only did the inclusion of private silver bars and rounds change the figure for 2015, it revised it higher for many years. Which means, physical demand was even higher causing higher deficits. Here is the Silver Institute’s newest 2015 Supply and Demand Table:
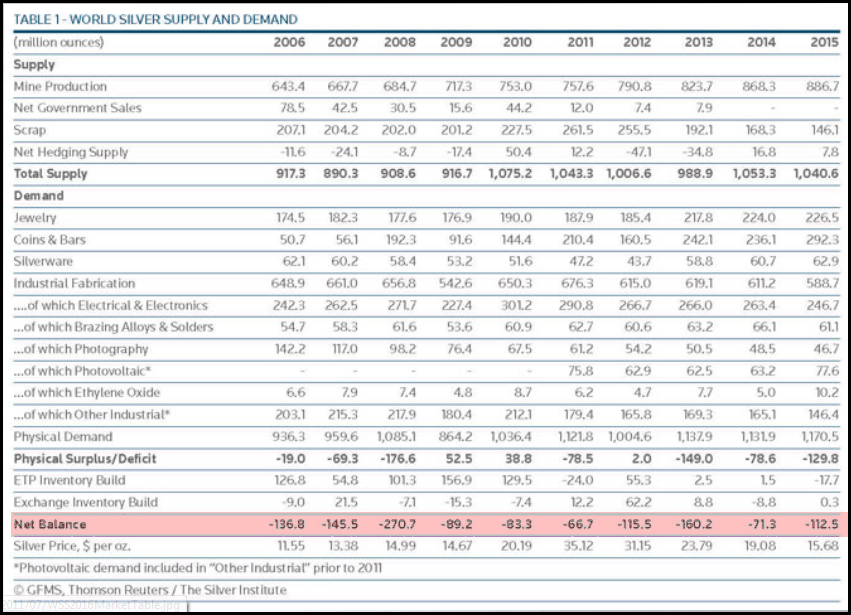
Taking this new revised data and updating my chart, the cumulative global silver net deficit increased 263 Moz to 1,284 Moz, or nearly 1.3 billion oz:
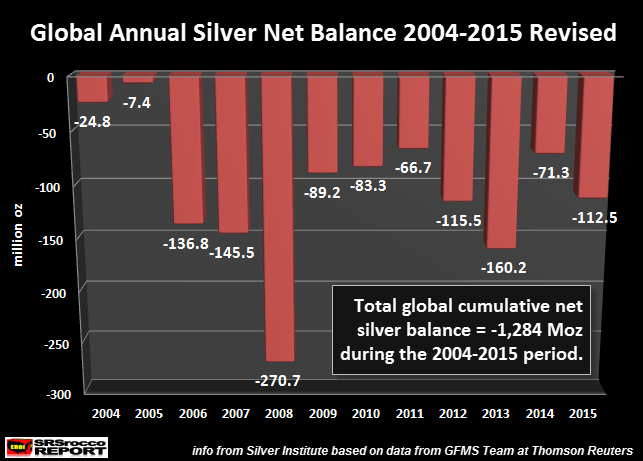
According to their Silver Bar & Coin revisions, about half of the total demand increase came from this segment of the silver market. The GFMS Team also revised Jewelry and Industrial demand higher for certain years. So, half of that 263 Moz net silver deficit increase came in the past few years and most of that figure came from adding Private Bars & Rounds to the data.
NOTE: there are 153 Moz of silver stored at the Comex and 63 Moz at the Shanghai Futures Exchange for a total of 216 Moz. Thus, the GFMS data revision of an additional 283 Moz net balance deficit would totally wipe out all inventory at the Comex and Shanghai Futures Exchange.
Okay, the question going through many readers minds right now is… “Where are they getting all that silver?” My simple answer is, “I don’t really know.” However, it’s likely coming from stockpiles gained during surplus years in the 1980’s and 1990’s. Most of this surplus during the past decades came from old official silver coinage that was too valuable to be used in a fiat monetary system.
It is impossible to know how much of this “Unreported Above-Ground” silver stocks have been depleted and how much remain. Regardless, at some point these remaining silver stocks will be totally overrun. I tried to explain this in my last article, The Foundation Of The Financial Markets Took A Big Hit In 2015, but very few people read it. Unfortunately, most of the sites that refer my work, only do so if I stick to writing about the precious metals.
This is very unfortunate as the energy data is even more important than the precious metals information. I was contemplating adding that article to the bottom of this one so more readers would look at it, but I decided instead just to republish one chart:
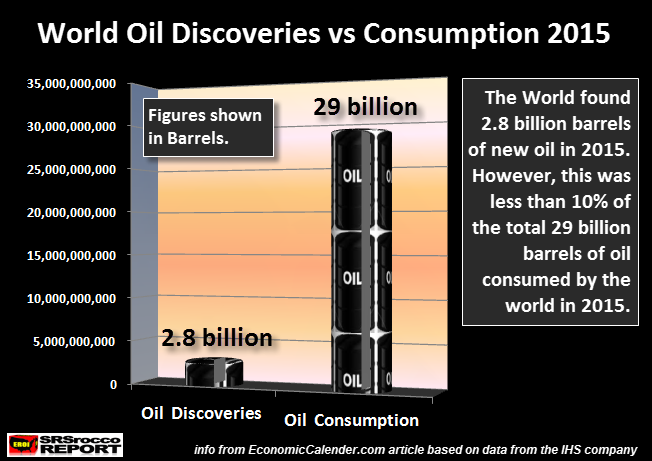
This chart shows that the world spent a lot of capital in 2015 to find 2.8 billion barrels of new oil. Unfortunately, the world consumed 10 times more than that amount at 29 billion barrels. This is extremely bad news for those who believe business as usual will continue forever.
Furthermore, some readers of my work can’t CONNECT THE DOTS. I see this from reading some of their comments of my work on various websites. They say, “If the price of oil does not rise due to future shortages, then why would the price of silver go to $100+?” They are trying point out inconsistencies in my work.
LET ME REPEAT MYSELF on this issue. While I have written in length and made many charts showing the oil-silver price connection in the past, it will be IRRELEVANT in the future. Why? Because of the collapse in value of most paper assets. Paper assets need a growing energy supply to give them value. Falling oil supply will destroy the value of most paper assets (and physical ones including Real Estate).
Which means…. investors will flood into silver and gold to protect what wealth they can from the collapse of paper assets. So, yes… the price of silver can rise to $100 or more even if the price of oil remains low. The price of silver will be based on its HIGH-QUALITY STORE OF VALUE rather than its current COMMODITY-PRICED mechanism.
If more of my followers would read my energy articles, they would realize this. However, the BLINDFOLDS stay on as they continue to just be interested in one aspect of the precious metals market. This is PURE FOLLY.
Check back for new articles and updates at the SRSrocco Report.


