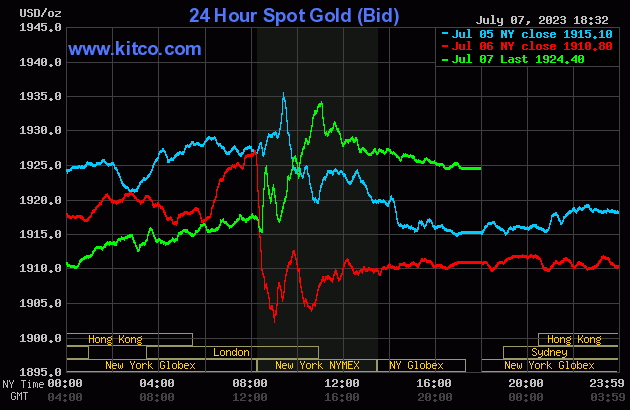
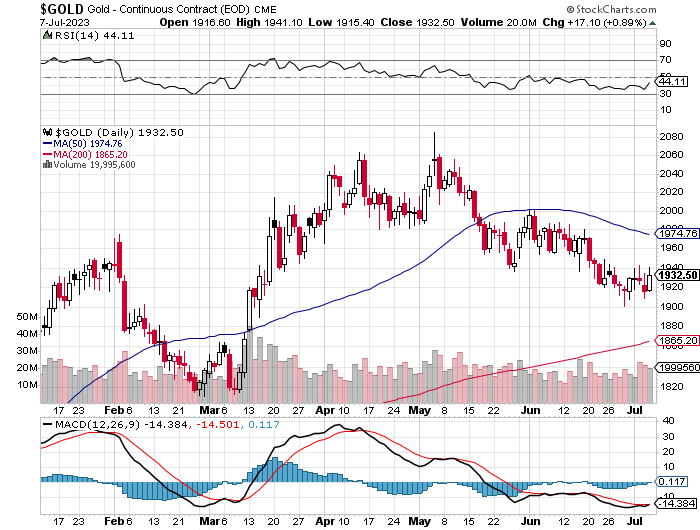
The gold price crept quietly sideways in GLOBEX trading overseas on Friday -- and that lasted until around 12:30 p.m. China Standard Time on their Friday afternoon. It began to crawl higher from there until the 8:20 a.m. COMEX open in New York, where it was tapped a bit lower until the 8:30 a.m. EDT jobs number came out. It then blew higher, but ran into a DXY 'rally' and 'da boyz' five minutes later. It was sold lower for the next thirty minutes, but then away it went to the upside until a couple of minutes after the 11 a.m. EDT London close. The commercial traders of whatever stripe in New York then had the market to themselves -- and they proceeded to engineer its price quietly lower until shortly before trading ended at 5:00 p.m. EDT.
The low and high ticks in gold were reported as $1,915.40 and $1,941.10 in the August contract. The August/October price spread differential in gold at the close in New York yesterday was $9.70...October/December was $19.60 -- and December/February was $19.90 an ounce.
Gold was closed in New York on Friday afternoon at $1,924.40 spot, up $13.60 on the day. Net volume was pretty heavy at a bit over 191,000 contracts -- and there were 23,000 contracts worth of roll-over/switch volume on top of that...mostly into December, but with noticeable amounts into October and February as well.
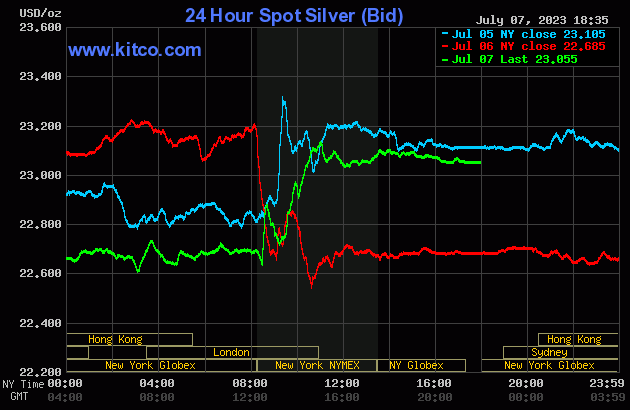
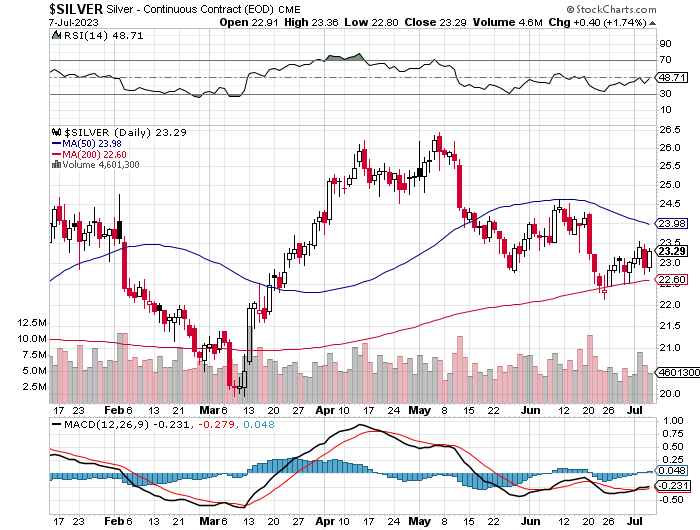
Silver's price path was a carbon copy of gold's, except its COMEX rally was capped at precisely 11 a.m. EDT, the London close -- and although sold a bit lower after that, it wasn't by a lot.
The low and high ticks in it were recorded by the CME Group as $22.80 and $23.365 in the September contract. The July/September price spread differential in silver at the close in New York yesterday was 19.7 cents... September/December was 32.8 cents -- and December/March was 33.8 cents an ounce.
Silver was closed on Friday afternoon in New York at $23.055 spot, up 37 cents from Thursday. Surprisingly once again, net volume was very much on the lighter side at a hair over 47,000 contracts -- and there were just under 1,800 contracts worth of roll-over/switch volume in this precious metal... almost all into December.
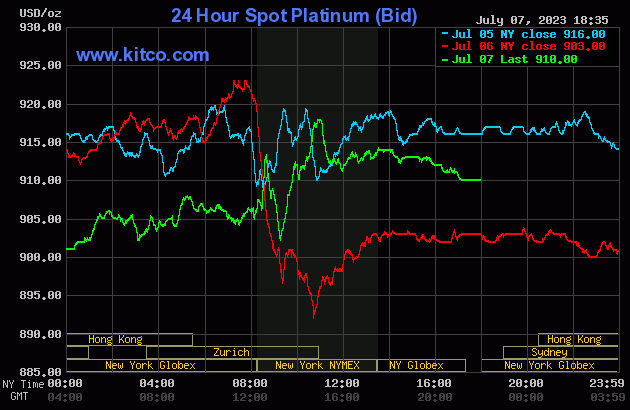
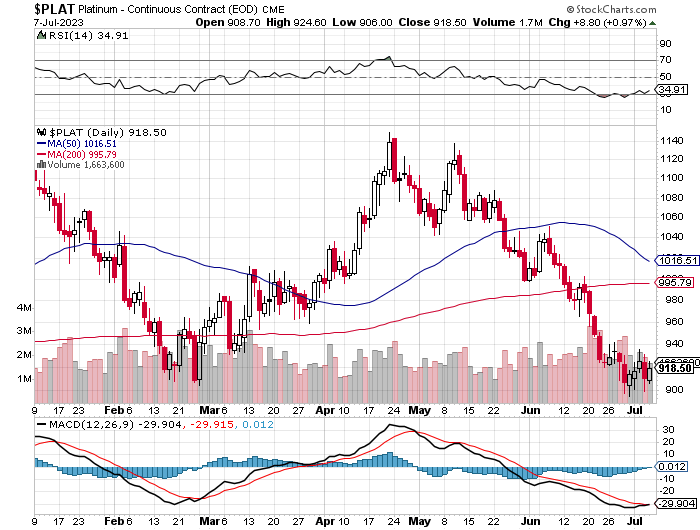
Platinum's price path was a carbon copy of both gold and silver...including its 11 a.m. EDT Zurich close high tick. It was also engineered lower in price from there until the market closed at 5:00 p.m. EDT. Platinum was closed at $910 spot, up 7 dollars on the day.
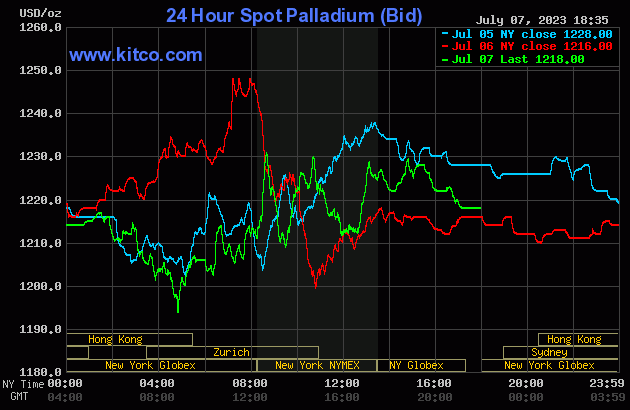
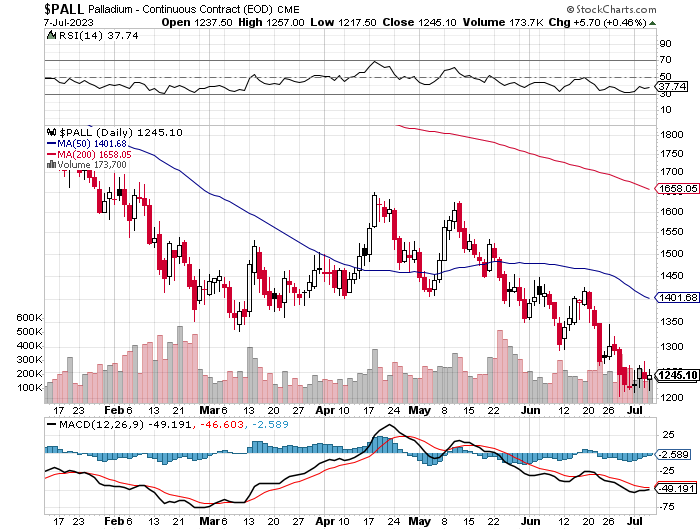
Palladium wandered unevenly sideways until price pressure began shortly before 2 p.m. China Standard Time in GLOBEX trading on their Friday afternoon -- and it was sold lower until its low tick was set minutes before 11 a.m. in Zurich. Its ensuing rally was then stopped dead it its tracks at $1,230 spot on four separate occasions during the COMEX/GLOBEX trading session in New York -- and from around 3 p.m. in the very thinly-traded after-hours market it was sold quietly lower until the market closed at 5:00 p.m. EDT. Palladium was closed at $1,218 spot, up 2 bucks from Thursday -- and 18 dollars off its Kitco-recorded high tick.
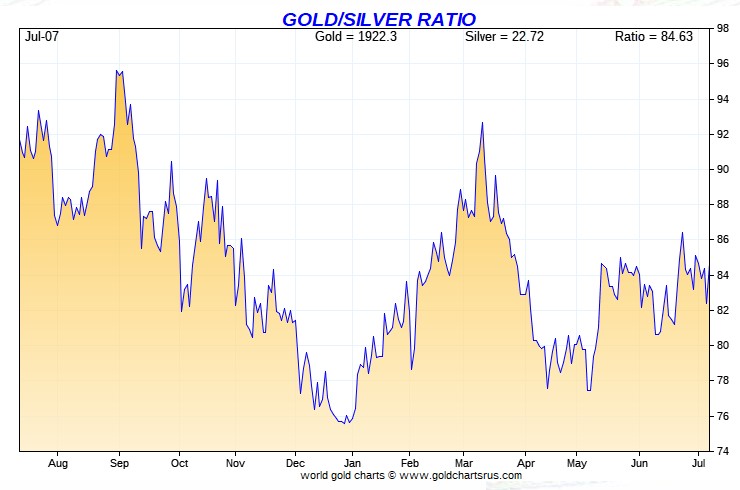
Based on the kitco.com spot closing prices in silver and gold posted above, the gold/silver ratio worked out to 83.5 to 1 on Friday...compared to 84.2 to 1 on Thursday.
Here's Nick Laird's 1-year Gold/Silver Ratio chart, updated with this past week's data. Click to enlarge.
![]()
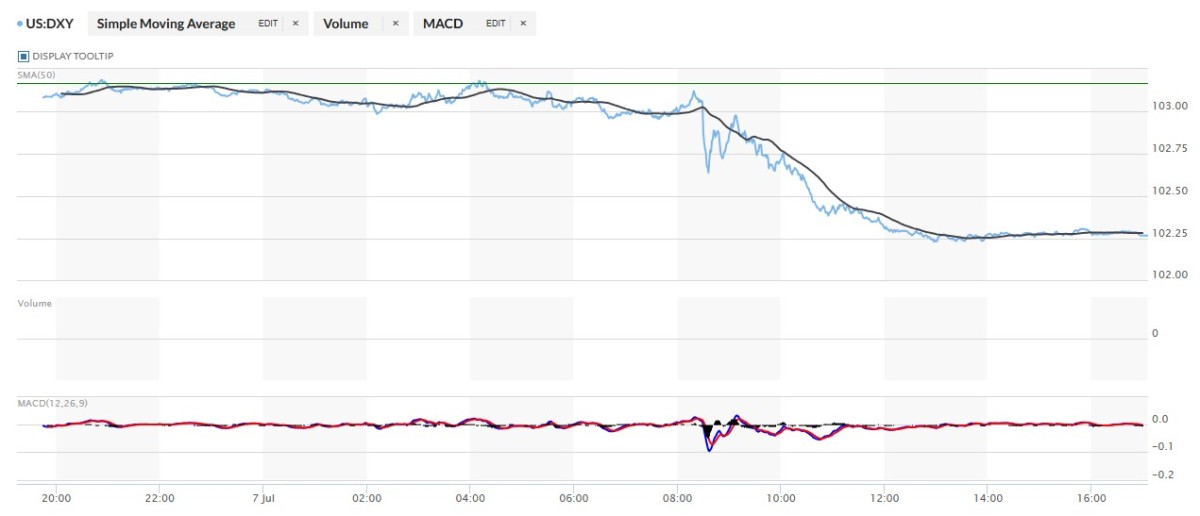
The dollar index closed very late on Thursday afternoon in New York at 103.17 -- and then opened lower by 9 basis points once trading commenced at 7:45 p.m. EDT on Thursday evening, which was 7:45 a.m. China Standard Time on their Friday morning. It rallied a bit until 8:53 a.m. CST -- and from that juncture it wandered quietly and very broadly lower until the jobs report hit the tape at 8:30 a.m. in New York. It crashed at that point -- and the usual 'gentle hands' rescued it for a bit until it began to head lower anew starting around 9:08 a.m. EDT. That sell-off ended around 1 p.m. -- and it didn't do a thing after that.
The dollar index finished the Friday trading session in New York at 102.27...down 90 basis points from its close on Thursday.
Here's the DXY chart for Friday, thanks to marketwatch.com as usual. Click to enlarge.
And here's the 5-year U.S. dollar index chart that appears in this spot every Saturday, courtesy of stockcharts.com as always. The delta between its close....101.95...and the close on the DXY chart above, was 32 basis points below its spot close. Click to enlarge.
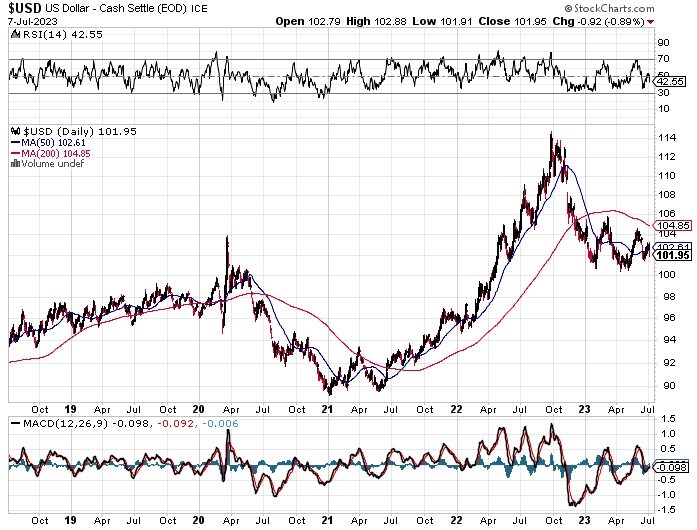
The only exact correlation between the currencies and precious metal prices occurred from the time the jobs report came out at 8:30 a.m. EDT -- and the 11 a.m. EDT London close. All of that correlation looked highly engineered to me -- and I'll have a bit more to say about this in The Wrap.
U.S. 10-Year Treasury: 4.0500%...up 0.0090 (+0.22%)...as of 02:59 p.m. EDT
And here's the 5-year 10-year U.S. Treasury chart from the yahoo.com Internet site -- which puts the yield curve into a somewhat longer-term perspective. Click to enlarge.
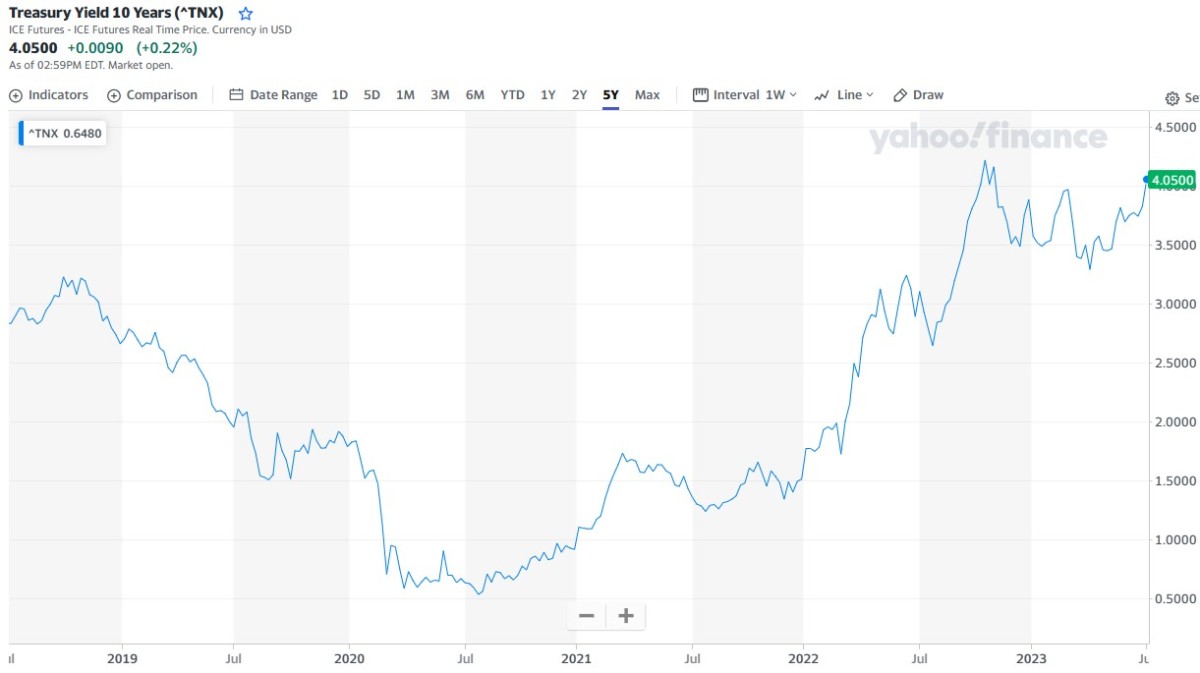
With the 10-year closing above 4% for the second trading session in a row...it will be interesting to see what the Fed does now. I'm sure they've been quite active in keeping it from closing even higher than that it already ha -- and that was most obvious during Friday's trading session, as it was closed well off its high.
![]()
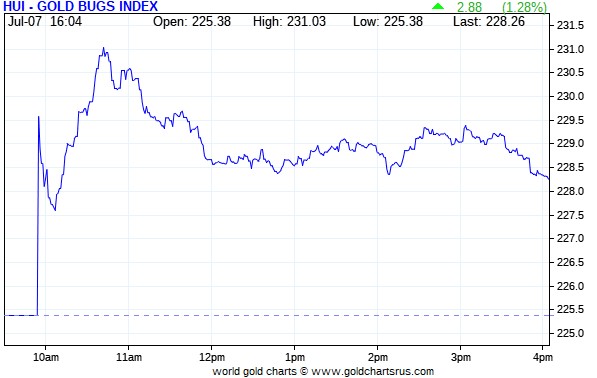
For whatever reason -- and for the second day in a row, the first part of the HUI trace is missing both on Nick Laird's chart -- and also over at Kitco...which is where Nick gets his data feed from. The trace only started a few minutes before 10 a.m. -- and the highs for the gold shares were in by 10:45 a.m. in New York trading, which was about twenty minutes before 'da boyz' capped the rally in gold...which I thought very strange and counterintuitive. I'm not sure what should be read into that. They were then sold lower until exactly noon EDT -- and from that point they didn't do a whole heck of a lot. The HUI closed up an underwhelming 1.28 percent.
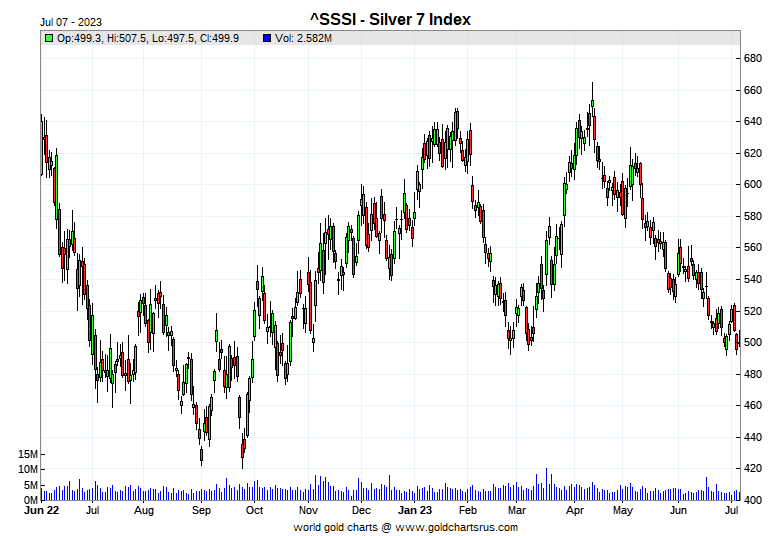
Computed manually, the new Silver Sentiment/Silver 12 Index closed higher by an even more underwhelming 1.18 percent.
Here's Nick's old 1-year Silver Sentiment/Silver 7 Index chart, updated with Friday's candle. Click to enlarge.
The star yesterday was SilverCrest Metals, as it closed up 2.83 percent -- and the dog was Silvercorp Metals, as it closed down on the day by 1.07 percent.
The reddit.com/Wallstreetsilver website is still going -- and the link to it is here. The link to two other silver forums are here -- and here.
![]()
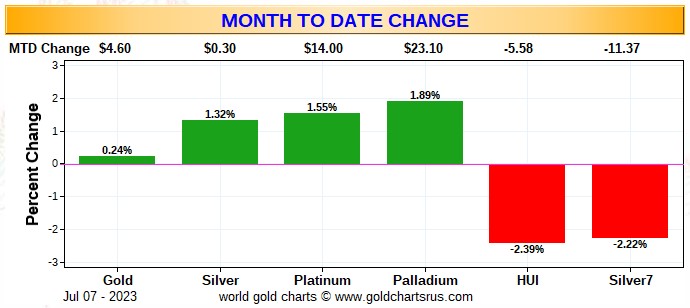
Here are two of the usual three charts that show up in every weekend missive. They show the changes in gold, silver, platinum and palladium in both percent and dollar and cents terms, as of their Friday closes in New York — along with the changes in the HUI and the old Silver 7 Index.
Because of the Independence Day holiday on Tuesday, the weekly chart is not accurate, so I shan't bother posting it. It will return in its usual spot next week.
Here's the month-to-date chart -- and despite the fact that both gold and silver are higher...albeit not by much...their associated equities continue to vastly underperform. Click to enlarge.
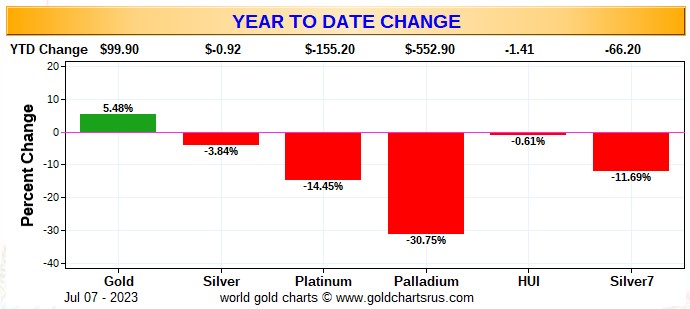
Here's the year-to-date graph -- and only gold itself is up year-to-date, with its associated equities wildly underperforming. Silver and its associated equities are still both down on the year. Of course -- and as I mention in this spot every Saturday -- and will continue to do so...is that if the silver price was sitting within 5 or so percent of its old high of $50 the ounce...like gold is currently within 5 percent or so of breaking above its old high of around $2,080...it's a given that the silver equities would be outperforming their golden cousins by an absolute country mile. That day is coming at some point. Click to enlarge.
With these current "wash, rinse, spin" engineered price declines still a work in progress, courtesy of the collusive commercial traders of whatever stripe, it remains to be seen how long this goes on for this time around. But from a COMEX futures market perspective, the setup remains wildly bullish in silver, as it has been for several months now -- and is even more so with yesterday's COT Report in hand. Unfortunately, the same cannot be said of gold -- and therein lies the rub...as it's difficult to see how it can rally much with its bearish set-up. But stranger things have happened.
![]()
The CME Daily Delivery Report for Day 6 of July deliveries showed that 43 gold -- and 34 silver contracts were posted for delivery within the COMEX-approved depositories on Tuesday.
In gold, the two largest of the four short/issuers in total were Advantage and Morgan Stanley, as they issued 32 and 8 contracts out of their respective client accounts. And of the six long/stoppers in total, the two biggest there were BofA Securities and Canada's Scotia Capital/Scotiabank, as they stopped 23 and 10 contracts -- and all for their respective house accounts.
In silver, the sole short/issuer was Advantage, issuing all 34 contracts out of their client account -- and the largest of the three long/stoppers was BofA Securities, as they picked up 28 contracts for their house account. ADM and the CME Groups stopped 4 and 2 contracts respectively...the latter for their own account.
The CME Group immediately reissued those as 2x5=10 of those one-thousand ounce micro silver futures contracts. Advantage, Morgan Stanley and ADM picked up 6, 3 and 1 contracts for their respective client accounts.
The link to yesterday's Issuers and Stoppers Report is here.
So far in July, there have been 2,159 gold contracts issued/reissued and stopped -- and that number in silver is 3,430 contracts. In platinum, there have been 870 contracts issued and stopped -- and that number in palladium is zero.
The CME Preliminary Report for the Friday trading session showed that gold open interest in July fell by 313 contracts, leaving just 59 left, minus the 43 contracts mentioned a few paragraphs ago. Thursday's Daily Delivery Report showed that 356 gold contracts were actually posted for delivery on Monday, so that means that 356-313=43 more gold contracts were added to July deliveries -- and those are the ones most likely out for delivery on Tuesday as per the above Daily Delivery Report. Silver o.i. in July declined by 27 contracts, leaving 228 still open, minus the 34 contracts mentioned a few paragraphs ago. Thursday's Daily Delivery Report showed that 59 silver contracts were actually posted for delivery on Monday, so that means that 59-27=32 more silver contracts just got added to the July delivery month -- and I suspect that those 32 are scheduled for delivery on Tuesday as well.
Total gold open interest at the close on Friday increased by a net 3,236 COMEX contracts -- and total silver o.i. COMEXrose by 1,138 contracts. Both numbers are subject to some revision by the time the final figures are posted on the CME's website later on Monday morning CDT.
![]()
There were withdrawals from both GLD and SLV on Friday, as authorized participants removed 83,564 troy ounces of gold from the former -- and 1,650,918 troy ounces of silver from the latter.
In other gold and silver ETFs and mutual funds on Planet Earth on Friday,net of any changes in COMEX, GLD and SLV inventories...there were a net 32,805 troy ounces of gold removed -- and net 384,833 troy ounces of silver was taken out as well, with most of that amount...316,886 troy ounces ...coming out of iShares/SVR.
There was no sales report from the U.S. Mint yesterday -- and none so far in July.
![]()
There was some activity in gold over at the COMEX-approved depositories on the U.S. east coast on Thursday. There were 32,011 troy ounce received at Asahi...which was within 2 troy ounces of what they reported receiving on Wednesday. There were 482.265 troy ounces/15 kilobars shipped out -- and all of that/those left JPMorgan. There was no paper activity -- and the link to this, in troy ounces, is here.
The manic in/out movement in silver continues without a break, as 612,052 troy ounces/one truckload was reported received at Brink's, Inc. -- and 1,238,404 troy ounces/two truckloads were shipped out. In the 'out' category, the largest truckload...620,480 troy ounces...departed Loomis International -- and the other truckload....598,152 troy ounces...left JPMorgan.
There was even bigger paper activity, as 3,124,481 troy ounces were transferred from the Registered category and back into Eligible. Five different depositories were involved -- and the largest two amounts were the 1,590,208 and 748,949 troy ounces that were transferred over at Manfra, Tordella & Brookes Inc. and Malca-Amit USA respectively. After them were the 612,052 troy ounces/one truckload that made that same trip over at Brink's, Inc.
These transfers from Registered to Eligible are most likely all silver delivered in July so far -- and are being transferred to save on storage fees. It also indicates that they new owners aren't planning on parting with it any time soon. I'm sure that Ted would suspect that this is all owned by friends of JPMorgan.
The link to all of Thursday's considerable COMEX action in silver, is here.
There was only a tiny bit of activity over at the COMEX-approved gold kilobar depositories in Hong Kong on their Thursday. There were only 12 kilobars received -- and 110 were shipped out. Except for the 81 kilobars that left Loomis International, the remaining in/out activity took place over at Brink's, Inc. as usual. The link to this, in troy ounces, is here.
![]()
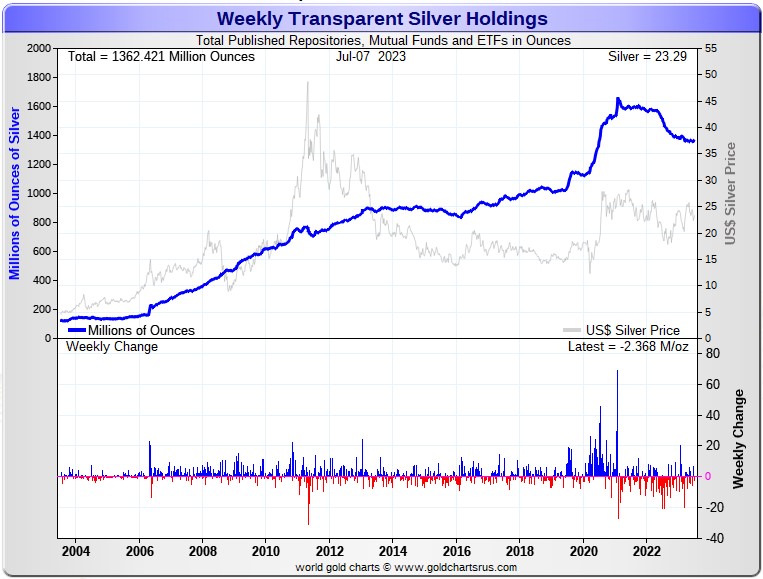
Here are the usual 20-year charts that show up in this space in every Saturday column. They show the total amounts of physical gold and silver held in all know depositories, ETFs and mutual funds as of the close of business on Friday.
During the week just past, there were a net 593,000 troy ounces of gold removed -- and a net 2.368 million troy ounces of silver was taken out as well. Click to enlarge for both.
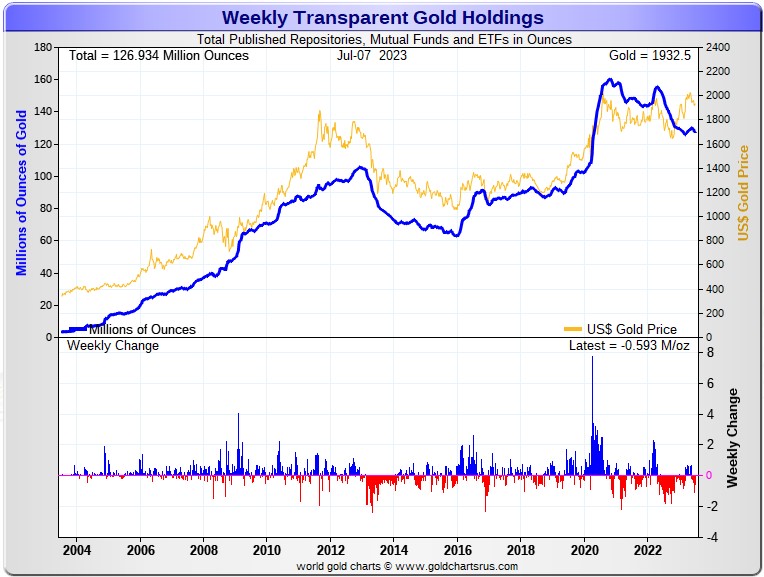
According to Nick Laird's data on his website, there have been a net 2.451 million troy ounces of gold removed -- but a net 1.326 million troy ounces of silver has been added inall the world's known depositories, mutual funds and ETFs during the last four weeks.
In gold, there have been no net deposits worthy of the name during the last month. The two largest 'out' amounts by far were the 589,000 troy ounces that left GLD...followed by the 493,000 troy ounces that departed the COMEX. After them were the 335,000 troy ounces that left iShares/SGLN -- and the 244,000 troy ounces out of iShares/IAU. The list goes on and on...
In silver, the only depository showing a deposit that mattered were the 4.875 million troy ounces added to the COMEX. Way down the list after them were the 310,000 and 206,000 troy ounces deposited in ZKB/ZSIL and BullionVault respectively. The largest 'out' amount were the 1.566 million troy ounces that left SIVR. In second spot were the 931,000 troy ounces taken out of iShares/ SLV -- and in third place were the 682,000 troy ounces removed from iShares/SVR.
Retail bullion sales remains very quiet to nonexistent -- and all on-line retail bullion stores now show a complete line of products, with only a few items on back order. That situation will exist until the next buying frenzy commences... which is coming as surely as day follows night.
The physical demand in silver at the wholesale level continues unabated, as the manic in/out activity at the COMEX and SLV over the last month shows. This means that most of what's left in their inventories is not available for sale...especially the COMEX -- and new silver has to be brought in from other sources [JPMorgan?] to meet the ongoing rabid demand for physical metal.
I know that Ted will have lots more to say about this in his weekly review this afternoon.
The vast majority of precious metals being held in these depositories are by those who won't be selling until the silver price is many multiples of what it is today. That's particularly true of shareholders in PSLV...who are adding to their stash at every opportunity. What that hiccup in their inventories was all about last week is anyone's guess.
Sprott's PSLV is the third largest depository of silver on Planet Earth with 175 million troy ounces -- and some distance behind the COMEX, where there are 278 million troy ounces being held. However, as Ted Butler has mentioned from time to time, it's most likely that 105 million troy ounces of that amount is actually held in trust for SLV. But PSLV is light years behind SLV, as they are the largest silver depository, with 465 million troy ounces as of Friday's close.
The latest short report from Thursday, June 27 showed that the short position in SLV rose by 32.54%...up to 18.81 million shares held short. The next short report will be posted on The Wall Street Journal's website on Wednesday, July 12.
Then there's that other little matter of the 1-billion ounce short position in silver held by Bank of America...with JPMorgan & Friends on the long side. Ted says it hasn't gone away -- and he's also come to the conclusion that they're now short around 37 million ounces of gold with these same parties as well... up 12 million oz. from the 25 million they were short in the March OCC Report. You can read Ted's commentary about it linked here.
![]()
The Commitment of Traders Report, for positions held at the close of COMEX trading on Tuesday, showed a tiny increase in the Commercial net short position in silver...but a big increase in gold. However that increase was entirely due to Ted's raptors selling long positions, which has the mathematical effect of increasing the short position, which isn't an increase at all.
In silver, the Commercial net short position increased by a paltry 242 COMEX contracts, or 1.210 million troy ounces of the stuff...barely a rounding error, if that.
They arrived at that number by decreasing their long position by 4,939 COMEX contracts, but also reduced their short position by 4,697 contracts -- and it's the difference between those two numbers that represents their change for the reporting week.
Under the hood in the Disaggregated COT Report, the Managed Money traders reduced their net long position by 1,110 contracts -- and are still net long silver by just about 9,800 contracts. The Other Reportables and Nonreportable /small traders were both buyers during the reporting week, as the former increased their net long position by a piddling 48 contracts -- and the latter by 1,304 COMEX contracts.
Doing the math: 1,304 plus 48 minus 1,110 equals 242 COMEX contracts, the change in the Commercial net short position.
The Commercial net short position in silver now stands at 29,569 COMEX contracts/147.845 million troy ounces...up those 242 contracts from the 29,327 COMEX contracts/146.635 million troy ounces they were short in June 30 COT Report.
The Big 4 shorts increased their short position by 384 contracts, from 33,713 contracts, up to 34,097 contracts...the lowest its been since the April 14 COT Report -- and within an eyelash of being the lowest on record.
And, for the fourth week in a row, the '5 through 8' big shorts decreased their net short position, this time by 1,661 contracts -- and are currently short 17,850 COMEX contracts, which continues to be a very positive development.
That Managed Money traders is still there -- and contaminating the Big '5 through 8' category. Ted figures that they reduced their short position down to 3-4,000 contracts held short -- and are certainly the smallest trader in that category.
The Big 8 shorts in total decreased their net short position from 53,224 contracts, down to to 51,947 COMEX contracts week-over-week. But you have to subtract out the short position of that Managed Money trader...3-4,000 contracts or so...so the Big 8 commercial short position, in reality, is around 48,000 contracts...which is a very low number on an historical basis.
And because there's still that Managed Money trader contaminating the Big 8 commercial category, it's not possible to calculate the long position that Ted's raptors hold with complete accuracy...but in the "close enough" category, they added maybe a thousand or so long contracts during the reporting week -- and are net long around somewhere in the area of 19,000 COMEX contracts...give or take 500.
Don't forget, that despite their small size, they're still commercial traders in the commercial category -- and all in the Swap Dealers category.
Here's Nick's 3-year COT Report for silver, updated with the above data. Click to enlarge.
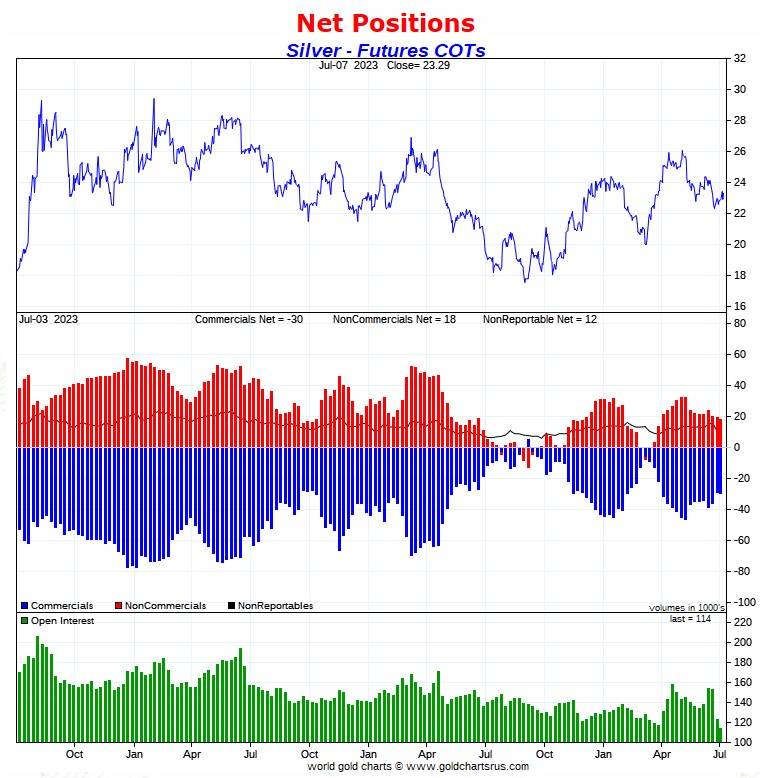
And like last week, Ted said that it doesn't really matter about the short position held by that Managed Money trader in the Big '5 through 8' category, as the white-hot bullish case for silver from a COMEX futures market perspective is still in place regardless.
As stated in this COT Report, the Managed Money traders as a group are still net long 9,800 contracts...down about 1,100 from last week's COT Report.
The commercial traders of whatever stripe would love to get these Managed Money traders to puke up that amount...plus go short 5 or 10,000 contracts on top of that, as that would allow them to cover even more of their short positions...or add more longs as would be the case for Ted's raptors.
So far these Managed Money traders have been very reluctant to do either -- and this is the fight that's going on in the COMEX futures market in silver at the moment. But if the commercials are successful, it means [very temporary] lower prices. That hasn't happened yet -- and may not.
![]()
In gold, the commercial net short position increased by 9,382 COMEX contracts, or 938,200 troy ounces of the stuff. I was horrified by that number, until I looked 'under the hood'.
They arrived at that number by reducing their long position by 4,149 COMEX contracts -- and also added 4,149 short contracts. It's the sum of those two numbers that represents their change for the reporting week.
Under the hood in the Disaggregated COT Report it was all Managed Money traders and then some on the buy side, as they increased their net long position by a fairly hefty 13,473 COMEX contracts...while the other two categories were sellers. The Other Reportables reduced their net long position by 2,286 contracts -- and the Nonreportable/small traders by 1,805 contracts.
Doing the math: 13,473 minus 2,286 minus 1,805 equals 9,382 COMEX contracts, the change in the commercial net short position.
The commercial net short position in gold now sits at 184,717 COMEX contracts, or 18.472 million troy ounces of the stuff...up those 9,382 contracts from the 175,335 contracts/17.534 million troy ounces they were short in the June 30 COT Report.
The Big 4 shorts decreased their net short position from 166,266 contracts, down to 163,542 COMEX contracts...a drop of 2,724 contracts -- and the lowest its been since the beginning of April.
The Big '5 through 8' shorts decreased their net short position by an inconsequential amount...from the 59,165 contracts they held short in the June 30 COT Report, down to 59,145 contracts held short in the current COT Report...a decrease of a meaningless 20 COMEX contracts...nothing at all.
The Big 8 shorts in total decreased their net short position from 225,431 COMEX contracts, down to 222,687 contracts...an decrease of 2,744 COMEX contracts...[2,724 plus 20].
Ted's raptors, the small commercial traders other than the Big, were the surprise big sellers during the reporting week, decreasing their long position from 50,096 COMEX contracts...down to 37,970 COMEX contracts...a decrease of 12,126 contracts.
When you subtract those 12,126 contracts the raptors sold, from the 2,744 contracts that the Big 8 bought on a net basis during the reporting week, you come up 9,382 COMEX contracts...the change in the commercial net short position.
And as I keep pointing out, this ain't rocket science...it's just math.
And don't forget that despite their small size, they are great in number -- and these raptors in gold are still commercial traders in the commercial category. It's on weeks like this that their presence can be both seen and felt.
Here's Nick Laird's 3-year COT Report chart for gold, updated with the above data. Click to enlarge.
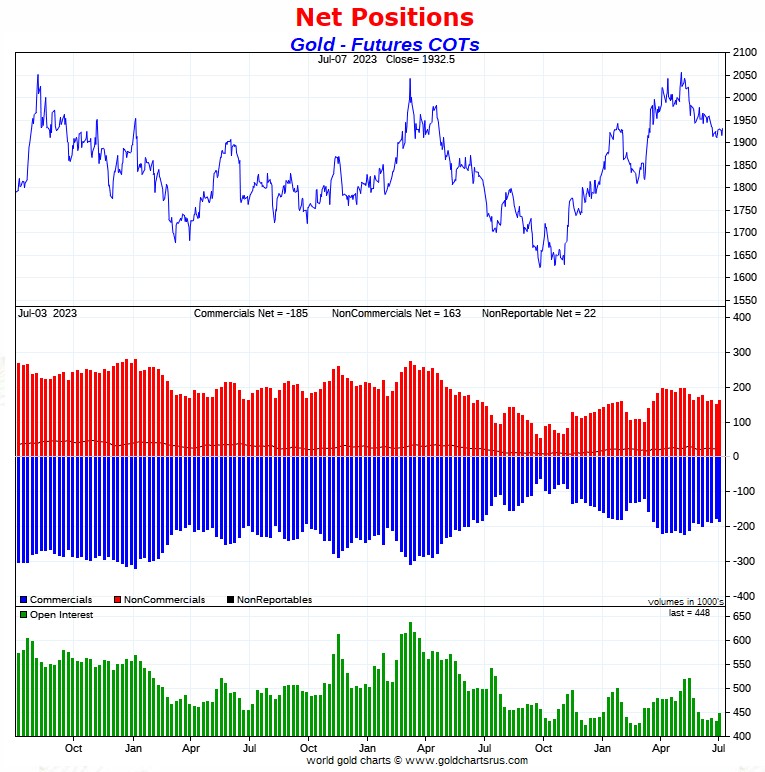
But even with this further improvement in the Big 8 short position...plus [hopefully] further improvement since the Tuesday cut-off...from a COMEX futures market perspective, gold is still in a bearish configuration -- and that's despite the fact that it's now well below its 50-day moving average, with the 200-day beckoning. It's still my opinion that this is a 'bridge too far' -- and only time will tell whether I'm proven correct...or have to eat crow at some point.
This is why I'm still concerned about a continuing engineered price smash in this precious metal. But whether or not that will materialize, is another question.
This glaring dichotomy between the wildly bullish set-up in silver and the still bearish set-up in gold continues...so place your bets as to how this all plays out in the days and weeks ahead.
But make no mistake about it -- and as you already know, the commercial traders of whatever stripe are still running the price management show in all four precious metals...plus other commodities. That will last until they allow it to end.
![]()
In the other metals, the Managed Money traders in palladium [not surprisingly] increased their net short by a further 864 COMEX contracts -- and are now net short palladium by a very hefty 7,554 contracts...51 percent of total open interest. The commercial traders are very net long palladium in both categories...especially the Swap Dealers. All the other categories are net short. In platinum, the Managed Money traders decreased their net long position by a further 5,604 COMEX contracts -- and are now back on the short side by a net 3,548 contracts. The Producer/Merchant category is the only other category net short platinum at the moment -- and they are mega net short to the tune of 22,302 contracts -- and are mostly U.S. bullion banks. The rest of the categories are net long by very decent amounts.
In copper, the Managed Money traders decreased their net long position by a whopping 11,677 contracts --but are still net long copper by 8,966 COMEX contracts...about 224 million pounds of the stuff as of the July 7 COT Report... down from the 516 million pounds they were net long in last week's report.
Copper, like platinum, continues to be a wildly bifurcated market in the commercial category. The Producer/Merchant category is net short 42,846 contracts -- and the Swap Dealers are net long 49,459 COMEX contracts. How's that for bifurcation?
But whether that mean anything or not, will only be known in the fullness of time. Ted says it doesn't mean anything as far as he's concerned, as they're all commercial traders in the commercial category.
In this vital industrial commodity, the world's banks...both U.S. and foreign... are net long 9.1 percent of the total open interest in copper in the COMEX futures market in the June Bank Participation Report, which came out four weeks ago...down a goodly amount from the 12.5 percent they were net long in May's. At the moment it's the commodity trading houses such as Glencore and Trafigura et al., along with some hedge funds, that are mega net short copper in the Producer/Merchant category, as the Swap Dealers are mega net long, as I pointed out above. The world's banks are all net long copper as well.
![]()
The July Bank Participation Report was a 'no show' on Friday for whatever reason...so hopefully it will be out on Monday -- and I'll report on it in my Tuesday missive.
![]()
Here’s Nick Laird’s “Days to Cover” chart, updated with the COT data for positions held at the close of COMEX trading on Monday, July 1. It shows the days of world production that it would take to cover the short positions of the Big 4 — and Big '5 through 8' traders in every physically traded commodity on the COMEX. Click to enlarge.
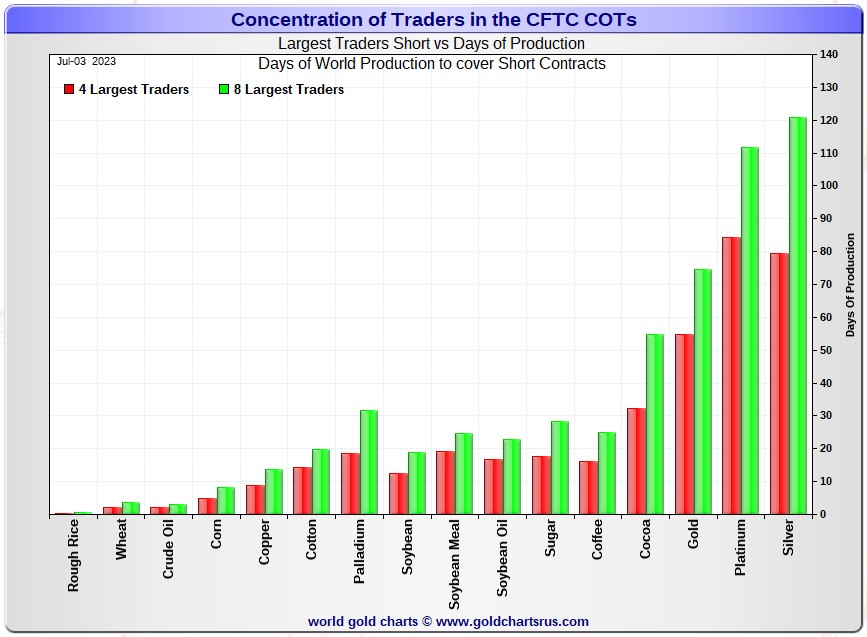
In this week's data, the Big 4 traders are short about 79 days of world silver production, up about 1 days from the June 30 COT Report. The ‘5 through 8’ large traders are short an additional 42 days of world silver production, down about 4 days from the June 30 COT Report, for a total of about 121 days that the Big 8 are short -- and down about 3 days from last week.
Those 121 days that the Big 8 traders are short, represents four months of world silver production, or 259.74 million troy ounces/51,947 COMEX contracts of paper silver held short by these eight traders. The two or three largest of these are now non-banking entities, as per Ted's discovery in last December's Bank Participation Report. But this Big 8 commercial short position is still contaminated by the one Managed Money trader that is now embedded in it, so these numbers are overstated by 3-4,000 COMEX contracts/15-20 million troy ounces.
Because of that Managed Money trader now in the Big 8 category, the long position of Ted raptors, the small commercial traders other than the Big 8, cannot be calculated accurately...but it's somewhere around 95 million troy ounces/19,000 contracts, give or take 2.5 million ounces or so...up a bit from what they were long in last week's COT Report.
In gold, the Big 4 are short 55 days of world gold production, down about 1 day from the June 30 COT Report. The '5 through 8' are short 20 days of world production, unchanged from the June 30 COT Report...for a total of 75 days of world gold production held short by the Big 8 -- and obviously down about 1 day from last week's COT Report.
The Big 8 commercial traders are short 45.4 percent of the entire open interest in silver in the COMEX futures market as of yesterday's COT Report, up from the 43.1 percent that they were short in the June 30 COT Report...which I explain in the next paragraph. And once whatever market-neutral spread trades they have on are subtracted out, that percentage would be something over the 50 percent mark. In gold, it's 49.7 percent of the total COMEX open interest that the Big 8 are short, down a bit from the 52.2 percent they were short in the June 23 COT Report -- and a bit over the 55 percent mark once their market-neutral spread trades are subtracted out.
The reason that the percentage change in silver was big as it was, was because of the 9,070 contract drop in open interest during the reporting week, as the remaining previously-added uneconomic and market-neutral spread traders were taken off...a 7% drop in open interest...which has the affect of increasing the concentration of the Big 8 traders.
And as mentioned earlier, Ted is still of the opinion that Bank of America is short about one billion ounces of silver in the OTC market, courtesy of JPMorgan & Friends. He's also of the opinion that they're now short 37 million troy ounces of gold, as of the March OCC Report...with the same bunch of JPMorgan & Friends crooks on the long side. That up up 12 million ounces from the 25 million that they were short in the December OCC Report.
If BofA gets hung out to dry, they could possibly end up being the next Bear Stearns. However, there won't be anyone to save them...except the Fed, or maybe the Exchange Stabilization Fund.
And as you already, know the short position in SLV rose from 14.19 million shares, up to 18.81 million shares in the June 27 short report -- and Ted is of the opinion that the almost 8 million troy ounces of silver that was added to SLV about two months ago now...plus much more since then...was used to cover even more of the remaining short position. Most of these amounts haven't shown up as of yet -- and Ted feels that the only reason that they haven't is because whoever the short is, is "short against the box" -- and that all these reductions will show up eventually. Shorting against the box was primarily used for tax-minimization purposes at one time...but in this case it's being used to hide the fact that short positions have already been covered.
The next short report is due out on Wednesday, July 12.
The situation regarding the Big 4/8 concentrated commercial short positions in silver and gold is still obscene, particularly in gold.
As Ted has been pointing out ad nauseam forever, the resolution of the Big 4/8 short positions will be the sole determinant of precious metal prices going forward. And as I've been mentioning for months now, the Big 4 commercial traders have been very reluctant to add to their short positions in silver since late February...and are now sitting close to their lowest short position ever at the moment.
The only reason that the Big 4/8 short position in silver is as high as it is currently, is because of that Managed Money trader that's short around 3-4,000 contracts in the Big '5 through 8' category. Remove them -- and the Big 8 commercial short position remains very, if not wildly bullish.
And, as always, nothing else matters.
As mentioned in my discussion on copper further up, there was no July Bank Participation Report posted on the CFTC's website on Friday for whatever reason -- and I'm hopeful that it will show up on Monday. But I'll point out that this is the first time since I've been reporting on it that it hasn't appeared alongside it's companion COT Report on this one day a month -- but I'm not reading anything into that, expect to point out that it's highly unusual.
I have about an average number of stories, articles and videos for you today.
![]()
CRITICAL READS
U.S. job gains smallest in 2-1/2 years; labor market still tight
The U.S. economy added the fewest jobs in 2-1/2 years in June, but persistently strong wage growth pointed to still-tight labor market conditions that most certainly ensure the Federal Reserve will resume raising interest rates later this month.
The Labor Department's closely watched employment report on Friday also showed 110,000 fewer jobs were created in April and May, indicating that higher borrowing costs were starting to dampen businesses' appetite to continue boosting headcount. There was also a jump in the number of people working part-time for economic reasons last month, in part because their hours had been reduced due to slack work or business conditions.
Nevertheless, the pace of jobs growth remains strong by historical norms and added to data this week showing an acceleration in services sector activity in suggesting that the economy was nowhere near a long-forecasted recession.
"The payroll numbers gave a whiff of weakening, but the labor market remains strong," said Sean Snaith, the director of the University of Central Florida's Institute for Economic Forecasting. "By no means is the Fed's work done.
We're in a protracted battle against inflation, and nothing in today's report suggests otherwise."
Nonfarm payrolls increased by 209,000 jobs last month, the smallest gain since December 2020, the survey of establishments showed. Economists polled by Reuters had forecast payrolls rising 225,000. It was the first time in 15 months that payrolls missed expectations.
Job growth averaged 278,000 per month in the first half of the year. The economy needs to create 70,000-100,000 jobs per month to keep up with growth in the working-age population.
This Reuters story, filed from Washington, appeared on their Internet site at 10:46 a.m. PDT on Friday morning -- and comes to us courtesy of Swedish reader Patrik Ekdahl. Another link to it is here. The Zero Hedge spin on this, thanks to Brad Robertson, is headlined "June Payrolls Tumble to 209K, Lowest Since 2020 and First Miss in 13 Months, But Wages Come in Hot" -- and linked here.
![]()
Pointing to the “really” inverted yield curve, a contraction in money supply growth (“most since the 1930s”), and significant Fed tightening (rates and QT), Hyman sees mild recession on the horizon. Yet Hyman remains constructive on stocks (until recession hits).
I am compelled to note that the yield curve has been inverted for a year. I believe the inversion is more related to the bond market discounting the odds of an accident and panicked Fed response than a recession forecast. And my analytical framework de-emphasizes the contraction in M2 when money fund assets have expanded $581 billion (36% annualized) over the past 17 weeks, with one-year growth of $917 billion, or 20.1%. The bottom line is that the Fed/FHLB liquidity surge in response to the March banking crisis unleashed major speculative and liquidity excesses. Bursting Bubbles today pose extreme systemic risk.
I highlight Ed Hyman’s Wednesday comments, as they encapsulate the consensus bullish view for financial assets. Contracting money supply ensures inflation is no longer an issue; the yield curve signals the nearing conclusion to the Fed’s tightening cycle; and an economic slowdown will be constructive for bonds and stocks.
That was on Wednesday. Things looked different on Thursday.
And then stronger-than-expected service sector data hit. The ISM Services Index rose three points to a stronger-than-expected 53.9, underscoring notably broad-based strength. The June Business Activity component surged to 59.2 from May’s 51.5, the strongest reading since January. Employment rose to 53.1 from 49.2 (strongest since February), while New Orders gained from 52.9 to 55.5. Fifteen of the 18 industries surveyed reported a June boost in activity.
Also Thursday, persistent labor market strength was confirmed by JOLTS (job vacancies), Challenger Job Cuts, and weekly jobless claims data.
Market reaction was swift and forceful. Two-year Treasury yields traded up as much as 16 bps to 5.11% - the high back to July 2006. Ten-year Treasury yields rose to 4.08%, the high since November 9th. Benchmark MBS surged a notable 25 bps at Thursday’s intraday high to 6.05%, nearing the 6.10% peak during October bond market tumult (which was the high since pre-GFC July 2008). Indicative of mounting stress in interest-rate hedging markets, MBS yields surged 31 bps this week to 5.95%. Ten-year Treasury yields jumped 23 bps this week to close Friday at 4.06%. The rates market now prices peak Fed funds of 5.43% at the November 1st FOMC meeting.
Thursday’s market action appeared important. Booming ADP and strong Service ISM – that followed earlier reports of strengthened housing, construction and auto sales – basically blew apart the thesis of imminent economic weakening. And with the consumer ready to travel and spend for the summer – and the Atlanta Fed’s GDPNow indicator back above 2% - third quarter growth could easily surprise to the upside. Moreover, ongoing strong wage gains and services pricing pressures threw cold water on the view of consumer inflation on a trajectory to return to the Fed’s 2% target.
There was market recognition Thursday that perhaps all bets are off. If 500 bps of Fed rate hikes (and $600bn of QT) haven’t meaningfully tightened financial conditions, slowed demand or reined in inflation, what might it take to get the job done?
Doug's weekly commentary is always a must read for me -- and this one is no exception. It was posted on his website just after midnight on Saturday morning -- and another link to it is here.
![]()
"I Don't Think We'll Ever Get to the 2024 Election", Colonel Douglas Macgregor (Ret.) Warns
Retired U.S. Army Colonel Douglas Macgregor joined Patrick Bet-David on his PDB Podcast for a lengthy discussion of Russia, Ukraine, the woke military, the Trump Tape, China, and much more.
However, one section in particular caught our attention.
Well, dear reader, I posted part of this 2 hour and 13 minute video in last Saturday's column, not knowing that there was far more to it than what was in the clip then. I haven't watched it all yet myself, but will certainly do so this weekend. Here's the 'Full Monty'. It was posted on the Zero Hedge website last Sunday -- and I thank Michael Coombs for pointing it out. Another link to it is here.
![]()
India to Host Shangai Cooperation Organization (SCO) Summit
India will virtually host this year’s SCO leaders’ summit on 4 July. This is the right format for it to be held in considering rising Sino-Indo tensions as of late that would make an in-person meeting between their heads of state mutually undesirable at this time, which was explained in this analysis here.
Accordingly, no breakthrough is expected since their unresolved border dispute greatly impedes the group’s ability to multilaterally cooperate on larger issues of shared interest, the same as it does for BRICS as well.
The likelihood that the divide between those two will remain in place for the foreseeable future means that it can no longer be ignored by observers from the Alt-Media Community (AMC) who’d hitherto been reluctant to discuss it out of fear that their words would weaken the SCO even more. This resulted in their followers getting unrealistically high hopes about the group’s potential after being kept in the dark about how serious these problems are, thus inevitably setting them up for deep disappointment.
Indian External Affairs Minister Dr. Subrahmanyam Jaishankar reminded everyone last week that relations with China will never return to normal so long as their border dispute remains unresolved, hence the reason to be pessimistic about the SCO accomplishing much from here on out. That’s not to imply that it has no purpose, but just to point out that the two most populous countries in the world don’t trust each other enough to unleash their group’s full potential due to this sensitive issue.
Instead of playing blame games like many in the AMC tend to do, especially when it comes to aggressively pushing their false claim that India is the U.S.’ Trojan Horse inside multipolar organizations, everyone should simply incorporate this dynamic into their calculations about the SCO’s future. Iran’s formal membership and the recent granting of dialogue partner status to some Gulf Kingdoms proves that the group continues growing as a wider range of countries become interested in its activities.
This commentary, if you have the interest, was posted on the globalresearch.com Internet site on Monday -- and for content reasons thought it best to wait until today to post it. I thank Roy Stephens for sharing it with us -- and another link to it is here. Pepe Escobar's very long essay on this event is headlined "Golden Ruble 3.0 - The SCO Welcomes a New 'Global Globe'" -- and it was posted on the Zero Hedge website at 11:40 p.m. on Friday night. It's linked here.
![]()
Oil Futures Market Finally Signals Supply Tightening
Following the latest announcements of fresh supply cuts from OPEC+ leaders Saudi Arabia and Russia, key spreads in the oil derivatives markets have started to show strength, according to Bloomberg’s estimates.
Prompt spreads in the futures market have returned to backwardation, from contango.
Contango is the state of the market in which prices for delivery at later dates are higher than front-month prices - a market situation signaling oversupply.
The opposite market situation - backwardation - typically occurs at times of market deficit, and in it, prices for front-month contracts are higher than the ones further out in time.
Last week, the six-month spread in Brent flipped to contango for the first time since December 2022, after being in backwardation for months. The U.S. benchmark, WTI Crude, also dropped into contango on June 27, for the first time since March.
But in recent days, prompt spreads have strengthened, swaps contracts linked with physical supply have surged, and in options markets, the premium of bearish puts over bullish calls has narrowed.
This rather brief 2-chart Zero Hedgestory from the OilPrice.com Internet site was posted on their website at 10:20 a.m. on Friday morning EDT -- and I thank Brad Robertson for sending it along. Another link to it is here. Gregory Mannarino's post market close commentary for yesterday is linked here -- and lasts for about 17 minutes.
![]()
China boosts gold reserves for eighth month
China added to its gold reserves for an eighth consecutive month, with economic and geopolitical risks as well as a desire to move away from the U.S. dollar driving the purchases.
People’s Bank of China (PBOC) holdings of bullion rose by 680,000 troy ounces last month, according to official data released on Friday (Jul 7). That’s equivalent to 23 tons. Total stockpiles now sit at 2,330 tons, with around 183 tons added in the run of buying from November.
China has been an enthusiastic buyer of gold, partly due to its desire to chip away at the dominance of the US dollar in global market. It’s also struggling with a disappointing recovery from the pandemic, and an increasingly strained relationship with the U.S.
Central banks around the world bought a record amount of gold last year – accounting for nearly a quarter of global demand – as inflation accelerated and monetary policy tightened. While purchases eased in the first quarter of 2023, some 24 per cent of monetary authorities intend increasing holdings over the next 12 months, according to a World Gold Council survey published in May.
The PBOC’s buying spree that began in November is the longest since a 10-month run that ended in September 2019. Prior to that, the last wave of inflows ended in late 2016.
This Bloomberg story Friday afternoon was posted in the clear on the businesstimes.com.sg website -- and I found it embedded in a GATA dispatch. Another link to it is here.
![]()
Perth Mint gold bullion sales hold firm as prices slide
The Perth Mint sold 73,124 oz. of gold and 1,326,011 oz. of silver in minted product form during June.
General Manager Minted Products, Neil Vance said: “Gold’s steady price slide over the month of June presented a buying opportunity for our clients, resulting in a 0.3% increase in sales over the previous month. The current strength of interest was reflected in the fact that ounces sold were 12% ahead of June 2022. The picture was different in silver where Australian coin sales dropped 30% from May, primarily the result of significantly quieter U.S. market conditions facing all major suppliers.”
This 3-chart story showed up on the perthmint.com Internet site on their Friday -- and I found it on Sharps Pixley. Another link to it is here.
![]()
Italian discovery of Ancient Roman gold coins worth millions found in Cressoni Theatre
In an unexpected find, labourers sent to repair the basement of the Cressoni Theatre in Como, Italy, stumbled across an ancient pot laden with hundreds of gold coins. The Italian discovery put a halt to the repair work as crews set out to uncover further historical treasure.
The workers who initially embarked on repairing the basement floor of Como’s Cressoni Theatre were stunned at their discovery of a pot with a crack revealing an interior glistening with gold. A detailed examination revealed hundreds of gold coins remarkably preserved.
Following the Italian discovery, the labourers reported their find, and the Roman-era treasure was carefully relocated for a more thorough examination and preservation at a museum. Italy’s Ministry of Cultural Heritage revealed that the gold coins date back to the last Roman emperors, around the 5th century.
While the exact number and the total value of the coins remain undisclosed, Italian media speculates that they may be worth several million dollars, reported Sanook.
Cressoni Theatre in Como was inaugurated in 1870, later converted into a cinema and finally shut down in 1997. Authorities had permitted the demolition of the building to make room for luxury residences before the historical discovery was made. However, the Italian discovery of the “pot of gold” prompted the Italian government to delay construction to accommodate a more comprehensive archaeological excavation in case more hidden treasures lay beneath.
This interesting article put in an appearance on thethaiger.com Internet site on Friday -- and is another story that I found on the Sharps Pixley website. Another link to it is here. A somewhat related story, also from Sharps Pixley, is headlined "Tombs rich in artifacts discovered by Swedish expedition in Cyprus" -- and linked here.
![]()
The Photos and the Funnies
Still in Hope on October 9 -- and the first three shots show part of the 40th anniversary celebrations of the Rambo series of movies, the first one of which...'First Blood'...was shot in and around the town back in 1982. The wood carvings of Sylvester Stallone and Brian Dennehy still grace Hope's central park but, thankfully, the tank is long gone. On our way out of town we made a brief stop at Kawkawa Lake to photograph the wonderful fall colours. Click to enlarge."


![]()
The WRAP
"Understand this. Things are now in motion that cannot be undone." -- Gandalf the White
![]()
Today's pop 'blast from the past' dates is now 45 years young -- and I'm still trying to figure out where all that time went, as are you, I'm sure. It ranks as No. 2 on this Swedish group's list of greatest hits. This tune, along with the rest of their recordings, just never seems to grow old. It should be instantly recognizable -- and the link is here. There's a bass cover to this, of course -- and that's linked here.
Today's classical 'blast from the past' is Johann Hummel's Piano Concerto No. 3 in B minor, Op. 89 which he composed in Vienna in 1819. It was written as a showcase for his virtuosity at the instrument. Up until fairly recently, Hummel was only know for his trumpet concerto, but a recording by British pianist Stephen Hough [one of only 20 living polymaths] from about thirty-five years ago changed all that -- and his second and third piano concertos are at last getting some well-deserved 'air time' in the concert halls of the world.
There's no video on youtube.com of this played live and in concert, so I had to settle for the audio recording by Hough himself. Here is with the English Chamber Orchestra -- and Bryden Thomson conducts. It's enchanting -- and the link is here.
![]()
I must admit that I was expecting the precious metals and other commodities to get bombed on yesterday's jobs report, regardless of what then numbers were. But that obviously didn't happen.
But what was crystal clear was the fact that the DXY would have been crushed even more if the usual 'gentle hands' hadn't appeared at 8:30 a.m. in New York to save it. And despite its continuing decline after that, the commercial traders of whatever stripe stepped in at the 11 a.m. EDT London/Zurich closes in all four precious metals and capped their rallies. All were closed off their respective high ticks. This was price management writ large.
I suspect that Friday's rallies in the precious metals had more to do with paper positioning than it had to do with anything that was in the jobs report. But regardless of their gains yesterday, this changes little...if anything at all...from a COMEX futures market perspective in all four since the Tuesday cut-off for next Friday's Commitment of Traders Report.
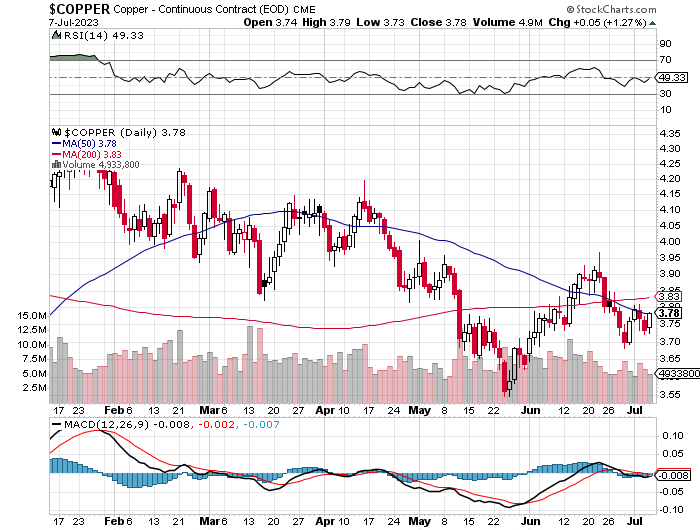
Copper closed higher by a nickel at $3.78/pound -- and right on its 50-day moving average...with its 200-day a nickel above that.
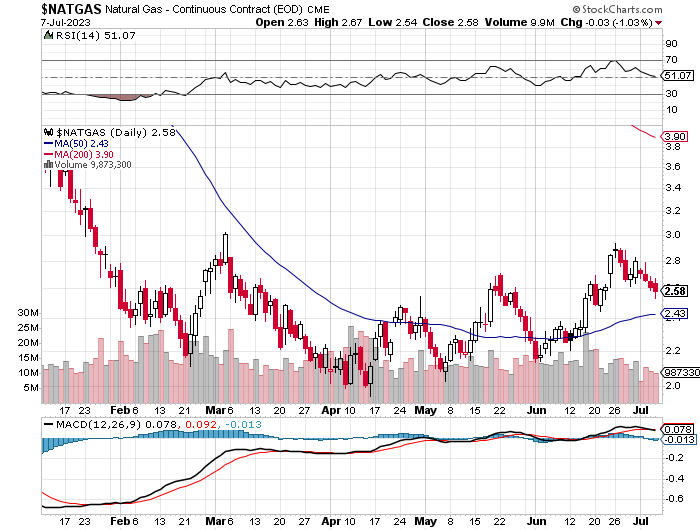
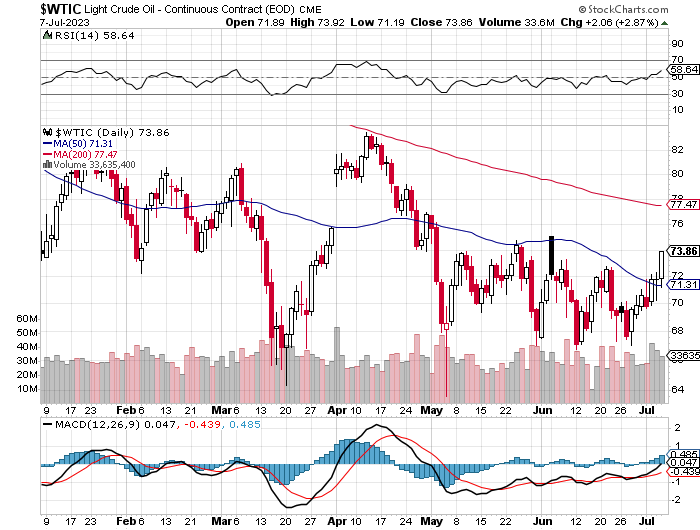
Natural gas [chart included] was the only one of the Big 6+1 commodities that closed down on that day...it by 3 cents, as it finished the Friday trading session at $2.58/1,000 cubic feet. WTIC had another big up day, which is not a surprise considering the supply/demand fundamentals. It's now sitting half-way between its 50 and 200-day moving averages, as it closed higher by $2.06 at $73.86/barrel.
Here are the 6-month charts for the Big 6+1 commodities, thanks to stockcharts.com as usual and, if interested, their closing prices in their current front months should be noted. Click to enlarge.
Looking around at the general economic state of the world -- and the U.S in particular, the fall in the DXY -- and the 10-year now over 4%...didn't make Mr. Market very happy. All the major indexes in the U.S. closed on their lows of the day on Friday -- and we'll have to see if the Fed/PPT will attempt to set things 'right' starting on Monday.
In the rest of the world, the economic outlook is just as bad, if not worse -- and this is particularly true of what's been unfolding in China lately. The financial rot inside their country is growing more grave with each passing month. There have been numerous stories about this of late, several of which have appeared in this column this past week -- and it's something that Doug Noland has been going on about for a very long time. He did so again in today's commentary as well. There was a Bloomberg/ZH story on Friday about this headlined "A Case For a Bailout as $13 Trillion Chinese Local Debt Looms" -- and linked here.
Then there's the Russia/Ukraine thingy. There are no signs that either side is going to back down -- and NATO has raised the stakes with the U.S. saying "OK" to the widely condemned cluster bomb use in the conflict. But deep behind the scenes there appear to be negotiations going on in an attempt to end this war -- and that story appeared on the antiwar.com Internet site...is headlined "Former Senior U.S. Officials Held Secret Talks With Russians" -- and linked here. But not to be forgotten is that the first casualty of war is the truth. So the war drags on -- and will certainly become far more intense before its final resolution.
![]()
Not a lot appeared to have changed in the precious metals world since last Saturday's column...at least on the surface.
The manic in/out activity in COMEX silver continues unabated -- and as Ted Butler mentions frequently, this has been going on for 12 years now. However, the wholesale demand for physical silver in good delivery form rose to a whole new level during the last ten days -- and I'm sure that most of it had to do with July silver deliveries, as what silver there was on the COMEX wasn't available for sale -- and new silver had to be brought in.
On top of that, there have been just about 5 million troy ounces of silver removed from SLV over the last two weeks as well. Looking at the price action in silver over that time period, I'm sure that was mostly because that it was more desperately needed elsewhere -- and had little if anything to do with 'plain vanilla' retail or institutional investor selling.
All the signs are, according to Ted, is that the COMEX and SLV are virtually out of silver that can be readily withdrawn...which is more proof, if more is needed, that the ongoing silver supply/demand crunch is now starting to bite hard.
The set-up for a major price rally in silver...Ted's big one?...is there in spades from a COMEX futures market perspective -- and has been for some time. It improved even more in this week's COT Report.
However, the same can't be said of gold, as it remains bearish. And how, as I pointed out further up, this resolves itself remains to be seen. But, as Ted also says, at some point the positioning in the COMEX future market just won't matter. As always, that decision remains in the hands of the big U.S. bullion banks shorts in silver, gold and platinum. I would also suspect that the Fed and U.S. Treasury will have their say in this as well.
And as this price management scheme in the precious metals in particular, along with a whole host of other commodities, enters its final phase...I'm quite content to be still "all in" -- and will remain that way to whatever end.
I'm done for the day -- and the week -- and I'll see you here on Tuesday.
Ed
About the author

SUBSCRIBE: https://edsteergoldsilver.com/

Ed Steer’s Daily Analysis of the Gold and Silver Markets
After eight years of writing about the precious metals for Casey Research, the folks at Stansberry & Associates—who just recently purchased controlling interest in the company—decided that my ‘niche market’ column didn’t fit into their plans.
Since the time that Casey Research was kind enough to offer me a stand-alone column, it became their most highly-rated blog almost from the outset—and has remained that way up to this date...