The world doesn’t realize it, but record global silver coin demand is warning that big trouble is coming to the financial system. More investors are waking up to the fact that there is something seriously wrong with the financial industry and broader stock markets and are buying more physical gold and silver than ever.
This is especially true for silver. During the huge surge in physical silver investment demand from June to September this year, I heard from several dealers that investors were buying a lot more silver than gold. And this wasn’t just from the typical Mom & Pop buyers… there were large silver volume purchases from wealthy clients.
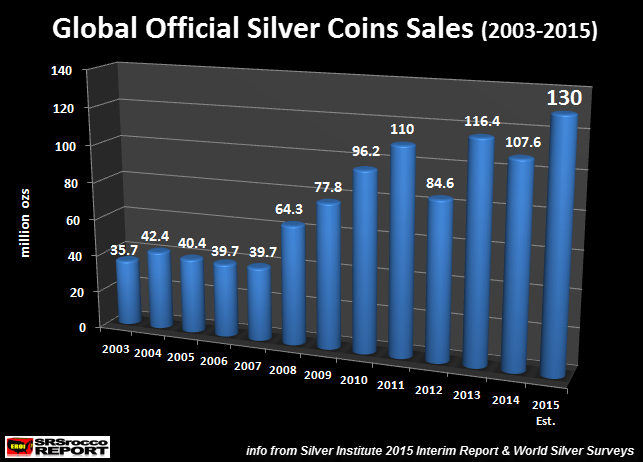
According to the Silver Institute 2015 Interim Report, total sales of official silver coins will reach 130 million oz (Moz) this year. If we look at the chart below, we can see the huge increase in official coin sales since the first collapse of the U.S. Investment Banking and Housing Industry in 2008:
Global Official Silver Coin sales ranged between 35.7 Moz and 42.4 Moz from 2003 to 2007. However, demand surged to 64.3 Moz during the 2008 financial crisis and continued to increase to 110 Moz in 2011 when the price of silver peaked at $49. Then in 2012, as investors were unsure of the silver price trend, Official coin sales declined to 84.6 Moz that year.
Well, this all changed in 2013 as the price of silver fell from $30 down to $18 in just six months, motivating investors to purchase a record 116.4 Moz of official silver coins. Even though demand fell modestly in 2014, official silver coin sales are forecasted to hit a record 130 Moz this year.
Royal Canadian Mint Silver Maple Leaf Sales Hit Record Q1-Q3 2015
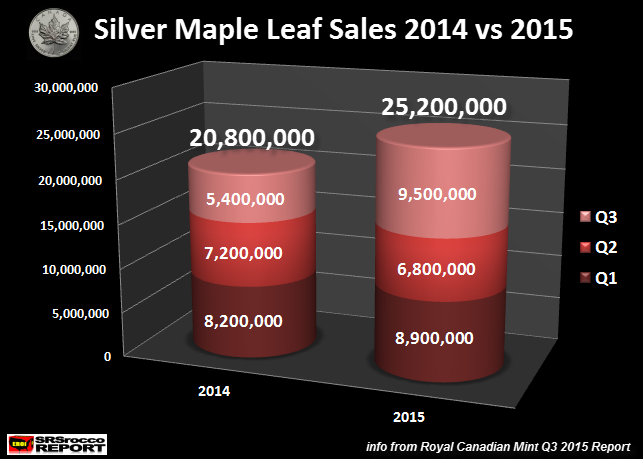
The Royal Canadian Mint just released their newest Q3 Report showing a huge increase in Silver Maple sales to 9.5 Moz, up 76% compared to 5.4 Moz during the same period last year:
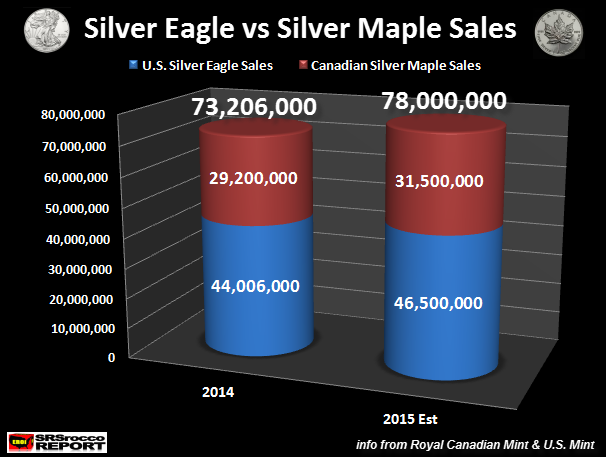
Total Silver Maple sales Q1-Q3 are 25.2 Moz versus 20.8 Moz last year… up 21%. Here is my forecast for total 2015 Silver Eagle and Maple sales:
As we can see, Silver Eagle and Maple Leaf sales are estimated to reach 78 Moz compared to 73.2 Moz last year. This is one hell of a lot of 1 oz silver coins from just these two mints. Furthermore, total sales of Silver Eagles and Maples were only 9.5 Moz in 2005. In just ten years, sales from these two official coins have increased more than 8 times.
Gresham’s Law: Bad Money Drives Out Good… Official Silver Coins
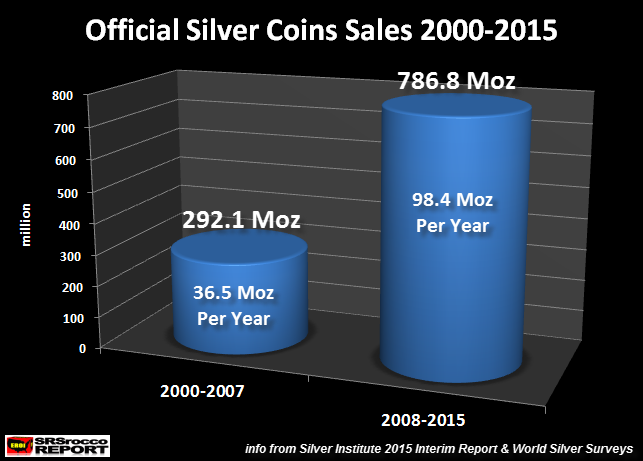
If we take the global official silver coin data from the first chart above, and divide it into two periods, we have the following result:
Before the first collapse of the U.S. financial industry and economy in 2008, total global official silver coin sales for the period 2000-2007 were 292.1 Moz. Now compare this figure to the second period from 2008 to 2015 at 786.8 Moz. If we average the annual global silver coin sales, the first period (2000-2007) shows an average of 36.1 Moz per year versus 98.4 Moz after the U.S. financial and economic meltdown (2008-2015).
This huge surge in official silver coin demand represents a percentage of investors who have decided to exchange increasing worthless paper currency for sound money. This trend started in the 1960’s when the United States sold off the majority of its huge silver stockpiles and removed silver from its coinage.
I am working on THE SILVER MARKET REPORT using figures and information starting in the 1960’s. Investors need to understand the trend change in the silver market has been going on for more than 50 years. Understanding this ongoing silver market trend is important for investors who want to protect their wealth when the next major financial crash occurs.
Even though the forecasted 130 Moz of Official Silver Coin Sales did not translate into higher silver prices, it did hammer a few more nails into the Greatest Financial Ponzi Scheme in history. That’s how investors need to look at the silver market. I realize it’s frustrating to see that record buying of silver coins does not seem to impact price.
However, investors need to understand that Greatest Financial Ponzi Scheme in history can only survive if global oil production continues to increase. Unfortunately, we are about experience a peak and decline of global oil production shortly starting first with the collapse of the U.S. shale oil industry.
I will be writing more articles explaining the connection between skyrocketing debt and rising oil production. One can not take place without the other. Which means, when the massive amount of global debt finally collapses, it will take down world oil production with it.
Some of the safest assets to own at this time will be physical gold and silver.
Please check back for new articles and updates at the SRSrocco Report. You can also follow us at Twitter below:


