Rising physical silver investment demand will put a record squeeze on North American supply this year. Since 2001, the United States and Canada have experience two opposite trends… surging official silver coins sales on the back of plummeting domestic mine supply.
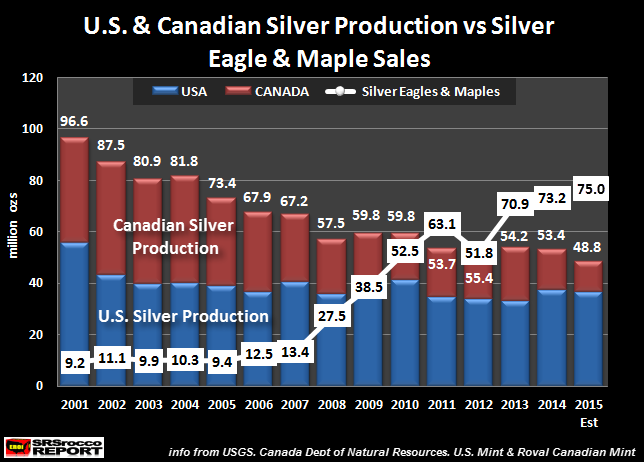
For example, in 2001 U.S. and Canadian silver production totaled 96.6 million oz (Moz). Of that total, the U.S. produced 55.9 Moz, while Canada supplied 40.7 Moz. That year, Silver Eagle and Maple Leaf sales totaled 9.2 Moz.
Note: the red and blue bars represent Canadian and U.S. silver mine supply, while the white line and boxes show the total sales of U.S. Mint Silver Eagles and the Royal Canadian Mint Silver Maples.
Even though U.S. and Canadian silver production declined significantly to 67.2 Moz by 2007, total Silver Eagle and Maple Leaf sales only increased slightly to 13.4 Moz that year. Which means the U.S. and Canada still enjoyed a net 53.8 Moz domestic silver mine supply surplus after their official coin sales were deducted.
However, during the collapse of the U.S. Housing Market and Investment Banking System in 2008, Silver Eagle and Maple Leaf sales surged to 27.5 Moz while the combined silver production from the U.S. and Canada fell to 57.5 Moz. This pushed the combined domestic mine supply surplus from these two countries down to only 30 Moz once consumption for official silver coins were removed.
This trend counter-trend continued (except for a brief reversal in 2012) until it hit a record net deficit of 19.8 Moz in 2014. This supply deficit is a result of record sales of Silver Eagles and Maples of 73.2 Moz compared to 53.4 Moz combined silver production.
While it’s true the U.S. and Canada imports silver for industrial fabrication, jewelry, silverware and investment demand, this amount has increased significantly due to falling domestic mine supply. Let’s compare the net change since 2001:
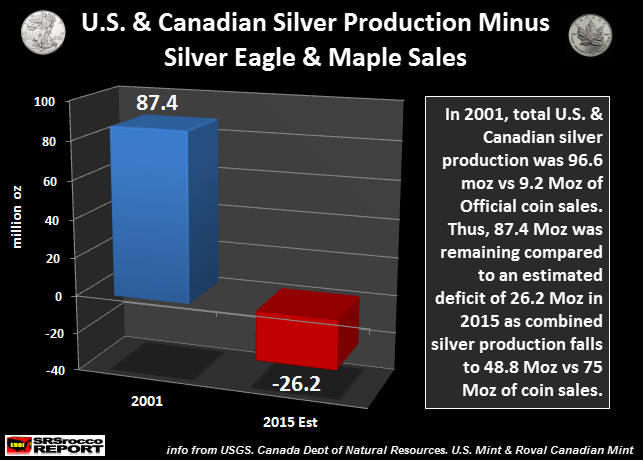
If we look at the chart above, we can see that the surplus of U.S. and Canadian silver mine supply minus consumption of their official silver coin sales was 87.4 Moz. However, this is estimated to be a net deficit of 26.2 Moz in 2015 as total Silver Eagle and Maple Leaf sales reach a record 75 Moz versus combined mine supply of 48.8 Moz.
The significance here is that the United States and Canada could use 87.4 Moz of their domestic mine supply (minus official coin consumption) for industrial, jewelry and silver ware fabrication, whereas now they have to import silver just to cover the consumption for their official coin production.
That being said, there continues to be this rumor that the U.S. Mint must use domestic silver mine supply for the production of its Silver Eagles. This used to be true when Congress authorized the U.S. Mint to use up the silver in its Strategic Stockpiles. However, after these inventories were depleted, Congress authorized the U.S. Mint to purchase silver on the open market for the production of its Silver Eagles.
Furthermore, commonsense tells us that at the estimated 37 Moz of U.S. domestic mine supply could not meet the total demand of 45 Moz of Silver Eagles this year.
Regardless, the charts in this article show just how much the surge of Silver Eagle and Maple Leaf sales have totally overwhelmed domestic silver mine supply from these two countries. While silver is still relatively cheap and abundant, there will come a time where silver producing countries such as Mexico and Peru will hold onto more of their mine supply for their own citizens.
Precious metal investors and especially the ignorant public have no clue just how little silver there is to go around when its true STORE OF WEALTH properties are realized.
Lastly, the first chart in this article was an updated chart found in my THE SILVER CHART REPORT. I am currently working on THE SILVER MARKET REPORT that will focus on the silver market going all the way back until the 1950’s.
Please check back for new articles and updates at the SRSrocco Report. You can also follow us at Twitter below:


