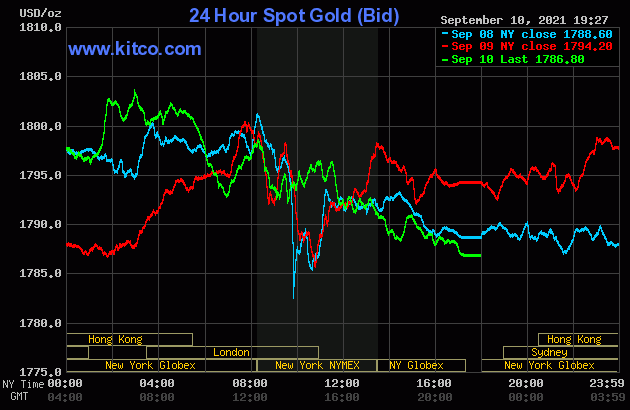
The gold price began to struggle higher starting minutes after 10 a.m. China Standard Time on their Friday morning -- and that rally attempt was capped and turned lower minutes before 2 p.m. CST -- and for the final time at the London open. It was then stair-stepped somewhat unevenly lower until the market closed at 5:00 p.m. in New York...with the rally starting at the noon silver fix in London, running into "all the usual suspects" at the COMEX open.
The high and low ticks in gold were recorded by the CME Group as $1,803.70 and $1,786.50 in the October contract -- and $1,806.00 and $1,788.20 in December. The October/December price spread differential in gold at the close yesterday was $2.20...December/February was $2.10 -- and February/April was $1.70 an ounce.
Gold was closed on Friday afternoon in New York at $1,786.80 spot, down $7.40 on the day -- and also on its low tick. Net volume was ultra light at a hair over 129,000 contracts -- and there was about 7,900 contracts worth of roll-over/switch volume on top of that.
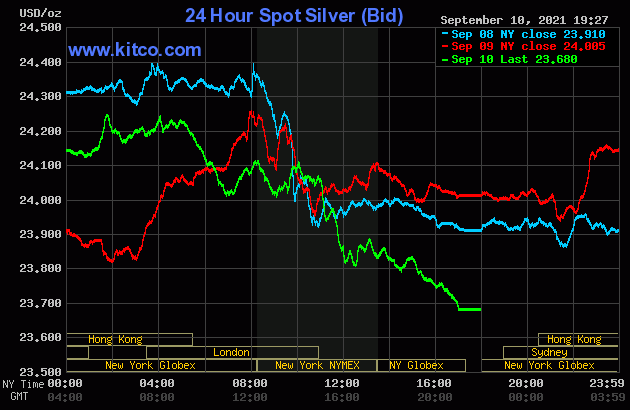
Silver's high tick was printed around 1:50 p.m. CST on their Friday afternoon -- and the price pressure after that began in earnest around 10 a.m. in London. That uneven engineered price decline also lasted until trading ended at 5:00 p.m. in New York.
The high and low ticks in silver were reported as $24.345 and $23.76 in the December contract. The September/December price spread differential in silver at the close yesterday was 4.5 cents...December/March was 4.9 cents -- and March/May was 3.1 cents an ounce.
Silver was closed in New York on Friday afternoon at $23.68 spot, down 32.5 cents from Thursday -- and also on its low tick of the day. Net volume was exceedingly light at a bit under 38,500 contracts -- and there was only about 1,120 contracts worth of roll-over/switch volume in this precious metal.
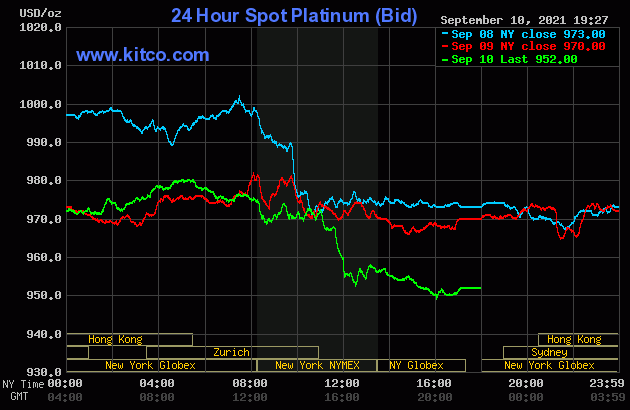
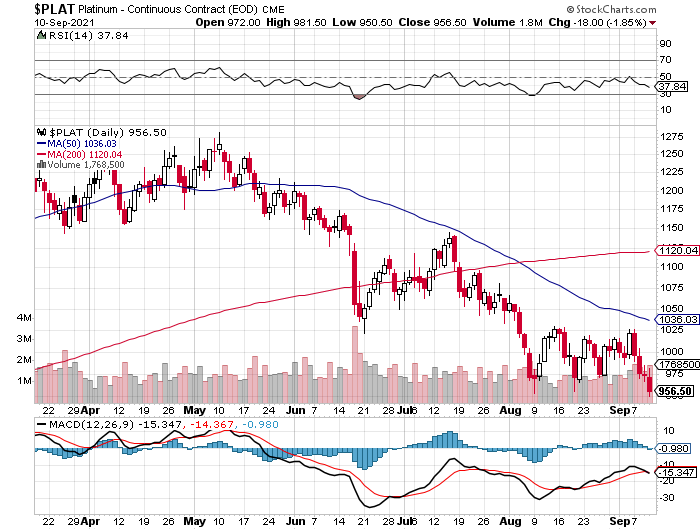
The platinum price dipped a bit in morning trading in the Far East on their Friday -- and then crawled a bit higher until selling pressure appeared in it around 11:30 a.m. in Zurich. From that juncture it was stair-stepped lower in price until 4 p.m. in after-hours trading in New York...with the biggest step down coming after the 11 a.m. EDT Zurich close. It didn't do a lot after that. Platinum was closed on Friday afternoon in New York at $952 spot, down another 18 dollars on the day.
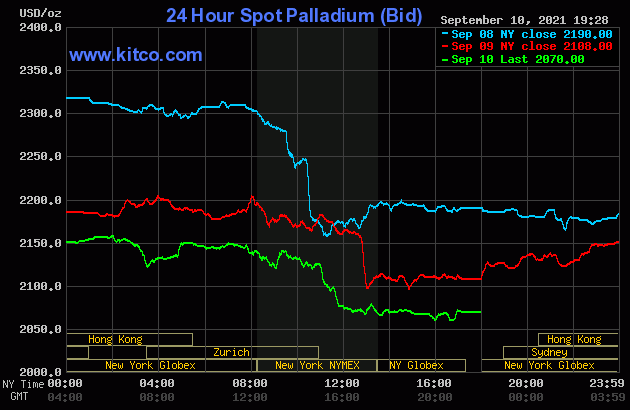
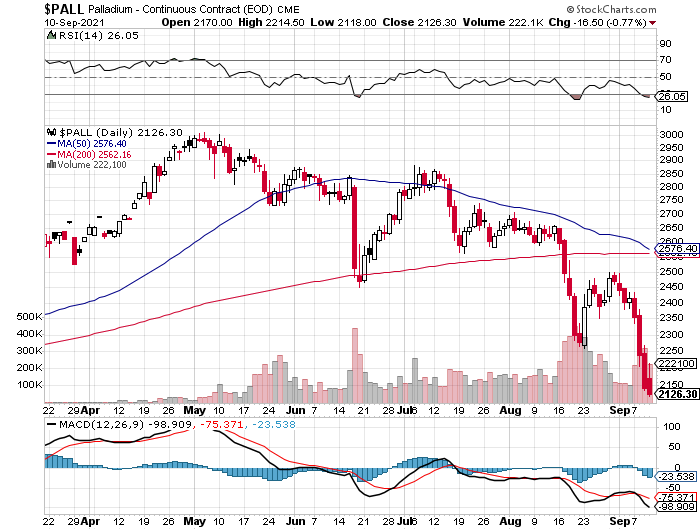
The palladium price crept higher until around 2 p.m. China Standard Time on their Friday afternoon. Then, after a down/up dip centered around 9:30 a.m. in Zurich, the serious price pressure began around 1 p.m. CEST. That continued until the 1:30 p.m. COMEX close -- and it didn't do much of anything after that until trading ended at 5:00 p.m. in New York. Palladium was closed lower yet again, this time by 38 bucks the ounce at $2,070 spot.
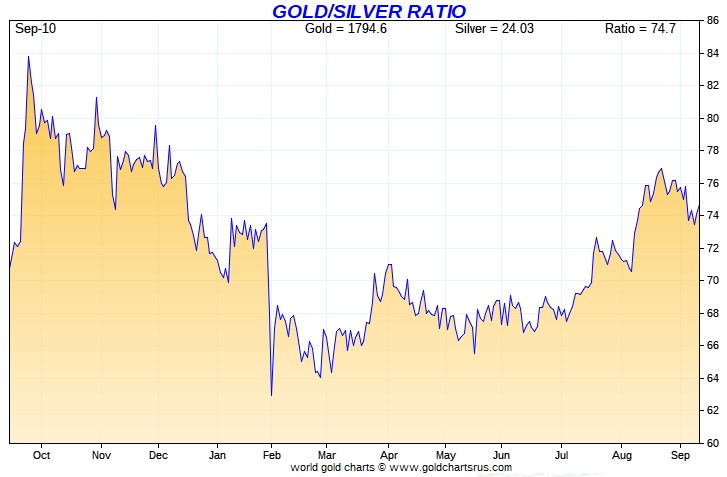
Based on the kitco.com spot closing prices in silver and gold posted above, the gold/silver ratio worked out to 75.5 to 1 on Friday...compared to 74.8 to 1 on Thursday.
And here's Nick's 1-year Gold/Silver Ratio chart, updated with the last five days of data. Click to enlarge.
![]()
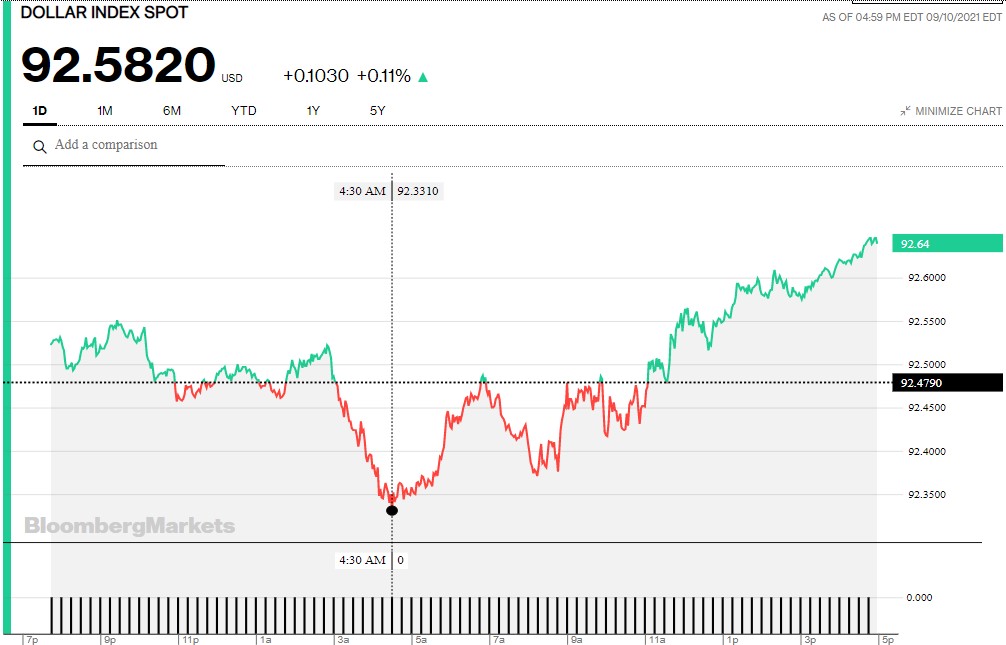
The dollar index closed very late on Thursday afternoon in New York at 92.479 -- and opened higher by about 4.5 basis points once trading commenced around 7:45 p.m. EDT on Thursday evening, which was 7:45 a.m. China Standard Time on their Friday morning. It then wandered very quietly sideways until 10 minutes before the London open. It then headed rather sharply lower until it appeared to get saved at 9:30 a.m. BST. The ensuing 'rally' lasted right until the 5:00 p.m. close in New York.
The dollar index finished the Friday trading session in New York at 92.582...up just about 10.5 basis points from Thursday -- and about 6 basis points below its indicated spot close on the DXY chart below.
Here's the DXY chart for Friday, thanks to Bloomberg as always -- and the above-mentioned discrepancy should be noted. Click to enlarge.
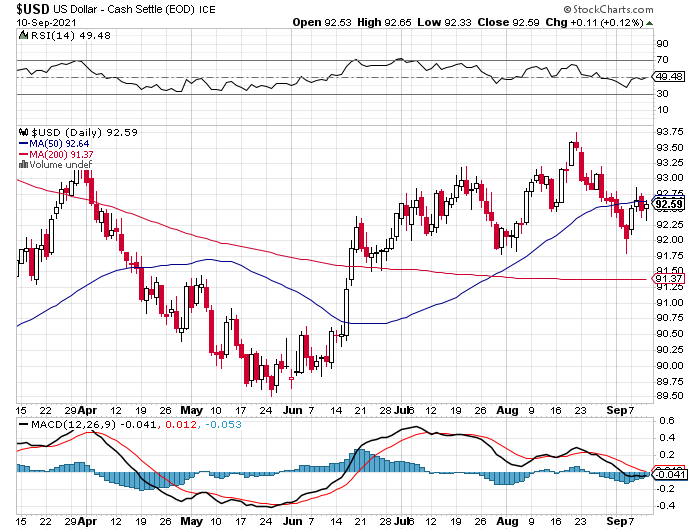
Normally I'd have the 5-year U.S. dollar index chart in this spot in my Saturday column, but for whatever reason, I wasn't able to download it or any other yearly chart from the stockcharts.com Internet site, so I'm stuck with the usual 6-month chart. The delta between its close...92.59...and the close on the DXY chart above, was less than 1 basis point above its spot close on the DXY chart above. Click to enlarge as well.
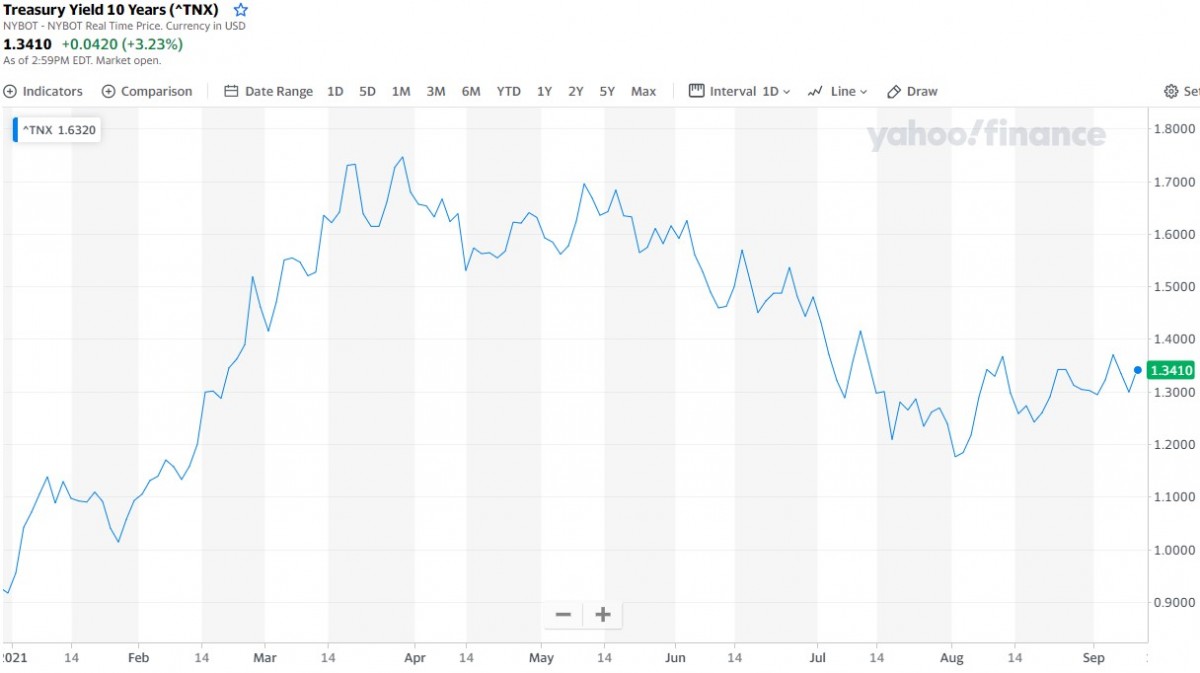
U.S. 10-Year Treasury: 1.3410%...up 0.0420 (+3.23%)...as of 2:59 p.m. EDT.
Here's the one-year 10-year U.S. Treasury chart, courtesy of finance.yahoo.com as always -- and as I keep pointing out, you can see where the Fed began yield curve control in March. But it should also be noted that the trend line changed to a bit of an upward bias starting at the beginning of August. Click to enlarge.
![]()
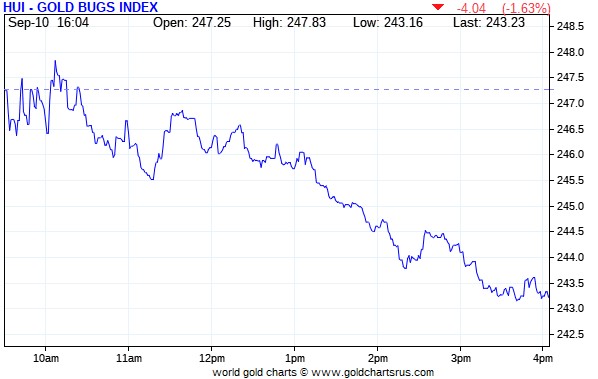
The gold stocks opened down a hair, then rallied a hair above unchanged by minutes after 10 a.m. in New York trading -- and then began a quiet and a bit choppy descent until around 3:45 p.m. EDT. It then traded flat until the markets closed at 4:00 p.m. The HUI closed down 1.63 percent.
The trading pattern for the silver equities was very similar to the gold shares, except they hung in their pretty good until around 12:15 p.m. EDT -- and from that juncture they followed the same path as their golden brethren for the remainder of the New York trading session. Nick Laird's Intraday Silver Sentiment/Silver 7 Index closed lower by 1.32 percent. Click to enlarge if necessary.
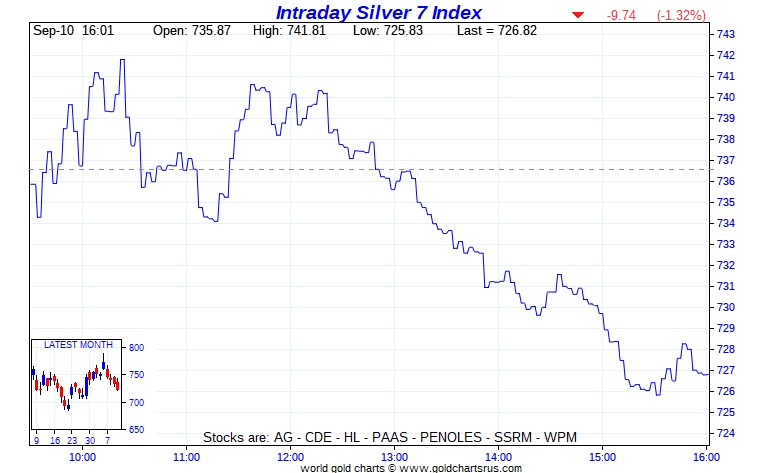
Computed manually, the above index closed down 1.49 percent.
And here's Nick's 3-year Silver Sentiment/Silver 7 Index chart, updated with Friday's candle. Click to enlarge as well.
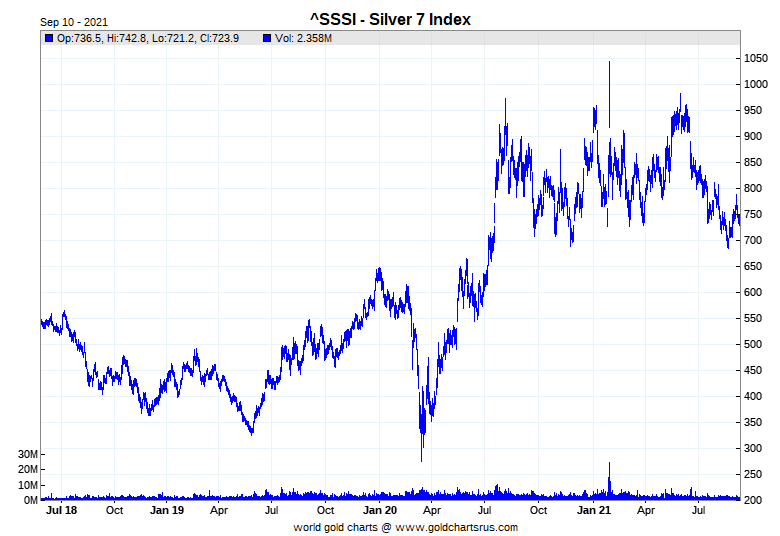
There were no real stars -- and the biggest dog was SSR Mining once again, closing down 2.96 percent.
Here's some more silver eye candy from the reddit.com/Wallstreetsilver crowd -- and that's linked here. As always, just keep scrolling down until you get tired of looking...
![]()
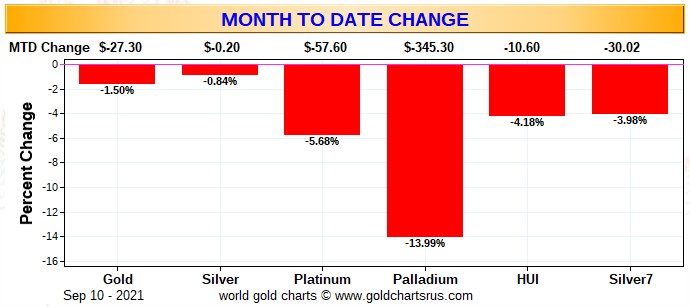
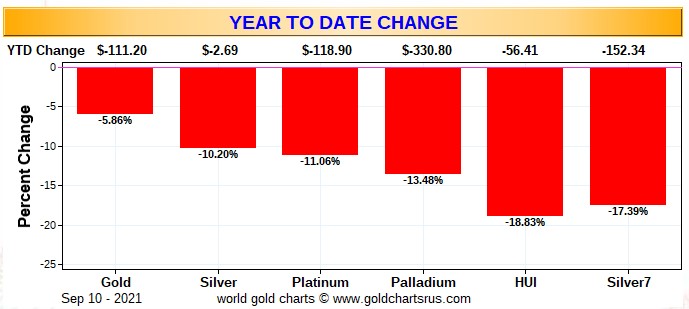
Here are two of the three usual charts that show up in every Saturday missive. They show the changes in gold, silver, platinum and palladium in both percent and dollar and cents terms, as of their Friday closes in New York — along with the changes in the HUI and the Silver 7 Index.
There's no weekly chart, because the past week only had four business days -- and because of the way Nick's program is set up to compute these values, it records the last five consecutive business days, which would include the data from Friday, September 3. That fact renders the weekly chart rather meaningless -- and is why I haven't included it. It will be back next week.
Here's the month-to-date chart -- and the stand-out feature is the ongoing price pounding in palladium. Gold and silver, including their associated equities, have underperformed by about the same amount since September 1. Click to enlarge.
Here's the year-to-date chart -- and it's butt-ass ugly...wall-to-wall red...courtesy of the Big 4/8 shorts. And as I've pointed out before, the underperformance of the HUI compared to price decline in the underlying metal is in stark contrast to the 'outperformance' of the Silver 7 vs. the underperformance of silver itself. Click to enlarge.
As Ted Butler has mentioned on many occasions, the short positions of the Big 8 traders in general -- and the Big 4 short commercial traders/banks in particular, are the sole reason that precious metal prices aren't at the moon already, as just about every other group of traders in the COMEX futures market are net long against them in all four precious metals...which includes all the rest of the traders in their respective commercial categories.
But for the last four weeks in a row, ever since their August 9 engineered price lows, the short positions of the Big 4 traders has been sneaking quietly higher, which Ted is not amused about.
In the COT discussion further down, the commercial net short positions in silver increased for the fourth week in a row, but was mainly due to the small traders selling long positions for a profit. The short position in gold increased as well.
But as far as the Big 8 traders in silver is concerned, they've made no move whatsoever to reduce their monstrous short position -- and the same can be said of the Big 4/8 traders in gold as well.
The CME Daily Delivery Report showed that zero gold and 6 silver contracts were posted for delivery within the COMEX-approved depositories on Tuesday.
In silver, the sole short/issuer was ADM out of its client account. JPMorgan stopped 3 of them for their client account as well -- and Wells Fargo Securities picked up 2 contracts for its house account.
In platinum, there were another 71 contracts issued and stopped.
The link to yesterday's Issuers and Stoppers Report is here.
So far in September, there have been 1,053 gold contracts issued/reissued and stopped -- and that number in silver is 5,217 contracts. In platinum, there have been 126 contracts issued and stopped so far this month -- and in palladium there have been 154 COMEX contracts issued and stopped.
The CME Preliminary Report for the Friday trading session showed that gold open interest in September declined by 2 contracts, leaving 149 still open. Thursday's Daily Delivery Report showed that 2 gold contracts are actually posted for delivery on Monday, so the change in open interest and deliveries match for once. Total silver o.i. dropped by 36 contracts, leaving 297 contracts still around, minus the 6 contracts mentioned a few paragraphs ago. Thursday's Daily Delivery Report showed that 37 silver contracts were actually posted for delivery on Monday, so that means that 37-36=1 more silver contract was added to the September delivery month.
Total gold open interest at the close yesterday fell by 532 COMEX contracts -- and total silver o.i. actually rose by 793 contracts...most likely because of more short positions being added than long positions being sold.
There were no reported changes in GLD yesterday. But an authorized participant removed 2,130,251 troy ounces of silver from SLV.
The new short report for both SLV and GLD were posted on The Wall Street Journal's website on Friday evening. The short position in silver jumped from 32.18 million shares/troy ounces, up to 38.13 million shares/troy ounces...and increase of 18.49 percent -- and I know that Ted won't be happy to see that. The short position in GLD also rose, from 1.027 million troy ounces, up to 1.204 million troy ounces...an increase of 17.24 percent.
In GLD, these numbers are neither excessive or worrisome...but that's not the case for the short position in SLV.
What it means in a nutshell is that the authorized participants have been shorting SLV shares in lieu of depositing physical metal as its prospectus demands. That amount of physical silver is either unavailable...or if it is, purchasing it would drive the silver price to the moon. I know that Ted will certainly have something to say about it in his weekly review for his paying subscribers this afternoon.
In other gold and silver ETFs and mutual funds on Planet Earth on Friday, net of any changes in COMEX, GLD & SLV inventories, there was a net 52,599 troy ounces of gold added -- and a net 178,335 troy ounces of silver was added as well.
There was a sales report from the U.S. Mint yesterday, as they sold 10,000 troy ounces of gold eagles...2,000 one-ounce 24K gold buffaloes -- and zero silver eagles.
Month-to-date the mint has sold 20,000 troy ounces of gold eagles -- 10,000 one-ounce 24K gold buffaloes -- and 750,000 silver eagles...producing a silver/gold sales ratio of 25 to 1.
There was a bit of activity in gold over at the COMEX-approved depositories on the U.S. east coast on Thursday. There was 64,812 troy ounces of gold received -- and every bar of that ended up at JPMorgan's 'Enhanced Delivery' sub-depository. There was also 12,036 troy ounces shipped out of that sub-depository as well. The remaining 'out' activity was 64.300 troy ounces/2 kilobars, that departed Brink's, Inc. There was a bit of paper activity, as 5,980.086 troy ounces/186 kilobars was transferred from the Registered category and back into Eligible over at Loomis International. The link to Thursday's COMEX gold activity is here.
It was certainly busier in silver, as 605,913 troy ounces, one truckload, was dropped off at CNT -- and that was all the 'in' activity there was. There was a total of 730,269 troy ounces shipped out -- and of that amount, there was 685,594 troy ounces that departed CNT as well. The remaining 44,674 troy ounces was shipped out of HSBC USA. There was no paper activity. The link to all of the above silver activity is here.
There was a fair amount of activity over at the COMEX-approved gold kilobar depositories in Hong Kong on their Thursday. They reported receiving 1,099 kilobars -- and shipped out shipped out 1,030 of them. Except for the 33 kilobars that arrived at Loomis International, the remaining in/out activity was at Brink's, Inc. as always. The link to this, in troy ounces, is here.
![]()
Here are the usual two 20-year charts that show up in this space almost every Saturday. They show the total amount of physical gold and silver in all know depositories, ETFs and mutual funds as of the close of business on Friday.
For the week just past, there was a net 164,000 troy ounces of gold added -- and in silver, there was a net 3,070,000 troy ounces removed -- and all of that silver came out of either SLV or the COMEX, as the rest of the world's ETFs and mutual funds showed a net increase for the week. Click to enlarge for both.
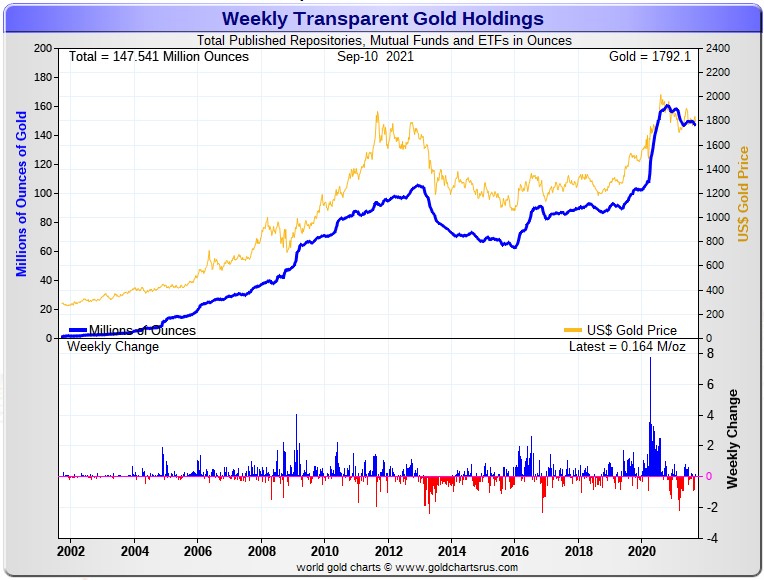
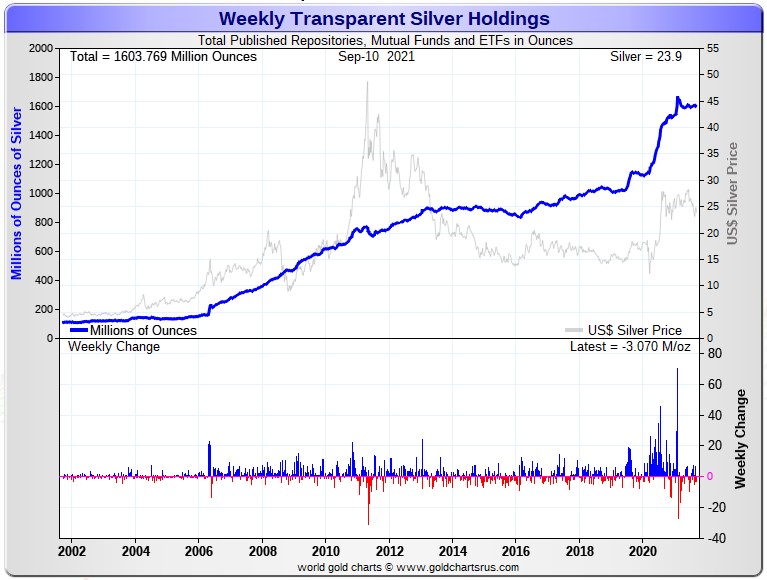
As I mention just about every week, looking at the above two charts, one would never know that eye-watering engineered price declines had ever occurred in silver and gold a month ago, as there's little if any sign of it.
And considering the price activity recently, the above charts continue to show how tightly held the physical precious metals are...especially silver -- and that's despite the punishment handed out by the Big 8 shorts over that time period.
These two precious metals are being held by the strongest of hands...including ours.
![]()
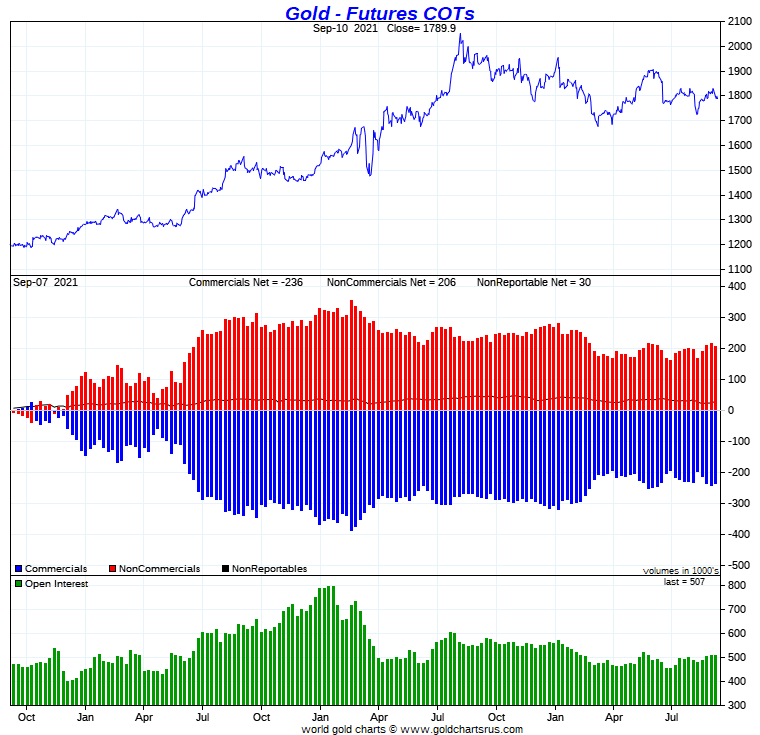
The Commitment of Traders Report for positions held at the close of trading on Tuesday came in mostly as I expected it would...an increase in the Commercial net short position in silver -- and a decrease in gold. It showed that the Commercial net short position in silver increased by 5,285 COMEX contracts -- and the commercial net short position in gold fell by 4,704 contracts.
In silver, the Commercial net short position rose by 5,285 COMEX contracts, or 26.4 million troy troy ounces. But the number isn't as bad as it looks, as the lion's share of that was the small commercial traders selling long positions, which has the mathematical effect of increasing the Commercial net short position -- and I'll get into that in a bit.
They arrived at that number by reducing their long position by 2,687 COMEX contracts -- and also increased their short position by 2,598 contracts -- and it's the sum of those two numbers that represents their change for the reporting week.
Under the hood in the Disaggregated COT Report it was mostly Managed Money traders that accounted for the change, as they increased their net long position by 5,503 COMEX contracts. The Other Reportables also increased their net long position during the reporting week, them by 722 contracts. The Nonreportable/small traders were net sellers, as they decreased their net long position by 940 contracts.
Doing the math: 5,503 plus 722 minus 940 equals 5,285 COMEX contracts, the change in the Commercial net short position.
The Commercial net short position now stands at 216.3 million troy ounces, up from the 189.8 million troy ounces they were short in last week's COT Report.
The Big 8 are short 318.0 million troy ounces, up 7.2 million troy ounces from the 310.8 million troy ounces that they were short in last week's COT Report. Ted said the most of this increased short selling involved the Big 4.
But the headline increase in the Commercial net short position above shows that it rose by 26.4 million troy ounces -- and the difference...26.4-7.2=19.2 million troy ounces...came from the sale of long positions by Ted's raptors, the small commercial traders other than the Big 8. And as I said before, their long selling [for a profit] has the mathematical effect of increasing the Commercial net short position...so all is not as bad as it looks.
The raptor selling in this week's COT Report, more than negates the 'surprise' 13.1 million troy ounces that they went long last week on a rising silver price.
From the numbers posted a few paragraphs ago, the Big 8 traders are short about 176 percent of the Commercial net short position...a new record high and a criminally obscene amount.
Here's the 3-year COT chart for silver, courtesy of Nick Laird as always -- and the change should be noted. Click to enlarge.
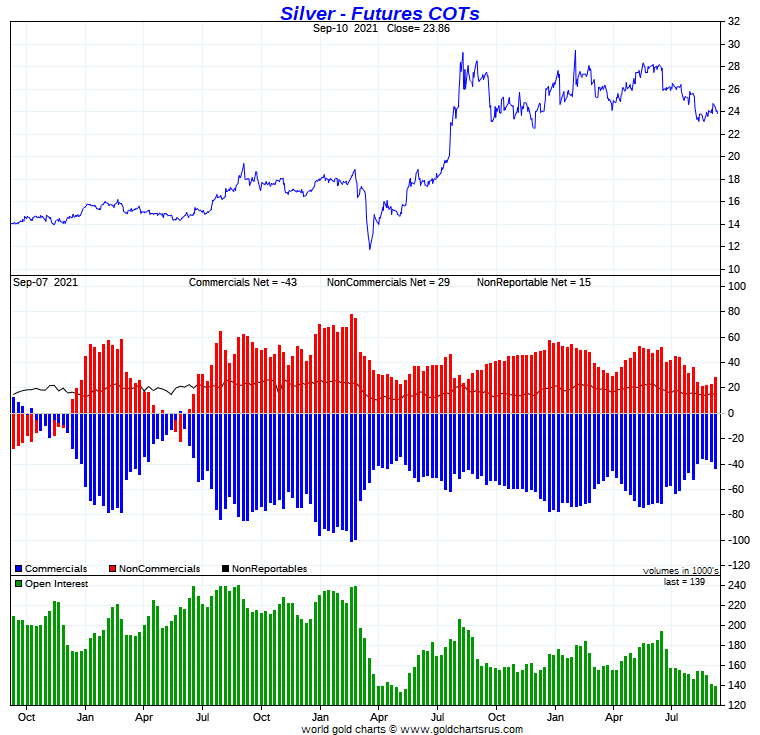
So it looked like the 'same old, same old' again this week, as the Big 4 traders had to add to their short positions once again to prevent silver's price from blasting to the moon and the stars.
Ted mentioned on the phone yesterday that they had been quietly increasing their short position over the last month to the tune of around 7,000 COMEX contracts. That's not a lot over a four week period, but it's not a trend that either one of us wants to see.
I know that he'll certainly have something to say about this in his weekly review for his paying subscribers this afternoon -- and I'm looking forward to his thoughts now that he's had a chance to "sleep on it".
To me, it looks like more 'care & maintenance' until 'whatever' happens -- and I'll have more to say about it in The Wrap.
In gold, the commercial net short position decreased by 4,704 COMEX contracts, or 470,400 troy ounces, which isn't a material amount -- and was all because of long buying by Ted's raptors, the small commercial traders other than the Big 8...the opposite to what happened in silver.
They arrived at that number by increasing their long position by 10 contracts -- and reducing their short position by 4,694 contracts. It's the sum of those two numbers that represents the change for the reporting week.
Under the hood in the Disaggregated COT Report, it was all Managed Money traders and much more, as they decreased their net long position by a chunky 14,082 COMEX contracts. This obviously meant that the other two groups of traders increased their net long positions during the reporting week -- and they did so with a vengeance. The Other Reportables and Nonreportable/small traders increased their net long positions by 3,571 and 5,807 COMEX contracts respectively...which I consider to be a positive development.
Doing the math: 14,082 minus 3,571 minus 5,807 equals 4,704 COMEX contracts, the change in the commercial net short position.
The commercial net short position in gold now sits at 23.58 million troy ounces, down from the 24.05 million troy ounces they were short in last week's COT Report, which is not a material amount as I mentioned earlier.
The short position of the Big 8 traders in this week's COT Report is 23.67 million troy ounces, up a bit [90,000 troy ounces] from the 23.58 million troy ounces they were short in last week's COT Report...so the Big 8, in aggregate, increased their short position in gold as well.
They did that for the simple reason that Ted's raptors in gold, the small commercial traders other than the Big 8, bought 470,400 plus 90,000 equals 560,400 troy ounces/5,604 COMEX contracts -- and it was their buying that had the mathematical effect of reducing the commercial net short position, as they added that many long contracts during the reporting week.
Don't forget that despite their small size, they're still commercial traders in the commercial category.
From the above numbers, the Big 8 traders are short 23.67/23.58=a hair over 100 percent of the commercial net short position in gold, which means that Ted's raptors are now back to being net long the COMEX futures market in gold by that hair.
Here's Nick Laird's 3-year COT chart for gold, updated with Friday's data -- and the weekly change should be noted, even though it's not overly large. Click to enlarge.
It was nice to see the decrease in the commercial net short position in gold, but as I pointed out, it was all due to long buying by Ted's raptors, the small commercial traders other than the Big 8.
So even though the gold price was down during the reporting week, the Big 8 shorts still had to add to their short positions to prevent the gold price from exploding, as the smaller traders were aggressive long buyers.
What this portends for the future, remains to be seen.
But even subtracting out the new long position held Ted Butler's new golden whale, the short position in gold by the Big 8 is still up around 40,000 or so contracts from its engineered low of a month ago.
So it appears to be the 'same old, same old' in gold as well. They're just not going to allow its price to rise until they're reading to set it free...whenever that may be.
In the other metals, the Managed Money traders in palladium decreased their net long position by 136 COMEX contracts during the last reporting week -- and are net long the palladium market by only 1,060 COMEX contracts...around 12 percent of the total open interest...down about 2 percentage points from last week's report. And after this week's price smash are probably close to market neutral now. In platinum, the Managed Money traders increased their net short position by a further 1,512 contracts during the reporting week -- and are now net short the platinum market by 7,077 COMEX contracts. They, along with the Big 4/8 traders, are the only categories that are net short platinum right now. The other three categories are mega net long, including the rest of the commercial traders. In copper, the Managed Money traders decreased their net long position by a very hefty 14,082 COMEX contracts -- and are net long copper by 67,595 COMEX contracts...about 1.69 million pounds of the stuff -- and about 13 percent of total open interest...down about 3 percentage points from last week.
![]()
Here’s Nick Laird’s “Days to Cover” chart, updated with the COT data for positions held at the close of COMEX trading on Tuesday, September 7. It shows the days of world production that it would take to cover the short positions of the Big 4 — and Big '5 through 8' traders in each physically traded commodity on the COMEX.
I consider this to be the most important chart that shows up in the COT series -- and it deserves a minute of your time. Click to enlarge.
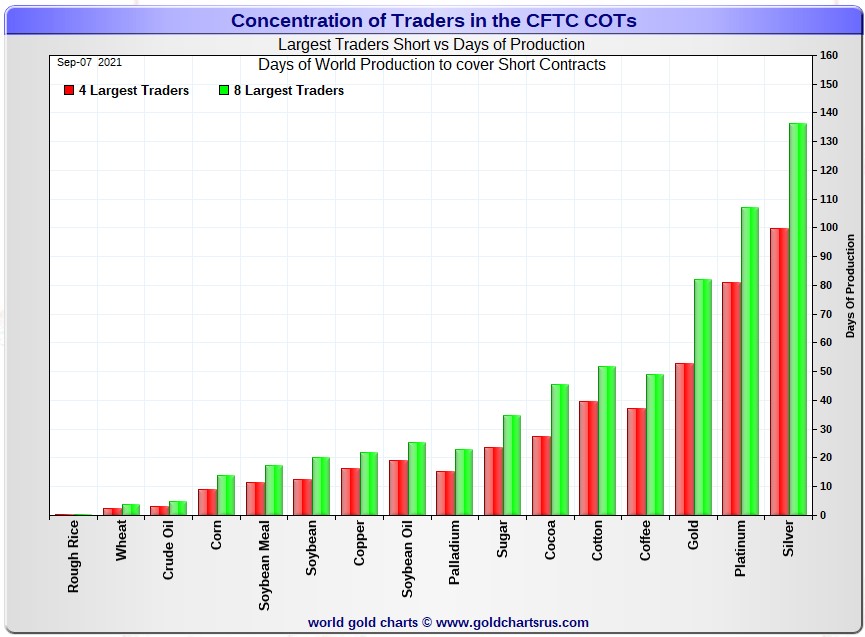
In it, the Big 4 traders are short about 100 days of world silver production which is up about 4 days from the prior week's report. The ‘5 through 8’ large traders are short an additional 36 days of world silver production...down about 1 day from the prior COT Report for a total of about 136 days that the Big 8 are short...up about 3 days from last week's COT report. [In the prior reporting period they were short 133 days of world silver production.]
That 136 days that the Big 8 are short, represents a bit over four and a half months of world silver production, or 318.0 million troy ounces of paper silver held short by the Big 8.
In the COT Report above, the Commercial net short position in silver was reported by the CME Group at 216.3 million troy ounces. As mentioned in the previous paragraph, the short position of the Big 4/8 traders is 318.0 million troy ounces. So the short position of the Big 4/8 traders is larger than the total Commercial net short position by 318.0-216.3=101.7 million troy ounces...down 19.3 million troy ounces/3,860 COMEX contracts from last week's report.
It was this long selling by the small commercial traders that had the mathematical effect of increasing the Commercial net short position in the COT Report above.
The reason for the difference in those numbers two paragraphs ago...as it always is...is that Ted's raptors, the 29-odd small commercial traders other than the Big 8, are net long that amount...101.7 million troy ounces.
Another way of stating this [as I say every week in this spot] is that if you remove the Big 8 shorts from the commercial category, the remaining traders in the commercial category are mega net long the COMEX silver market. It's the Big 8 against everyone else...a situation that has existed for almost five decades in silver, platinum and palladium -- and now in gold as well.
As per the first paragraph above, the Big 4 traders in silver are short around 100 days of world silver production in total. That's about 25 days of world silver production each, on average...up 1 day from last week's COT Report. The four big traders in the '5 through 8' category are short 36 days of world silver production in total, which is 9 days of world silver production each, on average...down a bit from last week's COT Report.
The Big 8 commercial traders are short 45.7 percent of the entire open interest in silver in the COMEX futures market, which is up a bit from the 44.1 percent they were short in last week's COT report. And once whatever market-neutral spread trades are subtracted out, that percentage would be over the 50 percent mark. In gold, it's 46.7 percent of the total COMEX open interest that the Big 8 are short, which is up a tiny amount from the 46.5 percent they were short in last week's COT Report -- and something approaching the 55 percent mark once their market-neutral spread trades are subtracted out.
In gold, the Big 4 are short 53 days of world gold production, down about 1 day from last week's COT Report. The '5 through 8' are short 29 days of world production -- up about 1 day from last week's report...for a total of 82 days of world gold production held short by the Big 8 -- and obviously unchanged from the prior COT Report. Based on these numbers, the Big 4 in gold hold about 65 percent of the total short position held by the Big 8...down about 1 percentage point from the prior week's COT Report.
The "concentrated short position within a concentrated short position" in silver, platinum and palladium held by the Big 4 commercial traders are about 74, 76 and 65 percent respectively of the short positions held by the Big 8...the red and green bars on the above chart. Silver is up about 2 percentage points from last week's COT Report...platinum is about unchanged from a week ago -- and palladium is down about 3 percentage points week-over-week.
As I keep saying month after month, the Big 4/8 traders are still hugely short in all four precious metals in the COMEX futures market. But it's now mostly the Big 4...or probably just the Big 3...Citigroup, Bank America and HSBC -- and the above chart tells you all you need to know about their current plight.
And as I mentioned in the COT discussion further up, the Big 8 traders increased their short positions again this week. Not by much, but an increase nonetheless. Their short positions in both silver and gold have been increasing for the last four weeks now, ever since the low ticks in both back on 09 August.
They're stuck on the short side -- and that's for the very simple reason that the Managed Money traders are no longer willing to go mega short like they used to in the past.
The situation regarding the Big 4/8 shorts continues to be beyond obscene, twisted and grotesque...especially the Big 4 -- and as Ted correctly points out ad nauseam, its resolution will be the sole determinant of precious metal prices going forward.
![]()
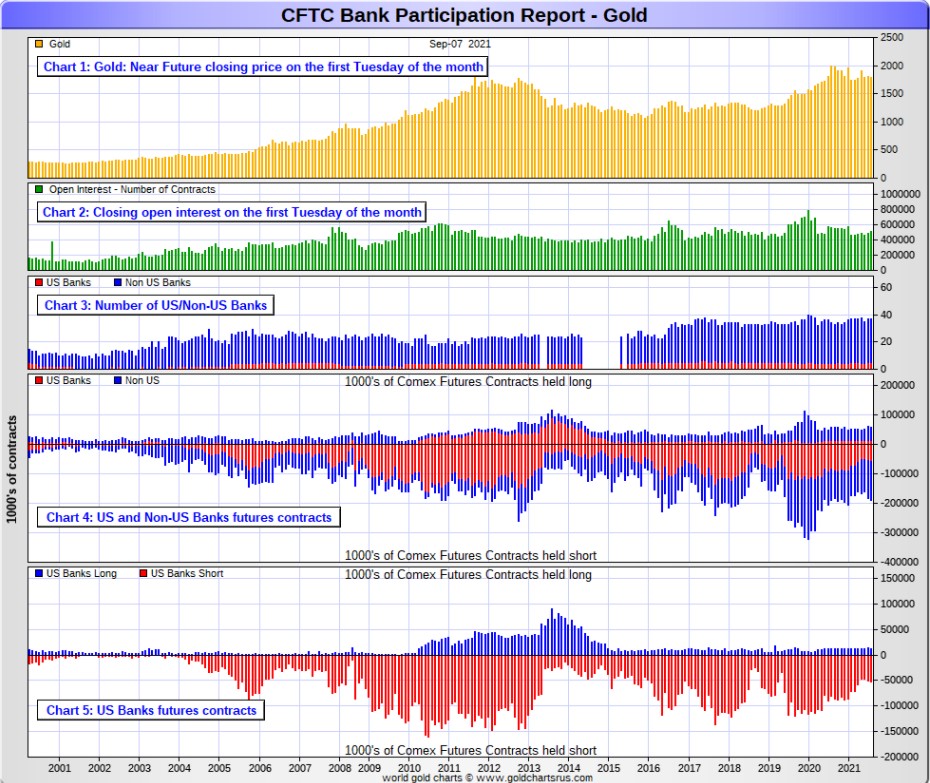
The September Bank Participation Report [BPR] data is extracted directly from yesterday's Commitment of Traders Report. It shows the number of futures contracts, both long and short, that are held by all the U.S. and non-U.S. banks as of Tuesday’s cut-off in all COMEX-traded products. For this one day a month we get to see what the world’s banks are up to in the precious metals —and they’re usually up to quite a bit.
[The August Bank Participation Report covers the time period from August 3 to September 7 inclusive.]
In gold, 5 U.S. banks are net short 41,284 COMEX contracts in the September BPR. In August’s Bank Participation Report [BPR] these same 5 U.S. banks were net short 37,320 contracts, so there was an increase of 3,964 COMEX contracts...the fourth monthly increase in a row.
Citigroup, HSBC USA, Bank of America and Morgan Stanley would most likely be the U.S. banks that are short this amount of gold. I still have some suspicions about the Exchange Stabilization Fund as well, although if they're involved, they are most likely just backstopping these banks.
Also in gold, 32 non-U.S. banks are net short 90,674 COMEX gold contracts. In August's BPR, these same non-U.S. banks were net short 86,612 contracts...so the month-over-month change shows an increase of 4,062 COMEX contracts...the third monthly increase in a row.
At the low back in the August 2018 BPR...these same non-U.S. banks held a net short position in gold of only 1,960 contacts -- and they've been back on the short side in an enormous way ever since.
I suspect that there's at least two large non-U.S. bank in this group, one of which would be Scotiabank/Scotia Capital...plus HSBC. And I have my suspicions about Barclays, Dutch Bank ABN Amro, French bank BNP Paribas, plus Australia's Macquarie Futures as well. Other than that small handful, the short positions in gold held by the vast majority of non-U.S. banks are mostly immaterial and, like in silver, have always been so.
As of this Bank Participation Report, 37 banks [both U.S. and foreign] are net short 26.0 percent of the entire open interest in gold in the COMEX futures market, which is up an immaterial amount from the 25.6 percent that these same 37 banks were net short in the August BPR.
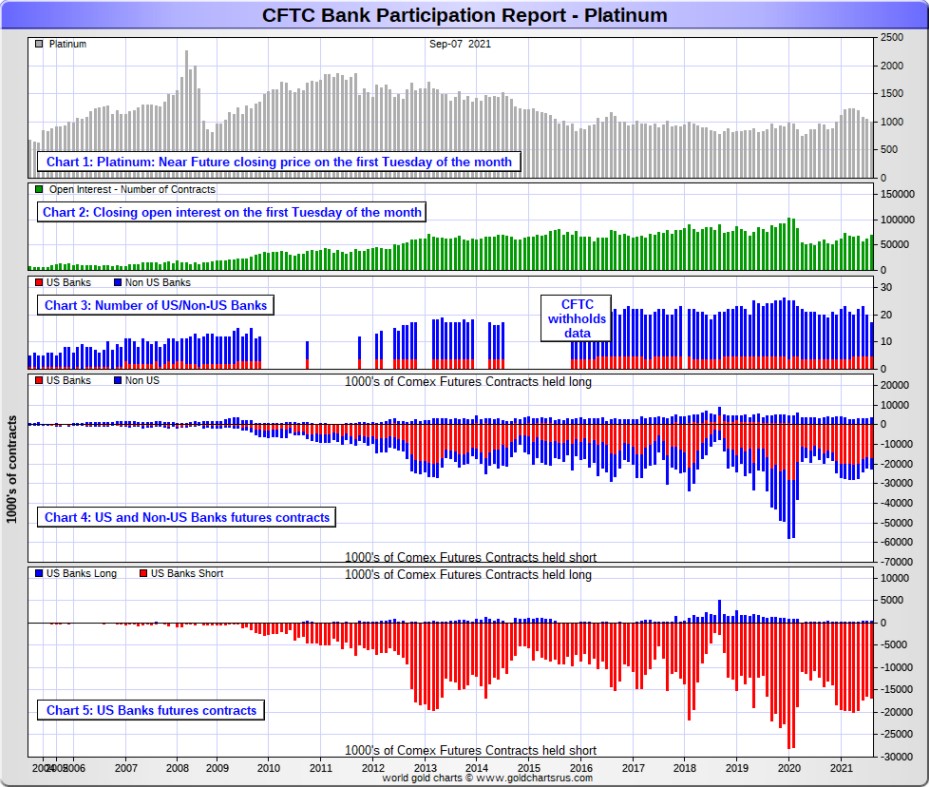
Here’s Nick’s BPR chart for gold going back to 2000. Charts #4 and #5 are the key ones here. Note the blow-out in the short positions of the non-U.S. banks [the blue bars in chart #4] when Scotiabank’s COMEX short position was outed by the CFTC in October of 2012. Click to enlarge.
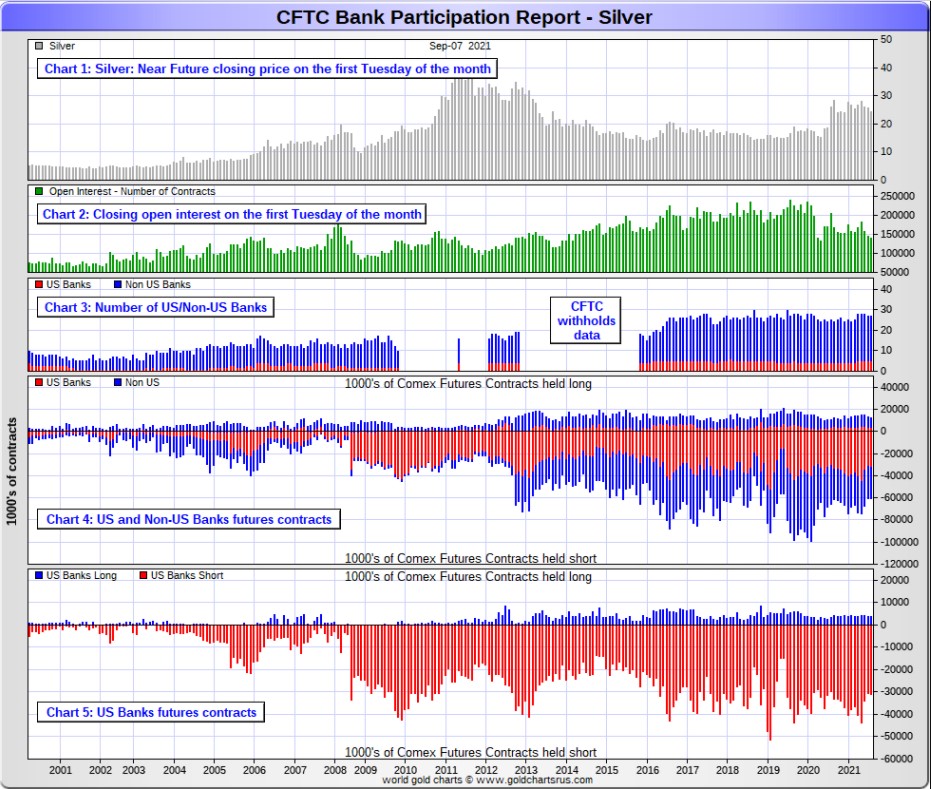
In silver, 5 U.S. banks are net short 27,397 COMEX contracts in September's BPR. In August's BPR, the net short position of 4 U.S. banks was 26,860 contracts, so the short position of the U.S. banks increased by a smallish 537 contracts month-over-month.
As in gold, the four biggest short holders in silver of the five U.S. banks in total, would be Citigroup, HSBC USA -- and Bank of America, Morgan Stanley and one other...and NOT Goldman Sachs. And, like in gold, I'm starting to have my suspicions about the Exchange Stabilization Fund's role in all this...although, like in gold, not directly.
Also in silver, 22 non-U.S. banks are net short 20,223 COMEX contracts in the September BPR...which is down 561 contracts from the 20,784 contracts that these same 22 non-U.S. banks were short in the August BPR.
So it was a wash in silver for the banks in September.
I would suspect that Canada's Scotiabank/Scotia Capital still holds a goodly chunk of the short position of these non-U.S. banks...plus HSBC and Barclays. I also suspect that a number of the remaining non-U.S. banks may actually be net long the COMEX futures market in silver. But even if they aren’t, the remaining short positions divided up between these other 19 non-U.S. banks are immaterial — and have always been so.
As of September's Bank Participation Report, 27 banks [both U.S. and foreign] are net short 34.2 percent of the entire open interest in the COMEX futures market in silver—up a bit from the 32.6 percent that these same 27 banks were net short in the August BPR. And much, much more than the lion’s share of that is held by Citigroup, HSBC, Bank of America, Barclays -- and Scotiabank -- and possibly one other non-U.S. bank...all of which are card-carrying members of the Big 8 shorts.
I'll point out here that Goldman Sachs has no derivatives in the COMEX futures market in any of the four precious metals.
Here’s the BPR chart for silver. Note in Chart #4 the blow-out in the non-U.S. bank short position [blue bars] in October of 2012 when Scotiabank was brought in from the cold. Also note August 2008 when JPMorgan took over the silver short position of Bear Stearns—the red bars. It’s very noticeable in Chart #4—and really stands out like the proverbial sore thumb it is in chart #5. But as of March of 2020...they're out of their short positions, not only in silver, but the other three precious metals as well. Click to enlarge.
In platinum, 5 U.S. banks are net short 16,227 COMEX contracts in the September Bank Participation Report, which is down a tiny 166 contracts from the 16,061 COMEX contracts that these same 5 U.S. banks were short in the August BPR. Nothing to see here.
[At the 'low' back in July of 2018, these U.S. banks were actually net long the platinum market by 2,573 contracts] So they have a loooong way to get to even getting back to market neutral...if they ever intend to, that is.
Also in platinum, 12 non-U.S. banks are net short 3,089 COMEX contracts in the September BPR, which is a negligible change from the 3,074 COMEX contracts that 15 non-U.S. banks were net short in the August BPR. Nothing to see here, either.
[Note: Back at the July 2018 low, these same non-U.S. banks were net short only 1,192 COMEX contracts.]
And as of September's Bank Participation Report, 17 banks [both U.S. and foreign] are net short 28.0 percent of platinum's total open interest in the COMEX futures market, which is down a fair amount from the 31.3 percent that 20 banks were net short in August's BPR.
But it's the U.S. banks that are on the short hook big time -- and the real price managers. They have little chance of delivering into their short positions, although a very large number of platinum contracts have already been delivered during the last 10 months or so. But that fact, like in both silver and gold, has made no difference whatsoever to their short positions held. Their short positions in the COMEX futures market in this precious metal is just about as equally dire as it is in the other two precious metals...silver and gold.
The reason that they'll never improve their short positions in a big way is the same reason as in gold and silver...the Managed Money traders flatly refuse to go short big time like they used to in the past...although they are short around 7,000 COMEX contracts at the moment.
That short position is mostly neutralized by the Swap Dealers in the commercial category, as they actually net long about 6,300 platinum contracts right now.
Here's the Bank Participation Report chart for platinum. Click to enlarge.
In palladium, '3 or less' U.S. banks are net short 1,210 COMEX contracts in the September BPR, which is down a substantial amount from the 2,088 contracts that these '3 or less' U.S. banks were net short in the August BPR. And I will point out here that these U.S. banks [for the third month in a row] hold zero long contracts in palladium, compared to the 1,210 contracts that they hold on the short side. These short contracts exist solely for price management purposes.
They were short only 1,194 COMEX contract in the July 2020 BPR -- and are undoubtedly far lower than that now since the Tuesday cut-off.
Also in palladium, '9 or more' non-U.S. banks are net long 219 COMEX palladium contracts—down from the 467 contracts that '9 or more' non-U.S. banks were net long in the August BPR. These non-U.S. banks have been net long by a bit in palladium for the last eighteen months in a row.
And as I've been commenting for almost forever now, the COMEX futures market in palladium is a market in name only, because it's so illiquid and thinly-traded. Its total open interest at Tuesday's cut-off was only 8,522 contracts...compared to 69,024 contracts of total open interest in platinum...139,187 in silver -- and 506,772 COMEX contracts in gold.
As of this Bank Participation Report, 12 banks [both U.S. and foreign] are net short 11.6 percent of the entire COMEX open interest in palladium...down a bit from the 15.5 percent of total open interest that 15 banks were net short in August's BPR.
And because of the small numbers of contracts involved, along with a tiny open interest, these numbers are pretty much meaningless. So, for the last twenty months in a row, the world's banks are no longer involved in the palladium market in a material way. According to Ted, palladium is mostly a cash market now.
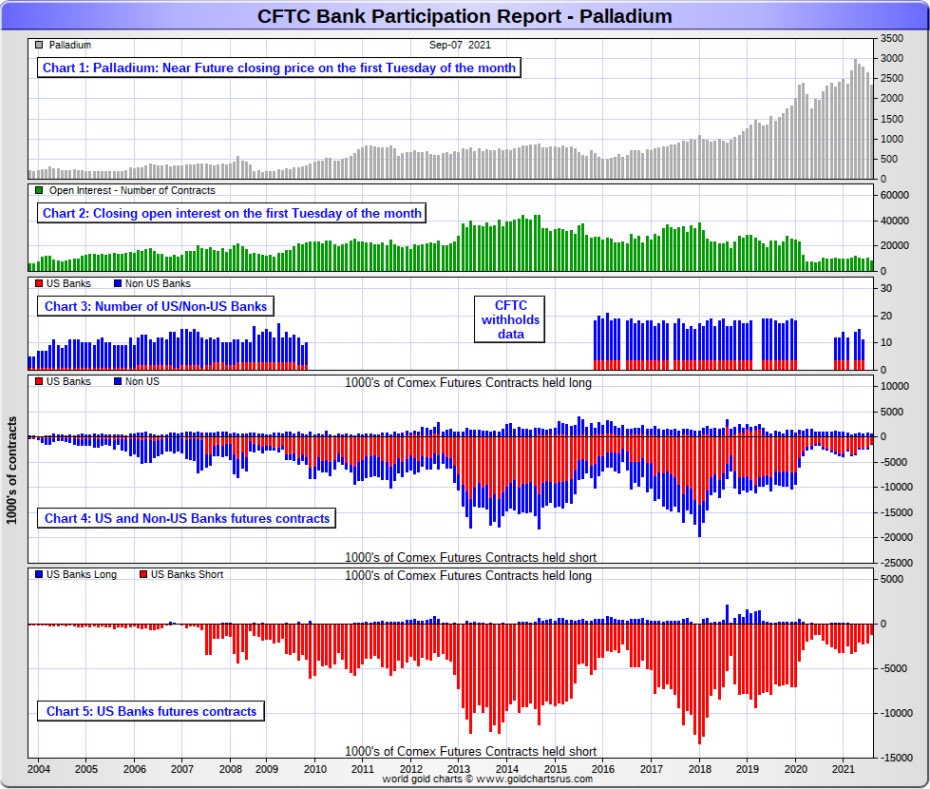
Here’s the palladium BPR chart. And as I point out every month, you should note that the U.S. banks were almost nowhere to be seen in the COMEX futures market in this precious metal until the middle of 2007—and they became the predominant and controlling factor by the end of Q1 of 2013. They have imploded into insignificance over the last twenty or so Bank Participation Reports -- and it remains to be seen if they return as big short sellers again at some point like they've done in the past. Click to enlarge.
Except for palladium, only a small handful of the world's banks/investment houses, most likely four or so in total -- and mostly U.S-based, except for HSBC, Barclays and Scotiabank...continue to have meaningful short positions in the other three precious metals. It's a near certainty that they run this price management scheme from within their own in-house/proprietary trading desks...although it's pretty much a given that their clients are short these metals as well.
The futures positions in silver and gold that JPMorgan holds are immaterial -- and have been since March of last year. According to Ted, they're long a bit in gold -- and market neutral in silver. It's the next Big 8 shorts et al. that are on the hook in everything precious metals-related...but as I just mentioned, it's most likely only the Big 4, or maybe the Big 2 now...as the concentration data is so stark...as per the above 'Days to Cover' chart.
But as has been the case for over a year now, the short positions held by the Big 4/8 traders/banks is the only thing that matters -- and how it is ultimately resolved [as Ted said earlier] will be the sole determinant of precious metal prices going forward.
The Big 4 shorts continue to have an iron grip on precious metal prices. That will continue until they voluntarily give it up...or are told to step aside, as it now appears that there's no chance that they will ever get overrun. If that possibility had ever existed in reality, it would have happened already.
I only have a handful of stories, articles and videos for you today.
![]()
CRITICAL READS
Producer inflation accelerated in August, as wholesale prices rose record 8.3% from a year ago
Prices that producers get for final demand goods and services surged in August at their highest annual rate since at least 2010, the Labor Department reported Friday.
The producer price index rose 0.7% for the month, above the 0.6% Dow Jones estimate, though below the 1% increase in July.
On a year-over-year basis, the gauge rose 8.3%, which is the biggest annual increase since records have been kept going back to November 2010. That came following a 7.8% move higher in July, which also set a record.
The data comes amid heightened inflation fears fed by supply chain issues, a shortage of various consumer and producer goods and heightened demand related to the Covid-19 pandemic. Federal Reserve officials expect inflationary pressures to ease through the year, but they have remained stubbornly persistent, with Friday’s numbers indicating that the trend likely will continue.
Excluding food, energy and trade services, final demand prices increased 0.3% for the month, below the 0.5% Dow Jones estimate. Still, that left core PPI up 6.3% from a year ago, also the largest record increase for data going back to August 2014.
Final demand services rose 0.7% for the month, thanks to a 1.5% gain in trade services, or the margins received by wholesalers and retailers. Transportation and warehousing costs surged 2.8%.
This news item put in an appearance on the cnbc.com Internet site at 8:32 a.m. EDT on Friday morning -- and was updated about ninety minutes later. I thank Swedish reader Patrik Ekdahl for pointing it out -- and another link to it is here. The Zero Hedge spin on this is headlined "U.S. Producer Prices Soar at Record Pace in August, Up 9 Months in a Row" -- and I thank reader B.R. for that one.
The Process of Ending Massive Money Printing Has Started -- Wolf Richter
ECB is second giant to taper. Bank of Japan already ended QE. Bank of Canada shed 15% of its assets. Bank of England & Reserve Bank of Australia are tapering. Reserve Bank of New Zealand quit QE cold turkey. Riksbank will end QE this year. What’s taking the Fed so long?
The ECB has increased the assets on its balance sheet by a monstrous €154 billion ($181 billion) per month so far this year via an alphabet soup of programs, blowing by even the crazed money-printers at the Fed with their average rate of $123 billion a month. While there appears to be consensus at the Fed that “tapering” its asset purchases will begin this year and will be completed in the first half next year, with assets then remaining level, the ECB announced today that it will start tapering its asset purchases now.
And thereby it is way behind the Bank of Japan, the Bank of Canada, the Bank of England, the Reserve Bank of New Zealand, and the Reserve Bank of Australia. But ahead of the Fed.
Following in the footsteps of the Bank of England, which had denied in May that its tapering was tapering, and in the footsteps of the Bank of Canada, which had denied last October that its tapering was tapering – though it has since then cut QE to nearly nothing and shed 15% of its assets – ECB President Christine Lagarde also denied at the press conference today that tapering was tapering, and stressed that tapering was instead a “recalibration” of QE.
Reserve Bank of New Zealand ended its asset purchases cold turkey in May without tapering to pull the plug on the #1 housing bubble in the world...
The Reserve Bank of Australia announced in July that it would start tapering its asset purchases from A$5 billion a week to A$4 billion a week. Total assets on its balance sheet declined last week for the first time all year...
This somewhat longish but worthwhile chart-filled commentary from Wolf was posted on his website on Thursday sometime -- and I thank Richard Saler for bringing it to our attention. Another link to it is here.
Why One Bank Is Warning Its Clients of An Imminent "Hard Correction"
Earlier this week, when recapping the latest bearish outlooks from most large Wall Street banks, we touched on Deutsche Bank's latest House View take in which the bank - along with most of its peers - said that its strategists expects an "imminent correction" without giving much context for the bank's gloomy take.
So fast forwarding to today, the bank's chief equity strategist Binky Chadha expounded on this bearish take, and in a note pointing out that "equity valuations are extremely rich", he first explains "what's keeping equity valuations high", and then goes on to warn that "the risk the correction is hard is growing" adding that "there has been a clear negative relationship between initial valuations and subsequent forward returns, with the relationship strengthening as the return horizon is increased from 1 to 3 to 5 years out. For the highest decile of initial valuations, which is where we currently are, 5-year forward returns have on average been slightly negative."
Starting at the top, Chadha lays out what everyone - even the N.Y. Fed president - is aware of, namely that equity market valuations are "historically extreme" on almost any metric: "trailing and forward price to earnings (P/E), enterprise value to EBIT, EBITDA or operating cash flow are all well into the 90s in percentile terms. High valuations are broad based across sectors and median company valuations are high."
This very long chart-filled commentary appeared on the Zero Hedge website at 12:40 p.m. on Friday afternoon EDT -- and comes to us courtesy of reader B.R. as well. Another link to it is here.
Doug Noland: Necessarily Aggressive
The job of the Federal Reserve is “to take away the punch bowl just as the party gets going.” This critical insight from the great central banker, Marriner Eccles, is dismissed as hopelessly archaic. These days, it’s more a central bank’s job to spike the punch at the earliest indication the party might be losing its momentum.
Asset inflation and Bubbles are no longer to be feared, and they certainly don’t justify monetary tightening that might unduly jeopardize economic prosperity.
There’s a steep price that will have to be paid for not quashing inflationary dynamics early. In China’s case, not only did officials fail to repress housing inflation and speculation, their propensity to back off early worked to further invigorate Bubble Dynamics. Literally tens (hundreds?) of millions of property (apartment) speculators became emboldened. Beijing would ensure their housing wealth only inflated.
Housing was for living, while housing speculation became the ticket to a better life.
Beijing recognizes it has an urgent problem. Its historic apartment Bubble has created enormous economic imbalances. It poses a great threat to China’s financial system. Moreover, Bubble excess is exacerbating social inequality, with mounting risk to social stability. They are forced into being Necessarily Aggressive because previous feeble tightening attempts failed.
The pertinent question has become: how much pain are they willing to tolerate? Having fallen significantly “behind the curve,” speculative dynamics will be restrained only through the administration of pain. Speculators have to suffer. Ditto for lenders. Lessons must be learned the hard way. But at this stage, a determined tightening risks a Bubble collapse with serious systemic risk. And if Beijing again loses its nerve, it will display weakness. At this phase of the cycle, a revived bubble would have disastrous consequences.
Doug's weekly commentary is always a must read for me -- and today's efforts were posted on his website in the wee hours of Saturday morning EDT. Another link to it is here. Gregory Mannarino's post market close rant for Friday is linked here -- and the I thank reader B.R. for that one.
Does Freedom Pay? -- Bill Bonner
Does freedom pay?
Thank the long-suffering people of North Korea for their real-world/real-time test. The elite in North Korea has been telling them what to do for more than half a century… with predictable results – grinding poverty… and outright starvation.
And we are grateful. Otherwise, the theory – that the freer the society, the richer the people – would be just a theory… buttressed only by speculation, logic, and anecdotal evidence.
But the test on the Korean Peninsula was almost perfect. Same people. Same resources. Same climate. Same time (the test began in 1953). More or less the same starting position (the U.S. had pulverized North Korea in the war; but so had it smashed up Japan and Germany).
The southerners chose freedom – moderated, as always, by government, social norms, and so forth.
The group in the North went for non-freedom… ruthlessly, sternly enforced by the Kim Il-Sung and then Kim Jong-Il communist governments.
The result? The South Korean economy is now nearly 100 times bigger than the economy of North Korea. The average South Korean has nearly 50 times more wealth.
He will live to an average age of 79, which is 11 years longer than the North Korean male (and a couple of years more than the average man in the U.S.).
And to top it off, the free people of the South are between 1 and 3 inches taller than those in the North, thanks to getting enough to eat.
Conclusion: Freedom makes a big difference in the economic world.
But does it work elsewhere?
This interesting commentary from Bill was posted on the rogueeconomics.com Internet site very early on Friday morning EDT -- and another link to it is here.
U.S. bullion product sales exceed last year’s figures
At the end of the first eight months of calendar year 2021, U.S. Mint sales of American Eagle 1-ounce silver bullion coins already exceeded its sales for all of 2020 by more than 800,000 coins.
Through Aug. 31, sales of the bullion versions of the two designs of American Eagle silver coins to the Mint’s authorized purchasers totaled 22,690,500 coins.
This number reflects combined sales of Reverse of 1986 coins and Reverse of 2021 coins.
The Mint’s authorized purchasers placed orders Sept. 7 for another 750,000 Reverse of 2021 coins, under allocation.
In the first eight months of 2020, the Mint recorded sales of 22,190,500 American Eagle silver bullion coins.
Those sales are the entire calendar year’s sales, as no more were sold by the Mint from Sept. 1 through Dec. 31, 2020.
American Eagle gold bullion coin sales in 2021 through Aug. 31 total 857,000 ounces. Authorized purchasers ordered another 10,000 ounces on Sept. 7.
Sales in 2020 reached 824,000 ounces for the entire year.
American Buffalo gold coin sales to U.S. Mint authorized purchasers in 2021 total 234,500 coins through Aug. 31, compared to 184,000 coins in 2020 for the same eight-month period.
This article showed up on the coinworld.com Internet site at 9 a.m. EDT on Friday morning -- and another link to it is here.
![]()
The Photos and the Funnies
Continuing on our adventure just south of Hope, B.C. on 20 September, the first photo is another I took at Silver Lake Provincial Park...or our way to Ross Lake on the Canada/U.S. border. As I said yesterday, no photo can do justice to the beauty of this place. Before heading further south, we had to back-track a bit to get onto the east side of the lake -- and I stopped and took the last two photos from the one-lane bridge that crosses over Silver Creek...the creek that drains Silver Lake -- and ends its short life about 10 or so kilometers away in the Fraser River.


![]()
The WRAP
“I tell you, freedom and human rights in America are doomed. The U.S. government will lead the American people in - and the West in general - into an unbearable hell and a choking life.” -- Osama bin Laden (October 2001), as reported by CNN
Today's pop 'blast from the past' was a hit single from British band Supertramp's 1974 album Crime of the Century. It peaked at number 13 on the U.K. singles chart in February 1975...number 15 on the U.S. charts -- and number one on the Canadian Singles Chart. It was composed by lead singer and keyboard player Roger Hodgson on his Wurlitzer piano at his mother's house when he was 19 years old. The song needs no introduction, nor does the band -- and the link is here. The bass line to this song is the most unusual I've ever heard -- and it's laid down perfectly by Dougie Thomson -- and linked here.
Today's classical 'blast from the past' predates the pop 'blast from the past' by 105 years. It's the Scottish Fantasy in E-flat major, Op. 46, a composition for violin and orchestra by Max Bruch. Completed in 1880, it was dedicated to the virtuoso Spanish violinist Pablo de Sarasate.
Although Bruch visited Scotland for the first time only a year after the premiere of the work, he had access to a collection of Scottish music at Munich library in 1868. In paying homage to Scottish tradition, the work gives a prominent place to the harp in the instrumental accompaniment to the violin. The Scottish Fantasy is one of several signature pieces by Bruch that is still widely heard today, along with his first violin concerto and Kol Nidrei for cello and orchestra.
Here's American violinist Stefan Jackiw doing the honours -- and accompanied by the Sinfónica de Galicia based out of A Coruña in Spain. I've posted this before, but it's been a while -- and the link is here.
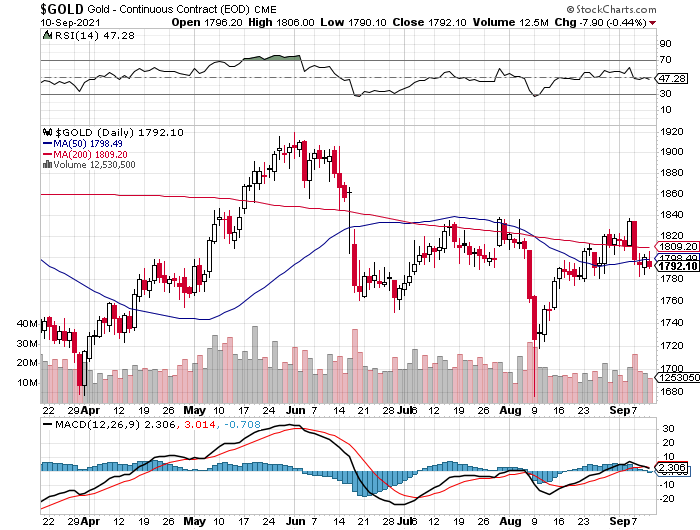
Gold's brief sojourn above the $1,800 spot mark was only allowed to last for about four hours -- and its struggle to get as high as it did was certainly resisted by the Big 4/8 shorts.
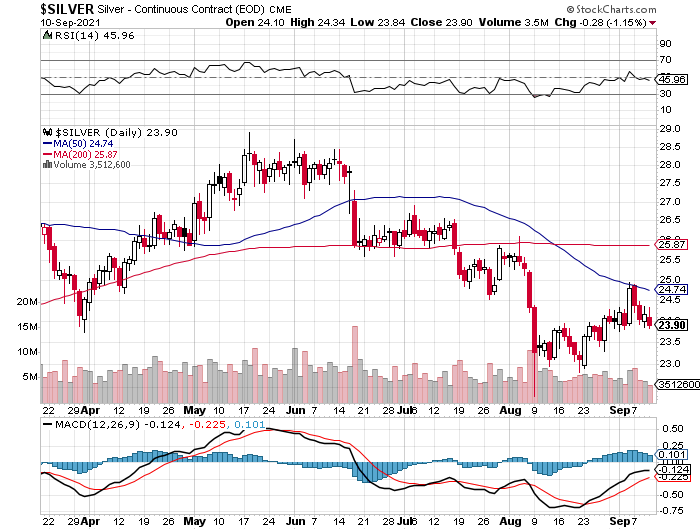
Silver's foray above $24 spot lasted longer, but the short sellers of last resort were resolute -- and, like gold, was closed well below that number -- and on its low tick of the day too.
Gold was closed below its 50-day moving average for the third day in a row -- and silver hasn't been allowed to close above its 50-day since the middle of June.
The price pressure on platinum has been pretty relentless since the first week of May -- and it hasn't been allowed to trade above its 50-day moving average since the middle of that month. It's been about the same in the very thinly-traded and very illiquid palladium market, as only around 2,250 net contracts were traded in the current front month in that precious metal yesterday, so anyone with an agenda had no difficulty in maneuvering its price lower.
None of the current price activity in the precious metals has anything to do with supply/demand fundamentals -- and is strictly paper positioning by the commercial traders of one stripe or another in the GLOBEX and COMEX futures markets...particularly the latter.
As I mentioned in my Bank Participation Report commentary above..."The Big 4 shorts continue to have an iron grip on precious metal prices. That will continue until they voluntarily give it up...or are told to step aside, as it now appears that there's no chance that they will ever get overrun. If that possibility had ever existed in reality, it would have happened already."
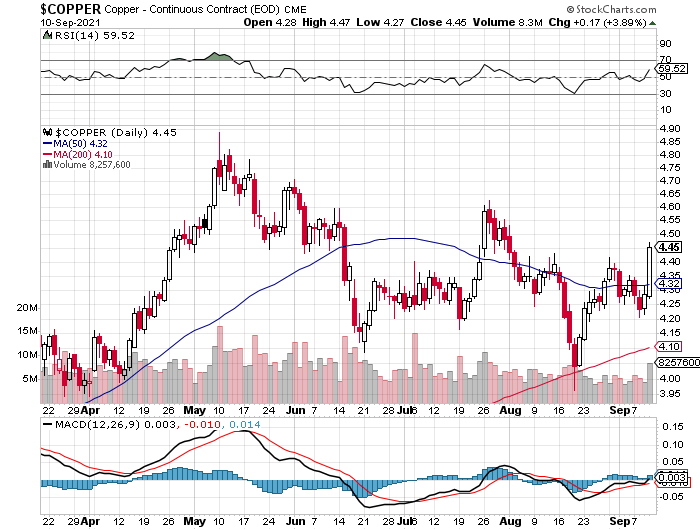
Copper put on an eye-opening gain yesterday...up 17 cents a pound, which is the biggest one-day gain since mid March of last year -- and it closed well above its 50-day moving average in the process.
I'll point out here that in yesterday's Bank Participation Report, the world's banks are net long 7.5 percent of the total open interest in copper in the COMEX futures market.
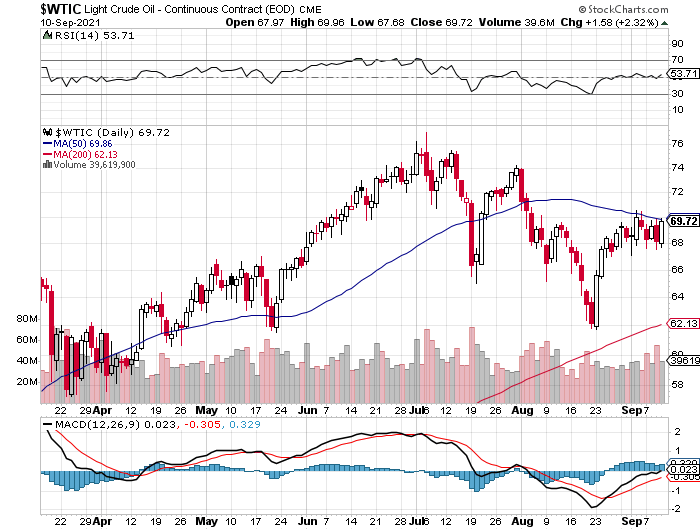
Natural gas closed down 9 cent/1,000 cubic feet...but WTIC jumped higher, closing up $1.58/barrel -- and a tiny bit below its 50-day moving average.
Here are the 6-month charts for the Big 6 commodities, thanks to stockcharts.com as always -- and yesterday's changes should be noted...if you have the interest. Click to enlarge.
The deep state/New World order crowd continue their mass hysteria campaign regarding the coronavirus -- and you know it's b.s. when the social media giants and the main stream press refuse to allow professional and informed dissenting opinion. And those who are really vocal about it on those platforms, find themselves without a voice before too long.
So freedom of speech is only allowed when it doesn't run up against the narrative touted by the powers-that-be. Even freedom of movement is now being restricted...unless you've had your shots, plus hold a soon-to-be-launched vaccine "passport". Then there's the not-so-small matter of keeping ones job if you don't get 'the jabs'. This is draconian to the nth degree.

And as Ayn Rand correctly pointed out decades ago..."The difference between a welfare state and a totalitarian state is just a matter of time." And whether that manifests itself in world fascism, or some form of communism, remains to be seen...but that's the path that we're being forced down right now...regardless of what "Western" country we might live in.
This is particularly true of that bastion of capitalism, the U.S.A.
At the close of the Constitutional Convention on September 17, 1787 -- and as Benjamin Franklin left the hall in Philadelphia, he was asked, “What kind of government have you given us, Dr. Franklin?” He replied: “A republic, if you can keep it.”
The forces that set out to destroy the American Republic have been going on for more than 100 years now -- and it's not just Ayn Rand that has pointed it out over the decades. Other highly-placed people have as well...including former U.S. President Eisenhower's famous "military/industrial complex" speech way back when -- and in that Douglas MacArthur quote above.
Those "insidious forces working from within" that MacArthur spoke of, are now in your face 24/7 everywhere you care to look, not only at home, but abroad.
And with all the major banks that comprise the U.S. Federal Reserve now talking about a major market correction, one wonders if they're about to provide the pin that pops the biggest 'Everything Bubble' the world has ever known.
As I pointed out in The Wrap last week -- and in countless Wraps before that..."The only thing that is know for sure is that it will end -- and as I've been pointing out with increasing frequency over the last several years, the end will come by design, rather than circumstance."
And as I've also said before, the latter scenario may be allowed to precipitate the former.
There are no coincidences in the markets these days, as they're all heavily managed...equities, bonds, interest rates, precious metal prices, crude oil, the lot...all the financial markets that matter. And the end of all things as we've known them in our lifetimes, will be as equally managed. At least that's what they'll attempt to do -- and whether it all goes "according to Hoyle" from their point of view, remains to be seen.
"The New World Order crowd have their agenda and timetable for their takeover of as much of the world as they can. We're not privy to it -- and the best we can do is to be financially, emotionally and spiritually ready for it when that day comes."
I also suspect that when this "imminent hard correction" does finally arrive...to quote that Deutsche Bank analyst in the story in the Critical Reads section above...it may be used by the Big 8 shorts to smash the precious metal prices lower one last time.
So be prepared for that eventuality, plus whatever other atrocities the deep state/New World Order crowd bring down upon us in order to "save" us.
Right now both silver and gold appear to be held in some sort of 'care & maintenance' holding pattern until the next move by these various and sundry sociopaths/psychopaths are unleashed upon us.
As Ted Butler has pointed out countless times over the years, the treachery of these bastards should never be underestimated.
And to quote Gandalf the White one more time..."Understand this: things are now in motion that cannot be undone."
How did it come to this?
I'm still "all in" -- and I'll see you on Tuesday.
Ed
About the author

SUBSCRIBE: https://edsteergoldsilver.com/

Ed Steer’s Daily Analysis of the Gold and Silver Markets
After eight years of writing about the precious metals for Casey Research, the folks at Stansberry & Associates—who just recently purchased controlling interest in the company—decided that my ‘niche market’ column didn’t fit into their plans.
Since the time that Casey Research was kind enough to offer me a stand-alone column, it became their most highly-rated blog almost from the outset—and has remained that way up to this date...