There are two charts every precious metals investor needs to see. The U.S. Mint is celebrating its 30 year anniversary producing Gold and Silver Eagles and if we look at the sales data of these two Official precious metal legal tender coins going back to 1986, there are some interesting trends worth looking at.
The U.S. Mint started selling Gold and Silver Eagles in 1986. The first year the U.S. Mint produced these coins, 1,787,750 oz of Gold Eagles were sold compared to 5,096,000 Silver Eagles… a 3 to 1 ratio. That was the first and last year, the Silver-Gold Eagle ratio was that low.
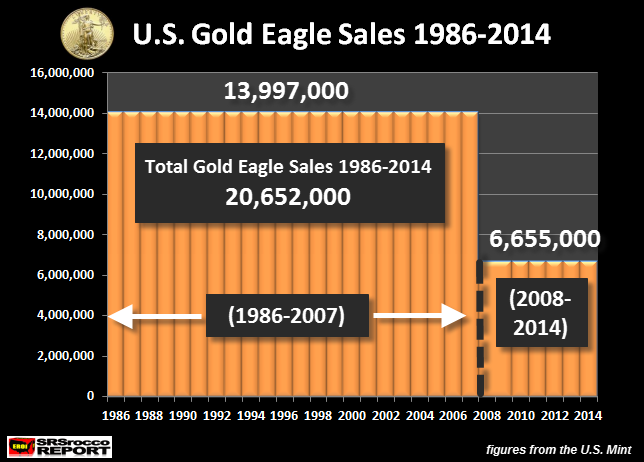
Let’s first look at the Gold Eagle sales chart:
I decided to break down the chart into two separate time frames. We have the total sales from 1986-2007 (before the collapse of the U.S. Investment Banking and Housing Industry), and then after from 2008-2014. As we can see, total sales from 1986-2007 were 13,997,000 oz of Gold Eagles compared to 6,655,000 oz during the 2008-2014 time period.
If we divide the total of Gold Eagle sales from these two time periods by the number of years, we have the following:
Gold Eagle Annual Sales Average
(1986-2008): 13,997,000 / 22 years = 636,227 oz avg. per year
(2008-2014): 6,655,000/ 7 years = 950,714 oz avg per year
So, after the U.S. economy and financial system teetered on the brink of collapse, the U.S. Mint sold an average of 950,714 oz of Gold Eagles annually compared to the 636.227 oz per year prior to 2008.
Furthermore, the total Gold Eagles sold from 1986 to 2014 was 20,652,000 oz. This is a great deal of gold investment at a little more than 652 metric tons (mt). Now, let’s compare the this to the Silver Eagle sales market.
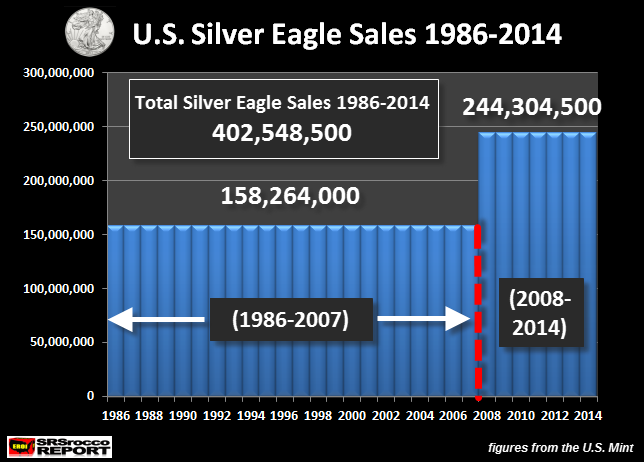
A quick glance at the Silver Eagle chart and we can see a much different picture compared to the historic Gold Eagle chart. From 1986 to 2007, the U.S. Mint sold 158,262,000 Silver Eagles. However, from 2008-2014, the sales of Silver Eagles were 54% higher at 244,304,500.
If we break down the Silver Eagle sales in these two time periods, we have the following:
Silver Eagle Annual Sales Average
(1986-2008): 158,264,000 / 22 years = 7,193,818 avg. per year
(2008-2014): 244,304,500/ 7 years = 34,900,643 avg per year
What a huge difference in sales trends between these two precious metal legal tender coins. The U.S. Mint sold an average of 34.9 million Silver Eagles from 2008-2014 compared to 7.2 million from 1986-2007.
Investors purchased nearly 5 times more Silver Eagles a year after the Great U.S. Economic Collapse in 2008, than they did from 1986-2007. In contrast, the U.S. Mint only sold an average of 50% more Gold Eagles from 2008-2014 compared to the yearly average from 1986-2007. Basically, Silver Eagles outperformed Gold Eagle sales by 10 to 1 since 2008.
It’s plain to see the difference between these two charts… total Silver Eagle sales were much higher in the last seven years, while the total volume of Gold Eagle sales were greater in the 1986-2007 time period.
In addition, the U.S. Mint sold a staggering 402.5 million Silver Eagles (12,520 mt) from 1986 to 2014 compared to the 20.6 million oz of Gold Eagles (652 mt). If we assume the following market prices for the total Gold & Silver Eagle sales, this would be the result:
GOLD & SILVER EAGLE Estimated Total Asset Value
Gold Eagles: 20,652,000 X $1,320 = $27.2 Billion
Silver Eagles: 402,568,500 X $20 = $8.0 Billion
Even though investors purchased 20 times more Silver Eagles than Gold Eagles since the U.S. Mint started producing these coins, the total estimated Silver Eagle asset value is $8 billion compared to the $27.2 billion in Gold Eagles.
Also, think about those figures for a minute. The total U.S. Gold & Silver Eagle Asset Value is approximately $35 billion. Can you imagine what would happen if just a fraction of the $100 Trillion Global Conventional Assets under management tried to move into this market??
NOTE: to arrive at the average price per coin value, I took the present market price of gold and silver and then added a premium.
Investors who purchased Gold and Silver Eagles will do wonderfully in the future when the U.S. Dollar finally disintegrates into a typical Banana Republic Fiat Currency. However, the value of Silver Eagles will out perform Gold Eagles in a big way as the masses try to acquire the more affordable Official Coin.
Lastly, I did receive a reply from APMEX on the issue of Silver Eagle sales since 2011. As many of you remember, Ted Butler has stated several times that JP Morgan is the big buyer of Silver Eagles since April 2011. Butler believes JP Morgan purchase half of all the Silver Eagles produced since April 2011.
I have written in response to that providing evidence from some of the Top Online Precious Metal Dealers that their Silver Eagle sales have continued to grow since 2011. The Chief Operating Officer from APMEX, Kenneth Lewis was kind enough to share some sales info that is not something they typically do.
Unfortunately, I have not yet received permission to reproduce his email, but I can tell you this… Mr Lewis confirms that Gold sales were lower over the past several years, but Silver Eagle sales growth continues to improve paralleling the figures put out by the U.S. Mint.
Please check back for new articles and updates at the SRSrocco Report. You can also follow us at Twitter below:


