Today, the silver price broke through a critical level held for nearly four years. With silver now firmly above the important $18.50 level, the next target is $21. If silver can break above the September 2019 high of $19.75 quickly, there’s a good chance it would reach $21 in June.
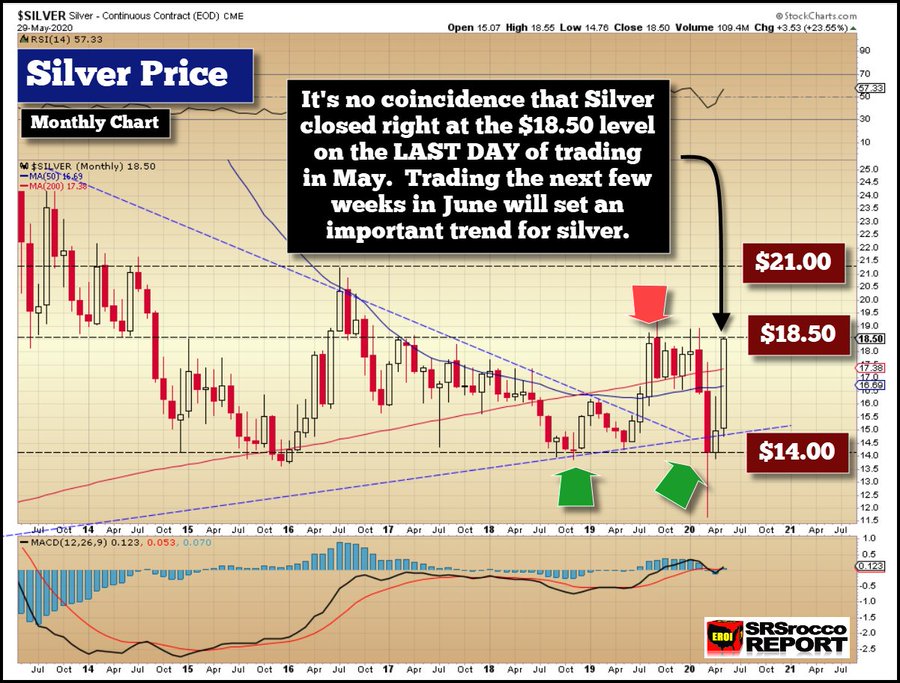
In my previous article, CHART OF THE WEEK: Silver Closes At The End Of May At An Important Technical Level, I posted the chart below showing how silver closed right at the key $18.50 on the last trading day of May. With silver closing at the very top of its price range on the last day of May, I anticipated that it would GAP UP in early Asian trading and continue higher towards the end of the day.

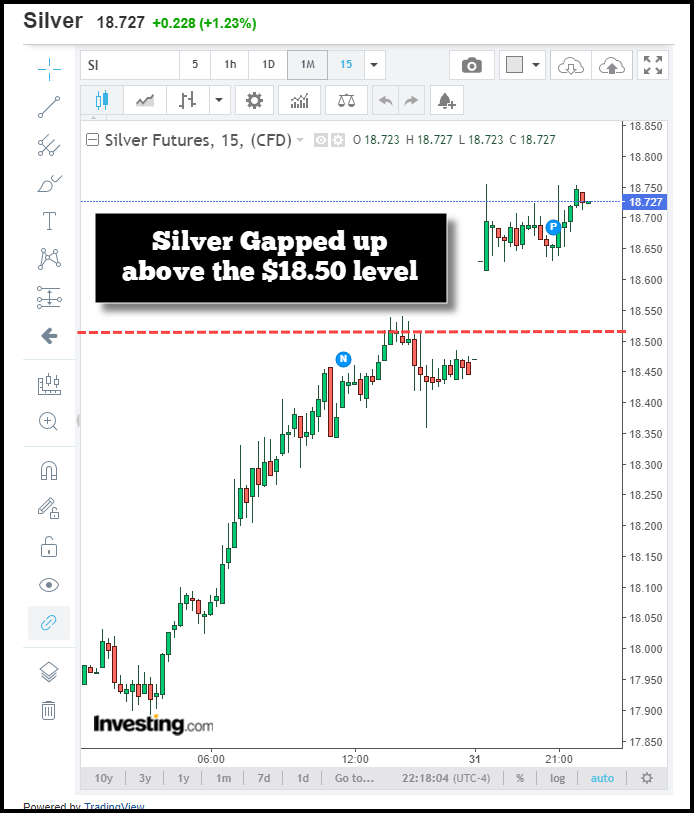
Here we can see that on the Monthly chart (each candlestick represents a full month of trading), silver closed right at the $18.50 level. If silver GAPPED UP in early Asian trading, then the bottom of the candlestick for the month would be ABOVE the $18.50 level. This was extremely important to occur. I tweeted the following charts during the early Asian trading on Sunday night and this morning in the U.S. Markets:

SRSrocco Report@SRSroccoReport
Silver behaved as I anticipated during early Asian trading.
The #Silver price Gapped up above the important $18.50 level.
Now, it needs to remain above $18.50 at the close of U.S. trading tomorrow. https://twitter.com/SRSroccoReport/status/1267197679789985797 …SRSrocco Report@SRSroccoReport
And then early this morning I tweeted the following:

SRSrocco Report@SRSroccoReport
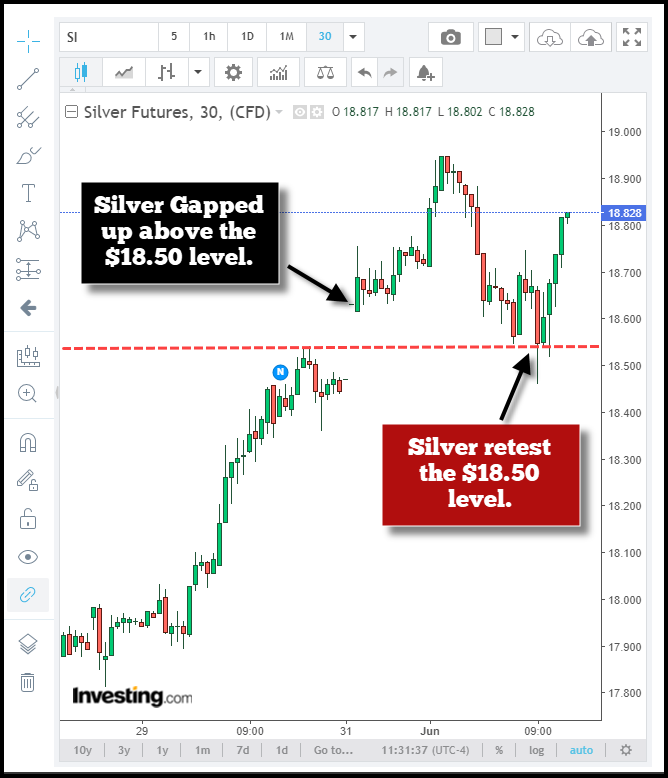
The Silver price Gapped Up, Retested, and continues to Rally in early U.S. Trading.
A close above the $18.50, 15-20+ cents very positive for the #Silver Price in June.https://srsroccoreport.com/chart-of-the-week-silver-closes-at-the-end-of-may-at-an-important-technical-level/ …
As a reminder, the silver price quote on Investing.com and Stockcharts.com, come from the July Futures contract, where most of the trading takes place. Kitco is posting the June contract, which only traded 25 contracts on Friday versus 61,000 for the July contract. So, Investing.com and Stockcharts.com use the more heavily traded closest futures contract.
Regardless, here is the Silver Monthly chart with the first trading day of June:

Silver opened ABOVE the $18.50 level, so the base of the candlestick is above the important key resistance area, which I now believe may have turned into a support line. We will know over the next 1-2 weeks of trading. None of the previous four candlesticks that traded above the $18.50 level, closed above it or opened above it. This is an EXCELLENT SIGN.
If the silver price can break above the last high of $19.75 back during September 19th (RED ARROW) quickly, there’s a good chance it can reach the next target price of $21 in June.
While this is nothing more than PAPER TRADING, I can assure you; Traders were instrumental in pushing silver up above its long-term BREAKOUT LEVELS of $14 and $21 during 2007 and 2010 respectively:

We can clearly see that when the silver price finally broke above $14 in 2007, it shot up to $20 quickly. Then once silver broke above $18.50 and then $21 in 2010, it quickly shot up to $50. Traders look at these important SUPPORT & RESISTANCE LEVELS.
So, now with the silver price above the $18.50 level, its next target is $21. However, once it breaks above $21, it will quickly move to the $27.50 level (not shown in the chart), but you can see from the bottoms made during 2011-2012.
I look forward to watching how silver trades over the next few weeks. I believe with all the money printing, the next target of $21 could come quite quickly.


