Excerpt from this week's: Technical Scoop: Bubble Result, Golden Haven, Weakening Labour
Source: www.stockcharts.com
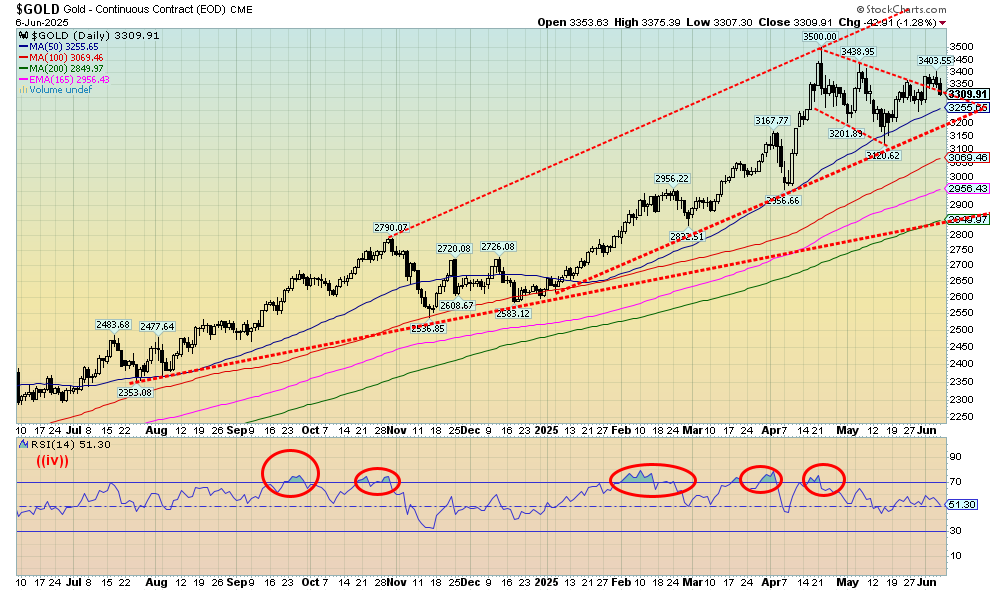
Gold prices were up this past week but then fell 1.3% on Friday, after the release of the mildly better than expected nonfarm payrolls. Maybe they didn’t focus on the downward revisions in the March and April report. Nonetheless, gold decided that it should put the Fed on hold with lowering interest rates, so some profit-taking resulted. Ultimately, gold was up only 0.5% this past week as it held its earlier gains. Other precious metals fared better, with silver up almost 9% to fresh 52-week highs and platinum gaining 11.8%, also to fresh 52-week highs. The near precious metals also saw gains with palladium up 9.1% and copper up 2.8%. Copper went initially over $5 again, but then pulled back to close at $4.80. The gold stocks gained but pulled back on Friday with profit-taking. The Gold Bugs Index (HUI) was up 5.3% and the TSX Gold Index (TGD) gained 2.3%. Both of them made 52-week highs.
We thought we were breaking out over what appeared as a potential bull flag. However, Friday’s action has taken us back into the flag, so that might nullify the breakout at least temporarily. We may be forming a slightly different pattern. Corrections come in ABC patterns, but they also come in ABCDE patterns. The rise to $3,403 might have been a D wave with the E wave down to come. Support is at $3,200. The RSI has been slowly falling, supporting the unconvincing breakout. We’d like $3,200 to hold because under that level we could fall to $3,050 and even down to ultimate long-term support near $2,950. This week, we fell just short of a move over $3,310, a level that would have suggested new highs ahead over $3,500. However, we do have that divergence in that silver did break out and made new highs but gold did not. We may have more to come in this pullback.
Source: www.stockcharts.com
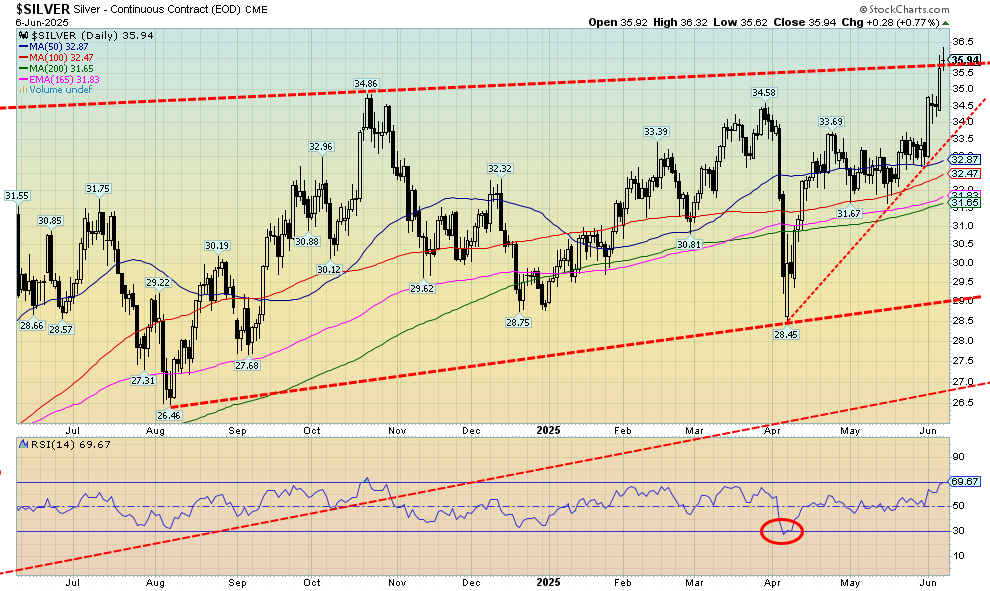
At long last, silver broke over $35 and tested over $36 but has not as yet closed over $36. It seems we have been waiting quite some time for this. To really confirm this breakout, we need to see two consecutive closes over $36. We noted that we thought silver was forming a bullish ascending triangle with a relatively flat top and a rising series of lows after the August 2024 low at $26.46. Targets could be up to around $44, but first we have to successfully clear and close over $36 and hold the level. The breakout this week for silver is somewhat momentous as we hit the highest level seen for silver since 2013. That’s a long wait. What’s interesting also is that silver rose as gold fell. That silver is leading is a positive sign. With silver’s fresh gains ahead of gold, the gold/silver ratio that topped out recently at 107.66 has now fallen to 92. Irrespective of this, that’s still quite high. We need to break firmly under 92 and then under 90 to suggest we could test the most recent low of 72.90 seen way back in May 2024. The ratio breaking over 100 was unusual as it was seen only once before when it hit its all-time high of 126 during the pandemic of 2020. After that the ratio collapsed to around 68 in early 2021 when there was a gold/silver rush out of the pandemic. To think about that level, we’d have to break under 75. Nonetheless, the action this past week was positive. Silver gained almost 9% to gold’s gain of 0.5%. Silver stocks responded with a good week as well. There may be some corrective action going forward this coming week, but ultimately, we should be headed higher.
Source: www.stockcharts.com
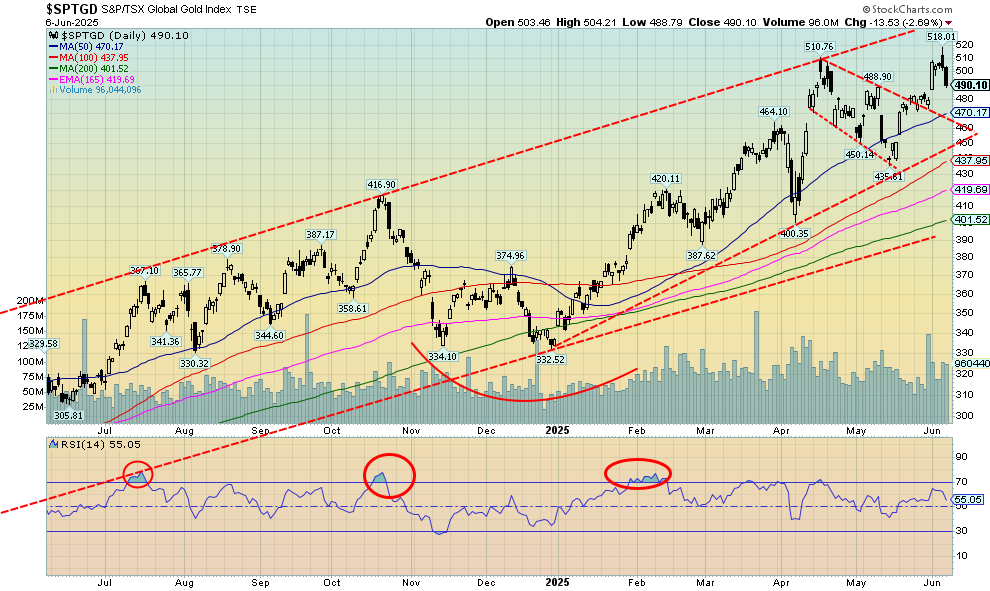
The TSX Gold Index (TGD) broke out of what appears as a bull flag, ran to fresh 52-week highs, then faced a barrage of profit-taking on Friday when gold fell even as silver rose. Still, the TGD held on to a 2.3% gain this past week. The Gold Bugs Index (HUI) fared better, up 5.3% also to fresh 52-week highs. If we have reason to be concerned, it’s that the RSI, along with some other indicators, is giving us negative divergences as we made the new highs. Negative divergences mean the indices (TGD, HUI) made new highs but the RSI and other indicators did not. Here is where support zones come into play. The TGD has support to 470 and 450, but a break under 450 could send us tumbling towards major long-term support near 400. A move towards 470 would be merely a test of the breakout from the flag pattern and be bullish. The flag formation projects a move to around 545. We expect that gold stocks are going higher, but the pullbacks can be steep sometimes. That pullback in October/November 2024 saw the TGD fall 20% while the recent pullback saw the TGD fall 14.7%.
Read the FULL report here: Technical Scoop: Bubble Result, Golden Haven, Weakening Labour
Disclaimer
David Chapman is not a registered advisory service and is not an exempt market dealer (EMD) nor a licensed financial advisor. He does not and cannot give individualised market advice. David Chapman has worked in the financial industry for over 40 years including large financial corporations, banks, and investment dealers. The information in this newsletter is intended only for informational and educational purposes. It should not be construed as an offer, a solicitation of an offer or sale of any security. Every effort is made to provide accurate and complete information. However, we cannot guarantee that there will be no errors. We make no claims, promises or guarantees about the accuracy, completeness, or adequacy of the contents of this commentary and expressly disclaim liability for errors and omissions in the contents of this commentary. David Chapman will always use his best efforts to ensure the accuracy and timeliness of all information. The reader assumes all risk when trading in securities and David Chapman advises consulting a licensed professional financial advisor or portfolio manager such as Enriched Investing Incorporated before proceeding with any trade or idea presented in this newsletter. David Chapman may own shares in companies mentioned in this newsletter. Before making an investment, prospective investors should review each security’s offering documents which summarize the objectives, fees, expenses and associated risks. David Chapman shares his ideas and opinions for informational and educational purposes only and expects the reader to perform due diligence before considering a position in any security. That includes consulting with your own licensed professional financial advisor such as Enriched Investing Incorporated. Performance is not guaranteed, values change frequently, and past performance may not be repeated.
About the author


Website: https://www.enrichedinvesting.com
Disclaimer: David Chapman is not a registered advisory service and is not an exempt market dealer (EMD) nor a licensed financial advisor. We do not and cannot give individualised market advice. David Chapman has worked in the financial industry for over 40 years including large financial corporations, banks, and investment dealers. The information in this newsletter is intended only for informational and educational purposes. It should not be considered a solicitation of an offer or sale of any security. The reader assumes all risk when trading in securities and David Chapman advises consulting a licensed professional financial advisor before proceeding with any trade or idea presented in this newsletter. David Chapman may own shares in companies mentioned in this newsletter. We share our ideas and opinions for informational and educational purposes only and expect the reader to perform due diligence before considering a position in any security. That includes consulting with your own licensed professional financial advisor.