Excerpt from this week's: Technical Scoop: Downgrade Signal, Tariff Bite, Risk On
Source: www.stockcharts.com
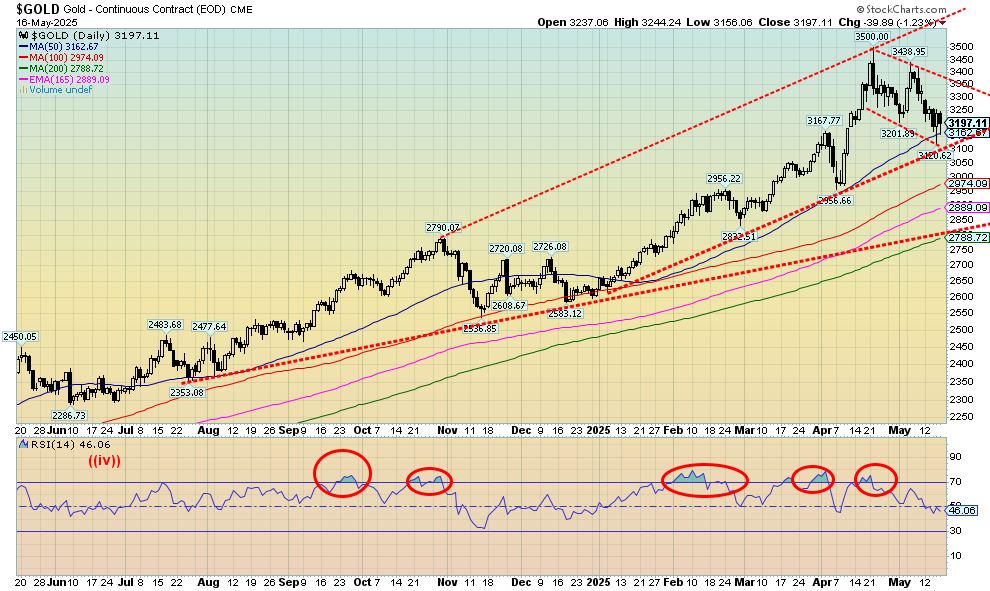
It was not a happy week for the gold bugs. Gold fell 4.0%. In a bit of a divergence silver fell only 1.6%. Platinum dropped 1.0%. The near precious metals saw palladium off 1.5% and copper down 1.3%. The gold stocks were dumped as the Gold Bugs Index (HUI) fell 8.6% and the TSX Gold Index (TGD) fell 7.9%. Despite the declines, everyone remains up in 2025. Gold is up 21.1% and silver, which is lagging, is up 10.3%. We can’t help but note we came down from overbought levels in April when we hit the $3,500 high. If there is anything encouraging about this drop, it’s that we could be forming a bull flag. It breaks out above $3,350 and projects up to $3,730. But if we break under $3,100, we could go the other way. Below that support is around $2,950/$2,975. Long-term support is seen near $2,780.
Gold is struggling because of the pause in the trade wars (note we say “pause,” not the end of them), some still okay economic numbers, few signs yet of rising unemployment, elevated interest rates, and no signs the Fed is ready to cut interest rates any time soon. All somewhat dampening for gold prices as safe haven demand eases. Add in possible eases in tensions with an Iranian nuclear deal, Russia/Ukraine supposedly talking, and U.S./Syria making up. Still, there are military tensions between China/U.S. and now even Russia/EU.
We remain long-term bullish on gold but are currently short-term cautious. We are in a seasonally weaker period for gold. We could see a bottom this month, but more likely into June and even July before we make our bottom. After that another rise could get underway. Our preference is we hold levels near $3,100 but can’t rule out a drop to $2,950. We try to remain cool about forecasts of gold to $5,000.
Source: www.stockcharts.com
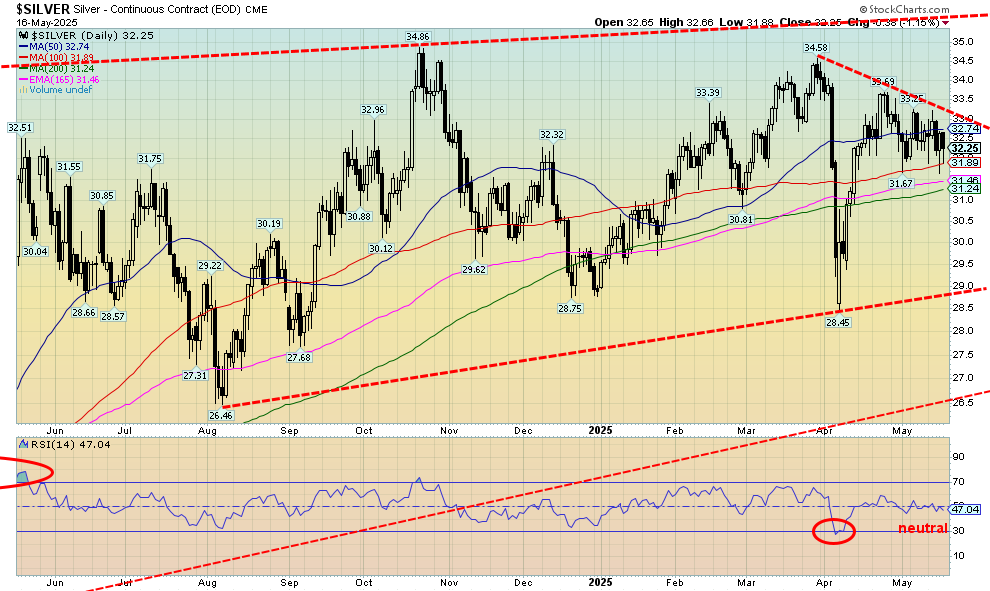
Silver took a hit this past week but if we want to feel encouraged, we note that silver prices did not fall as much as gold prices. A divergence? Silver fell 1.6% vs. a 4% drop for gold. Silver stocks did poorly as Wheaton Precious Metals (WPM), the largest silver company by market cap, fell 8.2%. Nonetheless, the divergence with gold was welcomed. Arguably, we could say silver is forming a bull flag. However, we remain below that elusive $35 breakout. We now believe we need to break above $36 to convince us we are breaking out. We still look like we could be making a rising, ascending triangle that once firmly over $36 projects up to $44. We try to ignore the crazy projections that silver will rise to $300 or even $500. Maybe they are right, but right now a breakout over $36 would be most welcome. We would like to stay above $31.25, but below that under $30.80 spells some trouble. We could fall further. That $29 support line is a way off.
Source: www.stockcharts.com
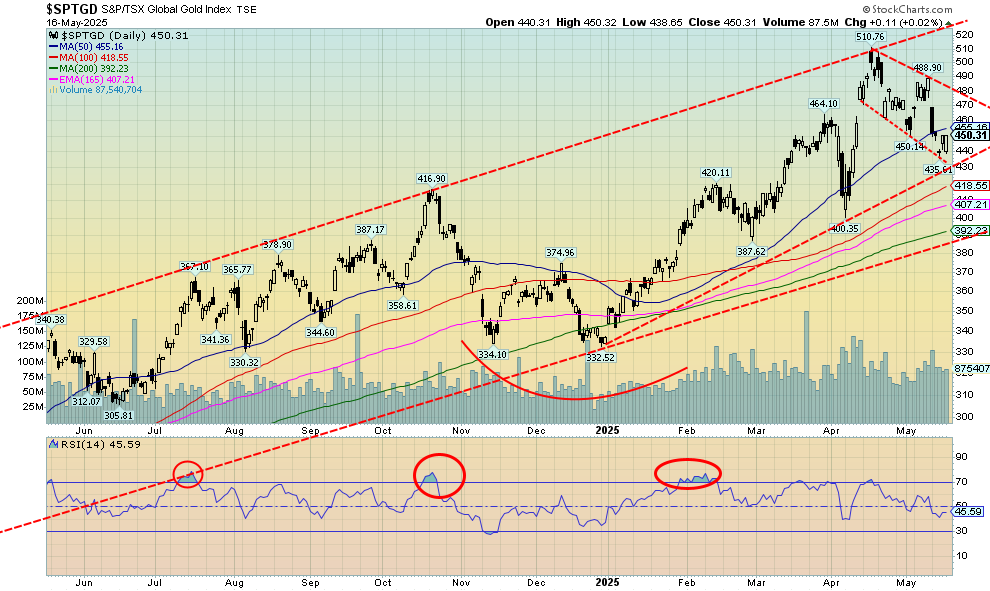
It was an ouch week for the gold stocks. Okay, they had been falling from overbought levels. We’re down almost 12% from that April high. Pullbacks within the context of a bull market are normal and healthy. We are fast approaching support for the TSX Gold Index (TGD) near 430. Are we also forming a flag formation? If so, that could be bullish if we break firmly above 480. That projects up to 556. On the week, the TGD fell 7.9% while the Gold Bugs Index (HUI) was down 8.6%. Both remain a healthy up in 2025 with the TGD still up 33.7% and the HUI up 32.8%. We can’t help notice we are not as yet oversold so a fall to that support near 430 remains very possible. We’d prefer not to see that break as the next stop could be down to 390 and the 200-day MA. We just can’t rule it out. A move above 455 would give some hope of higher prices. We need to get above 493 to suggest new highs. We also note that March low near 400 as a possible support.
We remain longer term bullish on the gold stocks, but a pause now doesn’t hurt. Only below 380 would we have to reconsider the bull market.
Read the FULL report here: Technical Scoop: Downgrade Signal, Tariff Bite, Risk On
Disclaimer
David Chapman is not a registered advisory service and is not an exempt market dealer (EMD) nor a licensed financial advisor. He does not and cannot give individualised market advice. David Chapman has worked in the financial industry for over 40 years including large financial corporations, banks, and investment dealers. The information in this newsletter is intended only for informational and educational purposes. It should not be construed as an offer, a solicitation of an offer or sale of any security. Every effort is made to provide accurate and complete information. However, we cannot guarantee that there will be no errors. We make no claims, promises or guarantees about the accuracy, completeness, or adequacy of the contents of this commentary and expressly disclaim liability for errors and omissions in the contents of this commentary. David Chapman will always use his best efforts to ensure the accuracy and timeliness of all information. The reader assumes all risk when trading in securities and David Chapman advises consulting a licensed professional financial advisor or portfolio manager such as Enriched Investing Incorporated before proceeding with any trade or idea presented in this newsletter. David Chapman may own shares in companies mentioned in this newsletter. Before making an investment, prospective investors should review each security’s offering documents which summarize the objectives, fees, expenses and associated risks. David Chapman shares his ideas and opinions for informational and educational purposes only and expects the reader to perform due diligence before considering a position in any security. That includes consulting with your own licensed professional financial advisor such as Enriched Investing Incorporated. Performance is not guaranteed, values change frequently, and past performance may not be repeated.
About the author


Website: https://www.enrichedinvesting.com
Disclaimer: David Chapman is not a registered advisory service and is not an exempt market dealer (EMD) nor a licensed financial advisor. We do not and cannot give individualised market advice. David Chapman has worked in the financial industry for over 40 years including large financial corporations, banks, and investment dealers. The information in this newsletter is intended only for informational and educational purposes. It should not be considered a solicitation of an offer or sale of any security. The reader assumes all risk when trading in securities and David Chapman advises consulting a licensed professional financial advisor before proceeding with any trade or idea presented in this newsletter. David Chapman may own shares in companies mentioned in this newsletter. We share our ideas and opinions for informational and educational purposes only and expect the reader to perform due diligence before considering a position in any security. That includes consulting with your own licensed professional financial advisor.