Excerpt from this week's: Technical Scoop: Grudging gains, five P’s, reserves rise, holdings fall, Dollar declines, golden equity, negative energy, cap talk
Gold was boringly flat this past week. With not much in the way of drivers for the price, no wonder it just meandered. Yes, the falling US$ Index should have helped, but gold didn’t respond. That might turn out to be a negative sign going forward. Gold was also helped by talk that the Fed might ease up on its rate hikes. But again, if that is correct, then gold should have responded more robustly. Otherwise, maybe the lethargic trading was just the result of the holiday week.
We noted that gold completed what looks like a nine-wave down pattern. But sometimes these can turn into 13-wave declines. The question is whether gold’s current rally is about to be aborted. Silver and gold stocks leading may be positive, but could also be a head fake. While we broke above some key points, more important points to break loom above. The 200-day MA is $1,804 so we must take that out, also take out $1,825, and more importantly $1,875 to tell us we are going higher. While demand has been good and central banks have been buyers, the COVID lockdowns in China are hurting gold there as demand falls. Also, high interest rates are negative for non-yielding gold. Gold rose 10.7% from that low of $1,618 to the recent high of $1,791. Noticeably, it failed just $1,800, a key point we noted.
Support is down $1,720 (low this week was $1,719), but under that level we could fall to $1,690/$1,700. Under $1,660 new lows could be seen under $1,618. We still have potentially unfilled targets down to around $1,500. Silver gained 2.1% this past week, platinum was up 0.4%, but of the near precious metals, palladium fell 6.1% and copper was flat. The gold stock indices rose with the Gold Bugs Index (HUI) up 3.9% and the TSX Gold Index (TGD) up 3.4%.
Given the holiday week, the CBOE does not release its COT report until Monday.
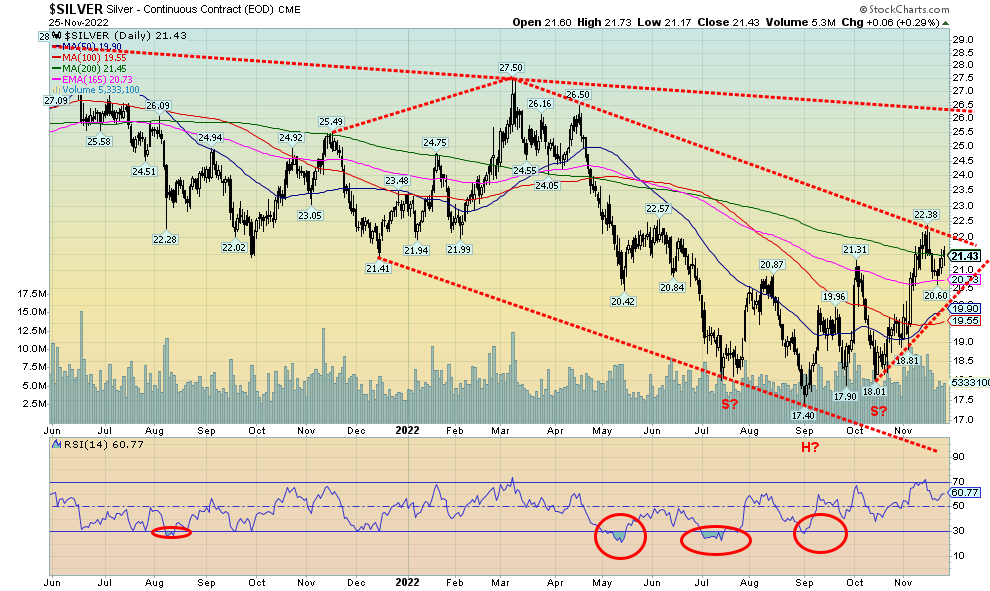
Source: www.stockcharts.com
Silver prices rose 0.4% this past week, outpacing gold. If precious metals prices are to go higher, we need to see silver leading the way. Silver is still down 8.2% on the year vs. gold down 4.1%. That gap has narrowed considerably over the past few weeks as silver prices outpace gold prices. The gold/silver ratio has fallen to 81.4 down from a high of 98.3 seen in August 2022. That is still well off the low of 64.3 seen in May 2021. Silver has a way to go. New lows for the gold/silver ratio under 75 could send the ratio down towards 70. Silver has been very choppy the past few months and appears to have possibly formed a head and shoulders bottom pattern. If the pattern is correct, then we have broken out and the potential target is up to $26/$26.50. That would coincide with that major resistance line seen on the charts that comes off the March 2022 high of $27.50.
What’s key for the current pattern is we take out that recent high of $22.38 seen on November 15. If that failed and we broke back under $20.60, we could see a decline instead that re-test the lows. Below $18.80 the H&S pattern is busted and below $18.55 new lows are probable. We note that Elliott Wave International is bearish on silver and they expect to see new lows and a test of the March 2020 low of $11.62. Is it possible?
Yes, given our thoughts on longer-term cycle lows we have often noted. Right now, we need to see a break over $22 and, as noted, new highs above $22.38 to keep alive thoughts we are breaking out.
Read the entire report: Technical Scoop: Grudging gains, five P’s, reserves rise, holdings fall, Dollar declines, golden equity, negative energy, cap talk
Disclaimer
David Chapman is not a registered advisory service and is not an exempt market dealer (EMD) nor a licensed financial advisor. He does not and cannot give individualised market advice. David Chapman has worked in the financial industry for over 40 years including large financial corporations, banks, and investment dealers. The information in this newsletter is intended only for informational and educational purposes. It should not be construed as an offer, a solicitation of an offer or sale of any security. Every effort is made to provide accurate and complete information. However, we cannot guarantee that there will be no errors. We make no claims, promises or guarantees about the accuracy, completeness, or adequacy of the contents of this commentary and expressly disclaim liability for errors and omissions in the contents of this commentary. David Chapman will always use his best efforts to ensure the accuracy and timeliness of all information. The reader assumes all risk when trading in securities and David Chapman advises consulting a licensed professional financial advisor or portfolio manager such as Enriched Investing Incorporated before proceeding with any trade or idea presented in this newsletter. David Chapman may own shares in companies mentioned in this newsletter. Before making an investment, prospective investors should review each security’s offering documents which summarize the objectives, fees, expenses and associated risks. David Chapman shares his ideas and opinions for informational and educational purposes only and expects the reader to perform due diligence before considering a position in any security. That includes consulting with your own licensed professional financial advisor such as Enriched Investing Incorporated. Performance is not guaranteed, values change frequently, and past performance may not be repeated.
About the author


Website: https://www.enrichedinvesting.com
Disclaimer: David Chapman is not a registered advisory service and is not an exempt market dealer (EMD) nor a licensed financial advisor. We do not and cannot give individualised market advice. David Chapman has worked in the financial industry for over 40 years including large financial corporations, banks, and investment dealers. The information in this newsletter is intended only for informational and educational purposes. It should not be considered a solicitation of an offer or sale of any security. The reader assumes all risk when trading in securities and David Chapman advises consulting a licensed professional financial advisor before proceeding with any trade or idea presented in this newsletter. David Chapman may own shares in companies mentioned in this newsletter. We share our ideas and opinions for informational and educational purposes only and expect the reader to perform due diligence before considering a position in any security. That includes consulting with your own licensed professional financial advisor.