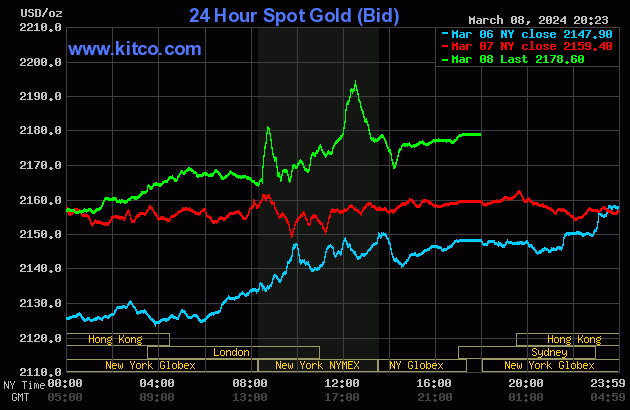
Gold's quiet rally that began at the start of Globex trading in New York on Thursday evening was turned lower around 8:40 a.m. China Standard Time on their Friday morning -- and its low tick was set at exactly 11 a.m. CST. It then wandered quietly higher until at or minutes before the 10:30 a.m. morning gold fix in London -- and was sold a tiny bit lower from there until the jobs number hit the tape. The gold price went 'no ask' -- and 'da boyz' appeared in seconds -- and had the price back to its pre-8:30 a.m. price by 9:15 a.m. It crawled quietly higher from there until it took off anew starting a few minutes before 12 o'clock noon -- and the commercial traders of whatever stripe reappeared -- engineering it brutally lower until around 2:15 p.m. in after-hours trading in New York. Its ensuing rally ran into 'something' about fifteen minutes later-- and from that juncture it crept very quietly higher until the market closed at 5:00 p.m. EST.
The low and high ticks in gold were recorded by the CME Group as $2,161.20 and $2,203.00 in the April contract. The April/June price spread differential in gold at the close in New York yesterday was $20.80...June/August was $19.00...August/October was $18.60 -- and October/December was $18.50 an ounce.
Gold was closed in New York on Friday afternoon at $2,178.60 spot, up another $19.20 from Thursday -- and about 16 bucks off its Kitco-recorded high tick. Net volume was monstrous once again at 275,000 contracts -- and there were an eye-watering 115,000 contracts worth of roll-over/switch volume out of April and into future months...mostly into June, but with noticeable amounts into August and December as well.
I saw that 259 gold, plus 115 silver contracts were traded in March yesterday, so it will be interesting to see what that translates into in this evening's Daily Delivery and Preliminary Reports.
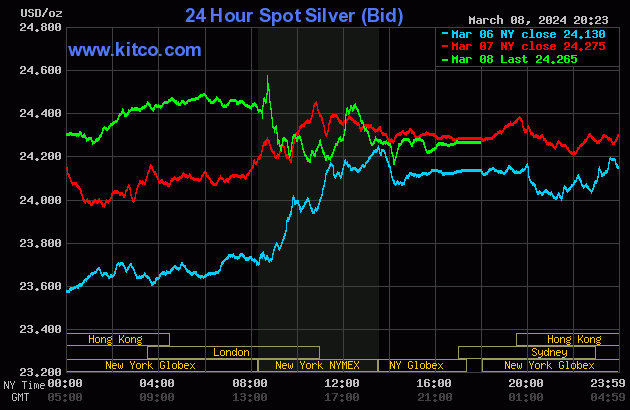
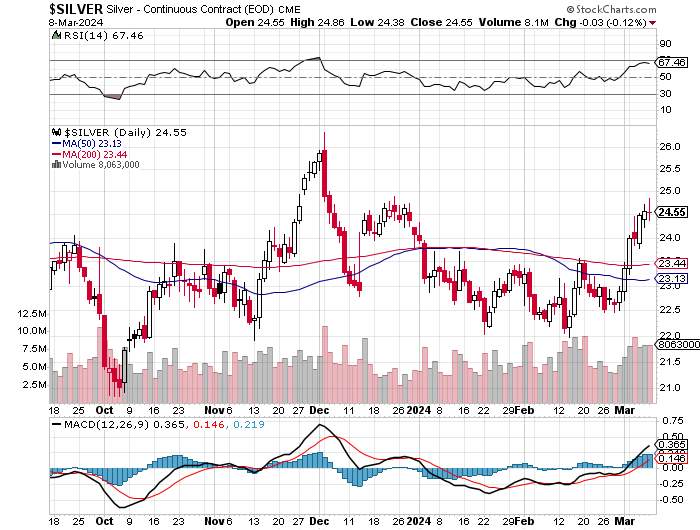
Silver's decent rally attempt in very early Globex trading on Thursday evening in New York met the same fate as gold's -- and it was also sold lower until 11 a.m. China Standard Time on their Friday morning. It then wandered a bit higher until 11 a.m. in London -- and was sold a bit lower until the jobs number showed up at 8:30 a.m. in COMEX trading in New York. Its spike higher ran into 'da boyz' as well -- and its price was brutally suppressed after that, with its low tick of the day set around 2:10 p.m. in after-hours trading. It recovered a bit from there in short order, but was then forced to trade sideways until the market closed at 5:00 p.m. EST.
The high and low ticks in silver, both of which were set in New York, were reported as $24.86 and $24.38 in the May contract. The March/May price spread differential in silver at the close in New York yesterday was 21.0 cents...May/July was 22.4 cents...July/September was 21.9 cents -- and September/December was 30.8 cents an ounce.
Silver was closed in New York on Friday afternoon at $24.265 spot, down a penny on the day -- and 22.5 cents off its Kitco-recorded high tick. Net volume was certainly on the heavier side at 80,500 contracts -- and there were a bit over 5,000 contracts worth of roll-over/switch volume on top of that in this precious metal...mostly into July and September.
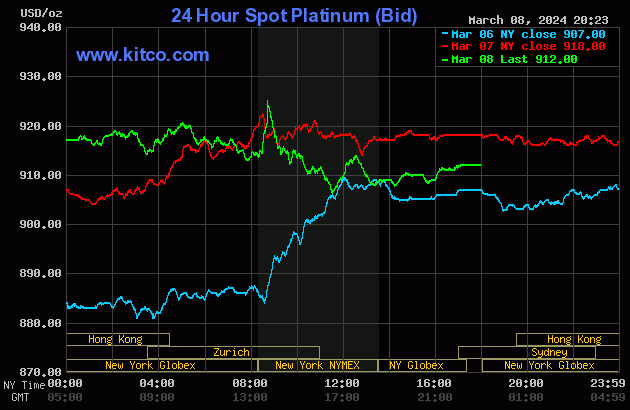
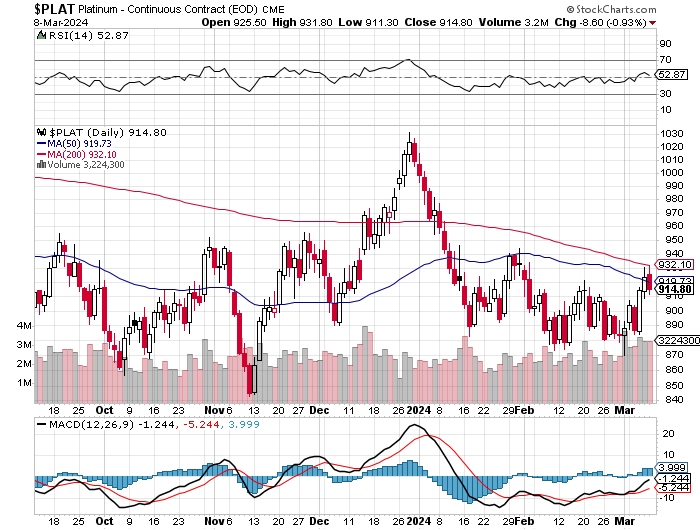
Platinum wandered very quietly sideways to a hair lower in Globex trading on Friday. It also jumped higher at the release of the jobs number -- and from that juncture its price was managed in a similar fashion as silver's. It was closed at $912 spot, down 6 bucks on the day.
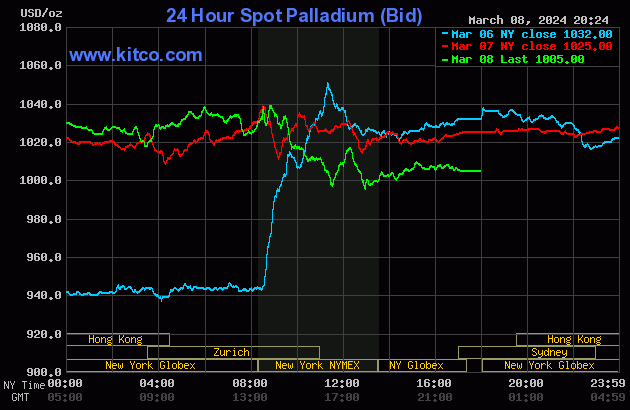
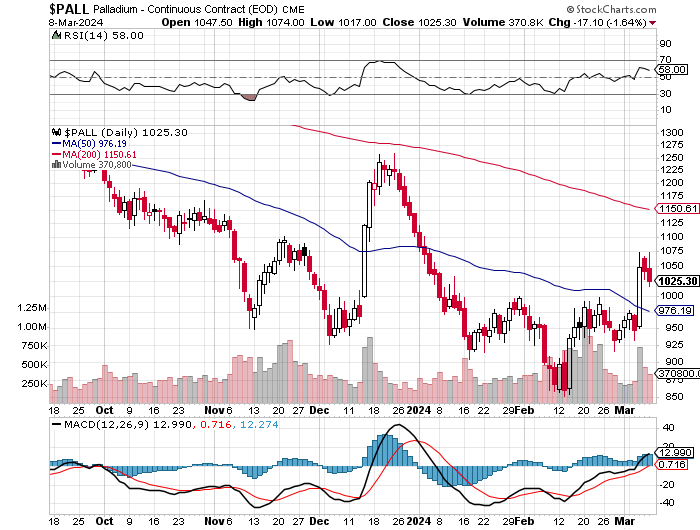
Palladium wandered somewhat broadly sideways until it too ran into 'something' at 8:30 a.m. in New York. Twenty or so minutes after that, the engineered price decline commenced in it -- and it was sold unevenly lower until 1 p.m. in COMEX trading. It crawled a bit higher for the next two hours and a bit, before trading sideways until the market closed at 5:00 p.m. EST. Palladium was closed at $1,005 spot, down 20 dollars on the day.
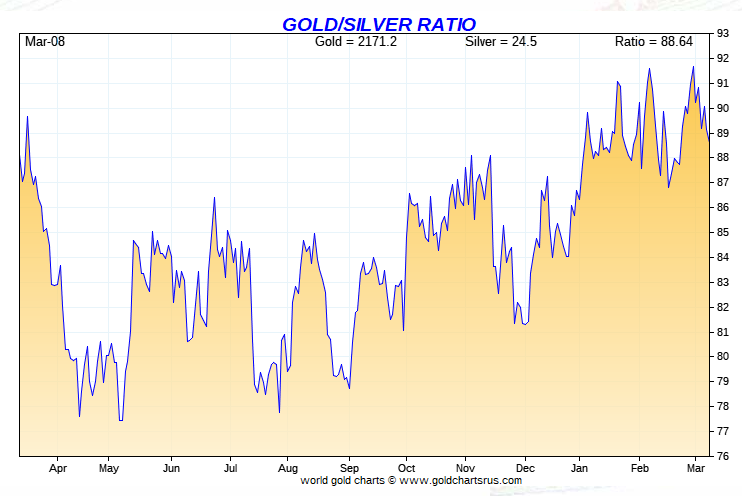
Based on the kitco.com spot closing prices in silver and gold posted above, the gold/silver ratio worked out to 89.8 to 1 on Friday...compared to 89.0 to 1 on Thursday.
Here's the 1-year Gold/Silver Ratio Chart, thanks to Nick Laird and, as always, the Friday data point is not on it for whatever reason. Click to enlarge.
![]()
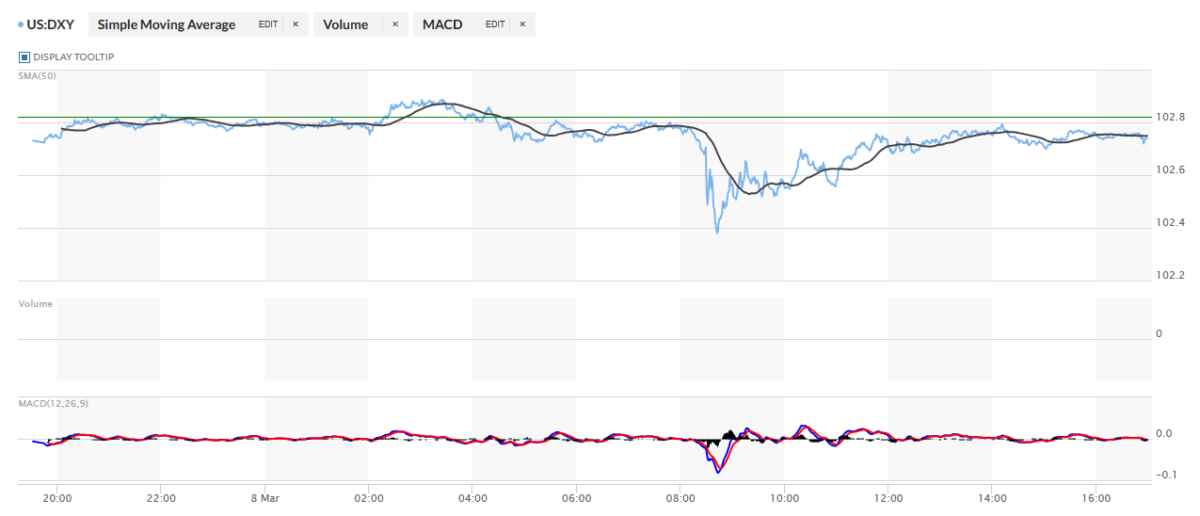
The dollar index closed very late on Thursday afternoon in New York at 102.82 -- and then opened lower by 9 basis points once trading commenced at 7:32 p.m. EST on Thursday evening, which was 8:32 a.m. China Standard Time on their Friday morning. It then had a very broad and quiet up/down move centered around 8:25 a.m. in London. The trap door opened at 8:30 a.m. in New York -- and it was obvious that the PPT were there to prevent its total collapse...with its ensuing and choppy 'rally' ended around 2:10 p.m. EST. It was sold a couple of basis points lower from there until the market closed at 5:00 p.m.
The dollar index closed very late on Friday afternoon in New York at 102.71...down 11 basis points from its close on Thursday.
Here's the DXY chart for Friday...thanks to marketwatch.com as usual. Click to enlarge.
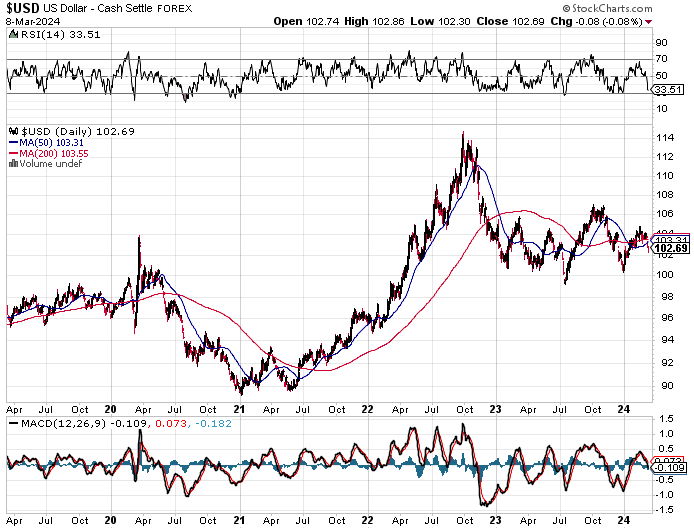
And here's the 5-year U.S. dollar index chart that appears in this spot every Saturday, courtesy of stockcharts.com as always. The delta between its close...102.69...and the close on the DXY chart above, was 2 basis points below its spot close. Click to enlarge.
You can bet your last dollar that the PPT was standing at the ready when the jobs number hit the street at 8:30 a.m. on Friday morning...rescuing the DXY from potential oblivion -- and keeping a lid on precious metal prices.
Here's the 5-year 10-year U.S. Treasury chart from the yahoo.com Internet site -- which puts the yield curve into a somewhat longer-term perspective. Click to enlarge.
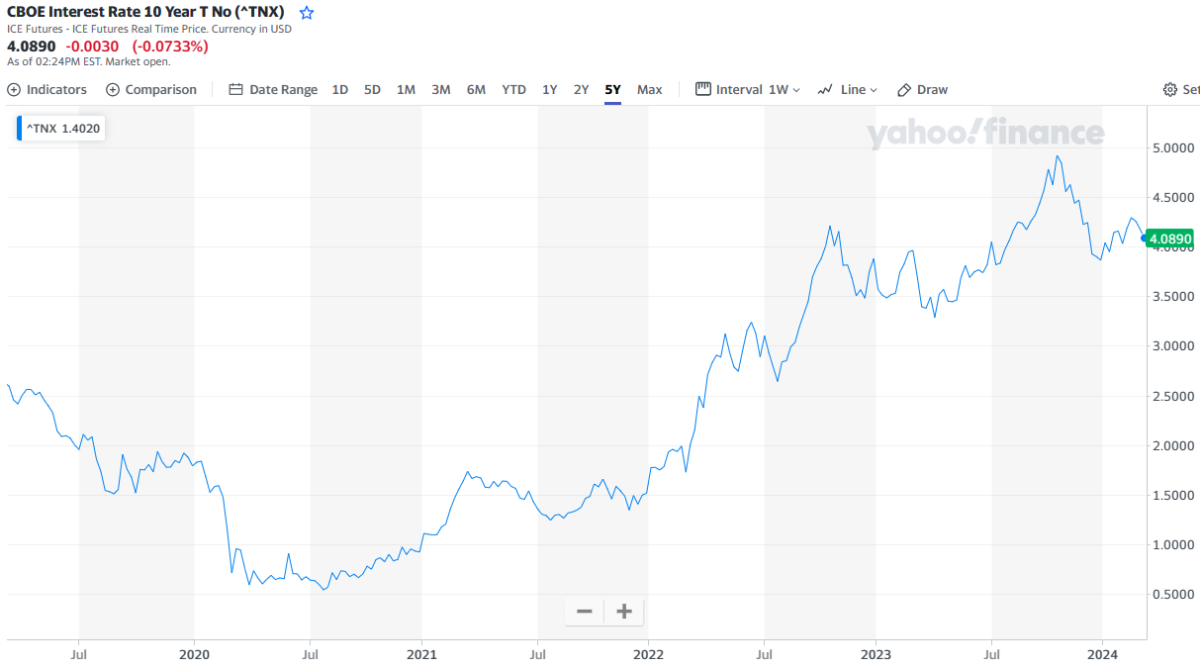
The Fed was pretty active in the treasury market this past week -- and the 10-year is down a decent amount...but the trend, for the moment, is still higher over the longer term.
![]()
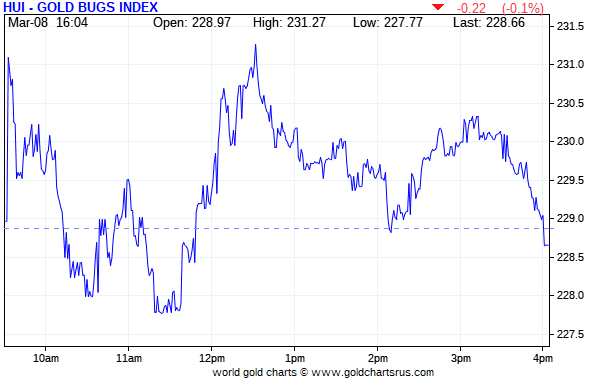
The gold shares ticked a bit higher once the markets opened at 9:30 a.m. EST on Friday morning in New York, but were sold into negative territory shortly after that. From there it had a broad up/down move centered around 12:30 p.m. -- and the HUI actually closed down on the day by 0.10 percent.
Computed manually, the new Silver Sentiment/Silver 12 Index finished the day down 1.09 percent.
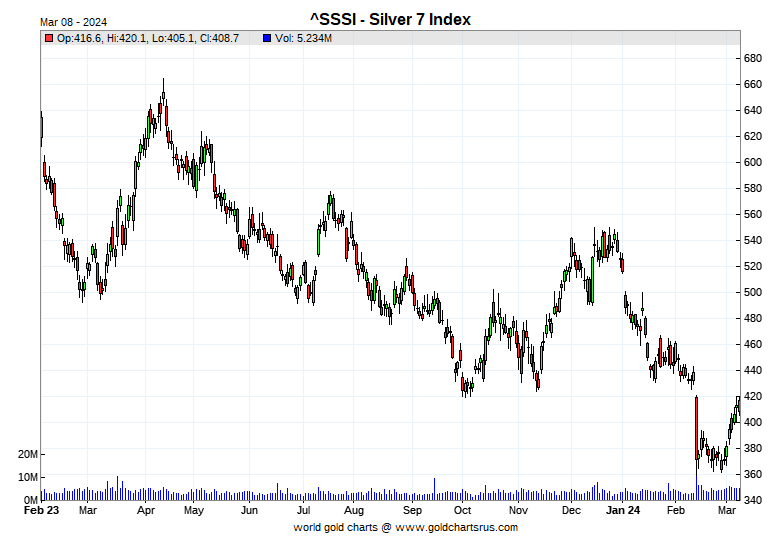
Here's Nick's old 1-year Silver Sentiment/Silver 7 Index chart, updated with Friday's candle. Click to enlarge.
The star yesterday was Wheaton Precious Metals, closing up on the day by 1.04 percent -- and the biggest underperformer was SSR Mining, as it closed down 4.02 percent.
Two things I did notice were that GLD and SLV traded way above average volumes yesterday. In GLD it was just about 100 percent above average -- and in SLV it was 66 percent over. The other thing was that most of the larger-cap silver stocks were up on the day in after-hours trading.
The reddit.com/Wallstreetsilver website, now under 'new' but not improved management, is linked here. The link to two other silver forums are here -- and here.
![]()
Here are the three usual charts that appear in every weekend missive. They show the changes in gold, silver, platinum and palladium in both percent and dollar and cents terms, as of their Friday closes in New York — along with the changes in the HUI and the old Silver 7 Index.
Here's the weekly chart -- and it's an eye-pleasing wall-to-wall green. Although the precious metal equities are showing some signs of life, they're still vastly underperforming. Click to enlarge.
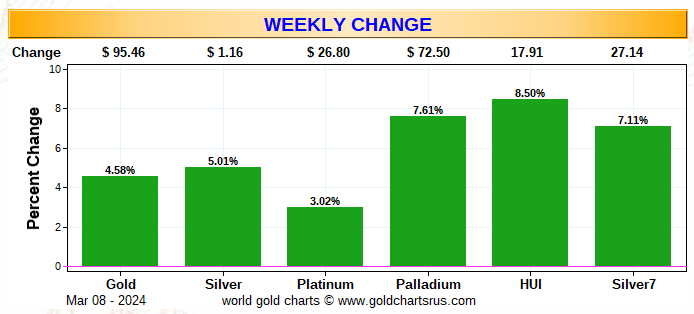
Here's the month-to-date chart -- and it only includes one extra day...Friday, March 1. The same can be said of it, that was said about the weekly chart...with the gold shares outperforming their silver cousins.
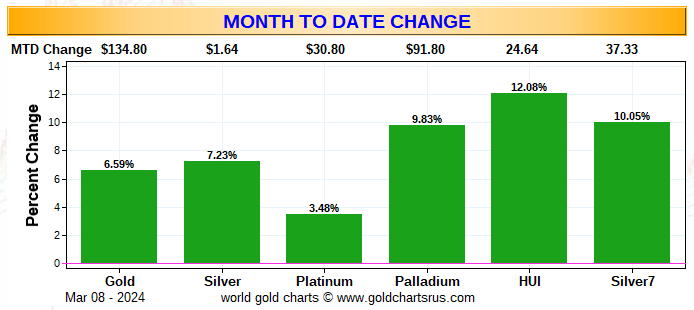
Here's the year-to-date chart -- and now silver is back in the green by a bit. It remains to be seen how long everything else takes to recover...the precious metal equities in particular, especially the silver stocks...as they're unloved and hugely undervalued at the moment. That recent 50% haircut in SSR Mining is still the overriding factor as far as the Silver7 Index is concerned. Click to enlarge.
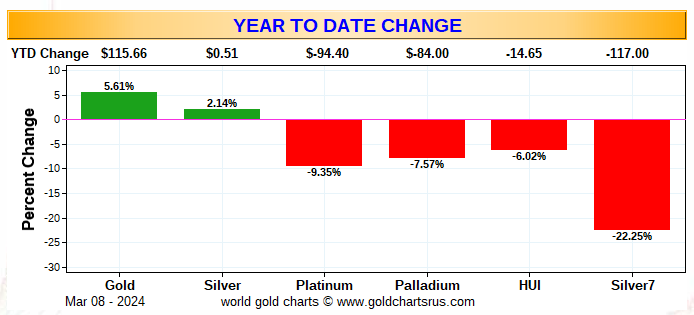
Of course -- and as I mention in this spot every Saturday -- and will continue to do so...is that if the silver price was sitting a few dollars above its old high of $50 the ounce...like gold is currently sitting at its new high of $2,178 the ounce...it's a given that the silver equities would be outperforming their golden cousins by an absolute country mile.
![]()
The CME Daily Delivery Report for Day 8 of March deliveries showed that 1,567 gold -- and only 61 silver contracts were posted for delivery within the COMEX-approved depositories on Tuesday.
In gold, the only short/issuer of the five in total that mattered was BofA Securities, issuing 1,533 contracts out of its house account. There were eight long/stoppers in total -- and the three biggest by far were Wells Fargo Securities, JPMorgan and Canada's Scotia Capital/Scotiabank, as they picked up 176, 110 and 99 contracts...JPMorgan for their client account. Next down the list were Advantage and British bank HSBC, stopping 83 and 73 contracts for their respective client accounts.
In silver, the three short/issuers were Morgan Stanley, Advantage and ADM, issuing 49, 7 and 5 contracts from their respective client accounts. The two long/stoppers were Canada's Scotia Capital and the CME Group, picking up 49 and 12 contracts for their respective house accounts.
The CME Group re-issued their contracts as 5x12=60 of those one-thousand ounce good delivery bar micro silver futures contracts, with Morgan Stanley, Advantage and ADM picking up 29, 24 and 7 of those contracts for their respective client accounts.
In palladium, there was 1 contract issued and stopped.
The link to yesterday's Issuers and Stoppers Report is here.
Month-to-date so far there have been a hefty 3,926 COMEX gold contracts issued and stopped -- and in silver that number is 4,985 contracts. In platinum it's 56 contracts -- and in palladium...81.
The CME Preliminary Report for the Friday trading session showed that gold open interest in March rose by 93 contracts, leaving 1,885 still around, minus the 1,567 contracts mentioned a whole bunch of paragraphs ago. Thursday's Daily Delivery Report showed that 118 gold contracts were actually posted for delivery on Monday, so that means that 118+93=211 more gold contracts were added to March deliveries.
Silver o.i. in March dropped by 305 COMEX contracts, leaving 292 still open, minus the 61 contracts mentioned a bunch of paragraphs ago. Thursday's Daily Delivery Report showed that 349 silver contracts were actually posted for delivery on Monday, so that means that 349-305=44 more silver contracts were added to the March delivery month.
Total gold open interest at the close on Friday rose by another mind-boggling amount, this time by 28,426 COMEX contracts -- but total silver o.i. fell by 532 contracts.
Both these numbers are subject to some minor revisions by the time the final figures are posted on the CME's website later on Monday morning CDT.
![]()
There were yet more counterintuitive withdrawals from both GLD and SLV on Friday, as 46,301 troy ounces of gold were taken out of the former -- and a further 2,195,241 troy ounces of silver disappeared from the latter.
The demand for physical metal must be ferocious, as these withdrawals are not investor-related at all. Precious metals should be pouring into both on these rallies, but they're not.
In silver alone, there has been 14,762,464 troy ounces withdrawn since the last deposit was made into SLV on February 27.
In other gold and silver ETFs and mutual funds on Planet Earth on Friday, net of any changes in COMEX, GLD and SLV inventories, there were finally some net deposits in gold, as 143,675 troy ounce of the stuff were added, but a net 546,271 troy ounces of silver were removed...involving six different depositories, with the largest amount being the 200,208 troy ounces that left Sprott's PSLV.
There was no sales report from the U.S. Mint.
Month-to-date there has only been one sales report from the mint so far -- and that was earlier this week. They reported selling 6,500 troy ounces of gold eagles --- 2,500 one-ounce 24K gold buffaloes -- and 802,000 silver eagles.
![]()
There was some activity in gold over at the COMEX-approved depositories on the U.S. east coast on Thursday. Nothing was reported received yet again -- and 55,390 troy ounces were shipped out.
In the 'out' category, the largest amount were the 30,575.610 troy ounces/951 kilobars the left Brink's, Inc...with the remaining 24,814 troy ounces departing Asahi.
The only paper activity were the 315 kilobars/10,127.565 troy ounces that were transferred from the Registered category and back into Eligible over at JPMorgan.
The link to Thursday's COMEX activity in gold, is here.
There was fairly decent silver action, as 986,567 troy ounces were received, but only 65,793 troy ounces were shipped out...with all of the 'out' activity taking place over at Brink's, Inc.
In the 'in' category, the largest amount was the one truckload/593,634 troy ounces that arrived at Asahi...with the remaining 392,933 troy ounces getting dropped off at Brink's, Inc.
There was no paper activity -- and the link to Thursday's silver action is here.
It was another pretty enormous day over at the COMEX-approved gold kilobar depositories in Hong Kong on their Thursday. There were 5,709 kilobars received -- but only 58 were shipped out. Except for the 50 kilobars that left Loomis International, the remaining in/out activity took place over at Brink's, Inc. as always. The link to this, in troy ounces, is here.
![]()
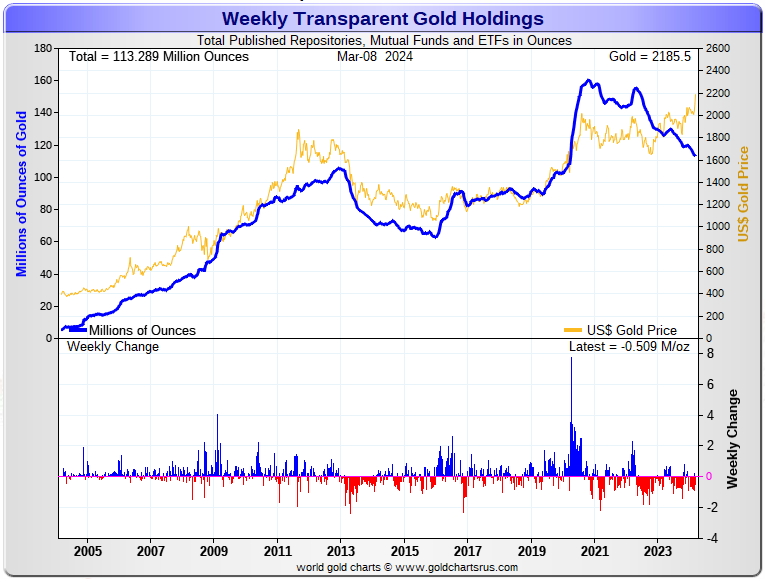
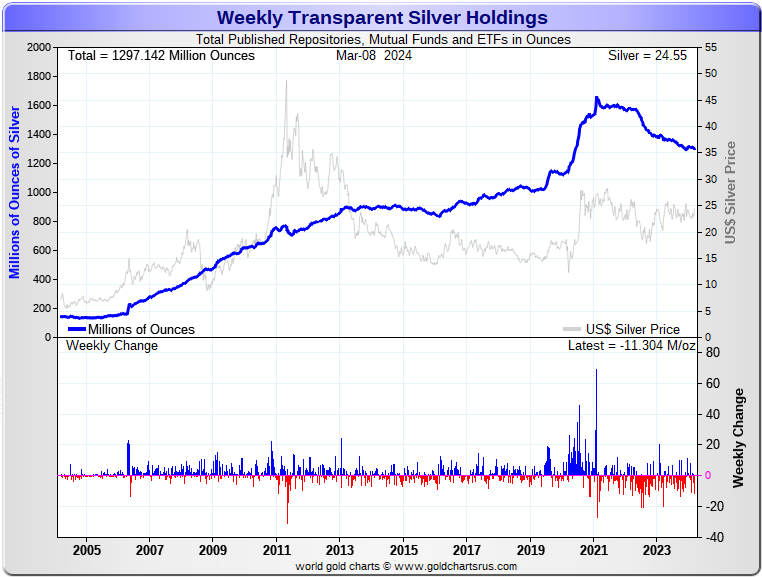
Here are the usual 20-year charts that show up in this space in every Saturday column. They show the total amounts of physical gold and silver held in all know depositories, ETFs and mutual funds as of the close of business on Friday.
During the week just past, there were a net 509,000 troy ounces of gold taken out -- and a net 11.304 million troy ounces of silver were removed as well...almost all of that amount from SLV.
According to Nick Laird's data on his website, there were a net 1.612 million troy ounces of goldremoved -- plus a net 12.681 million troy ounces of silver were also taken out from all the world's known depositories, mutual funds and ETFs during the last four weeks.
In gold, the only two ETFs showing deposits worthy of the name were Deutsche Bank and iShares/SGLN...as they added 190,000 and 64,000 troy ounces respectively. The largest 'out' amount were the 843,000 troy ounces that left the GLD/GLDM. In second place was the COMEX...shedding 343,000 troy ounces. In third and fourth place were XetraGold and Source/SGLD... showing 180,000 and 124,000 troy ounces removed respectively. The 'out' list goes on and on...and on...
In silver, the largest 'in' amount were the 10.613 million troy ounces added to the COMEX -- and the only other depository showing an 'in' amount was Source/SSLV, as they added 723,000 troy ounces. The hand's down largest 'out' amount were the 19.291 million troy ounces taken out of the iShares/SLV. In second and third spots -- and way down the list, were the 1.681 and 1.074 million troy ounces that were shipped out of ZKB and ETF Securities/SIVR respectively. Then there were the 801,000 troy ounces that left Sprott's PSLV. The 'out' list goes on and on here by a bit as well.
Retail bullion sales remain in the dumpster...but have shown signs of life this past week. Dealers have lots of inventory in everything -- and premiums are ultra low in most [but not all] places. When retail investment demand picks up for real once again...which it most certainly will... it will be back to shortages/back orders and high premiums in short order.
And that's not taking into account the mind-boggling quantities of silver that will be required by all the silver ETFs and mutual funds...although that demand has failed to materialize as of yet -- and "Why Not?" is the question of the day. If and when it does show up, it will come courtesy of JPMorgan.
Where will all this physical metal come from in the face of this ongoing and deepening structural physical deficit, one has to wonder, as it just won't be there at some point...although JPMorgan & Friends are sitting on a goodly amount of the stuff according to Ted.
And as he stated very recently, it would appear [according to Ted] that they have parted with at least 500 million troy ounces of silver over the last three years, of the at least one billion troy ounces that they'd accumulated since 2011.
If they continue in this vein, they are going to have to cough up more ounces to feed this year's deficit...another 176 million of them according to that latest report from The Silver Institute.
The physical demand in silver at the wholesale level continues unabated -- and that was on display again this week...with the poster child for that being the copious amounts that left SLV.
Almost all of what's left in the various public ETFs and mutual funds is not available for sale...including the COMEX and SLV, where new silver has to be brought in from other sources [JPMorgan] to meet the ongoing demand for physical metal, as just mentioned. This will continue until available supplies are depleted...which will be the moment that JPMorgan & Friends stop selling into the deepening structural deficit.
The vast majority of precious metals being held in these depositories are by those who won't be selling until the silver price is many multiples of what it is today. That's particularly true of shareholders in PSLV...despite the redemptions of the past week and a bit.
Sprott's PSLV is the third largest depository of silver on Planet Earth with 170 million troy ounces -- and some distance behind the COMEX, where there are 285 million troy ounces being held.
However, it's now been proven beyond a reasonable shadow of a doubt that 103 million troy ounces of that amount in the COMEX is actually held in trust for SLV by JPMorgan according to letter Ted received from the CFTC a week or so ago. That brings JPMorgan's actual silver warehouse stocks down to the 27 million mark...quite bit different than the 130 million they indicate they have.
But PSLV is still some distance behind SLV, as they are the largest silver depository, with 418 million troy ounces as of Friday's close.
The latest short report from a week ago Tuesday showed that the short position in SLV rose by 20.02 percent...up to 15.13 million shares sold short. BlackRock issued a warning a few years ago to all those short SLV, that there might come a time when there wouldn't be enough metal for them to cover. That would only be true if JPMorgan decides not to supply it to whatever entity requires it.
The next short report will be posted on The Wall Street Journal's website on Monday, March 11.
Then there's that other little matter of the 1-billion ounce short position in silver held by Bank of America in the OTC market...with JPMorgan & Friends on the long side. Ted says it hasn't gone away -- and he's also come to the conclusion that they're also short around 30 million ounces of gold with these same parties as well...down 7 million oz. from the 37 million they were short in the June OCC Report. The latest report from the OCC for Q3/2023 came out almost three months ago now -- and based on what was in it, Ted hasn't changed his mind on this one iota. He said so again in his mid-week commentary for his paying subscribers a couple of weeks back. The next report from the OCC should be out in about two weeks.
![]()
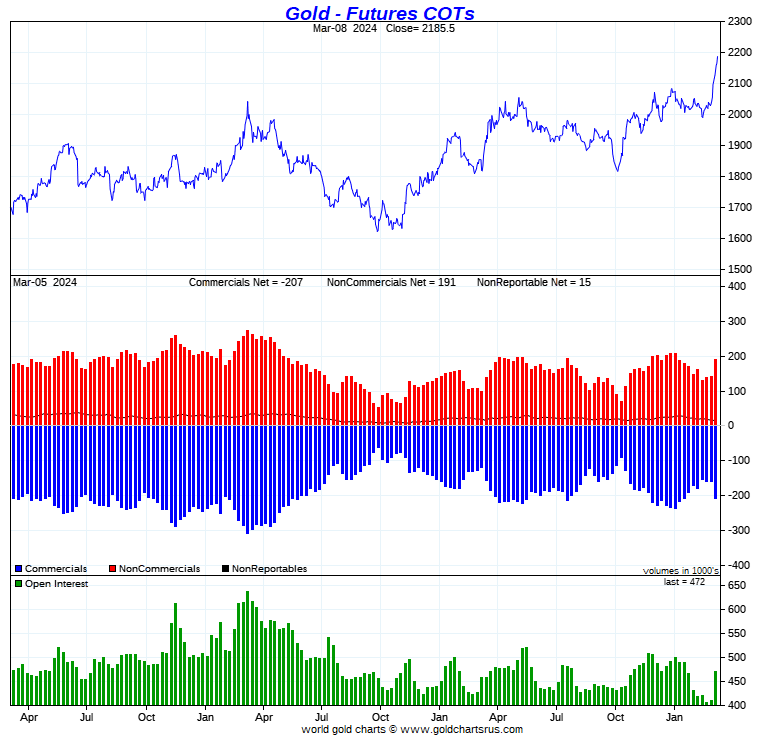
The Commitment of Traders Report, for positions held at the close of COMEX trading on Tuesday, showed the expected big increases in the commercial net short positions in both silver and gold...but the headline numbers in the Legacy COT Report are deceiving, because there was [as expected] huge raptor long selling during the reporting week.
In silver, the Commercial net short position increased by a very hefty 12,577 COMEX contracts/62.79 million troy ounces...a decent amount of which was Ted's raptors selling long positions for a profit.
The commercials arrived at that number by reducing their long position by 6,238 COMEX contracts -- and also increased their short position by 6,339 contracts. It's the sum of those two numbers that represents their change for the reporting week.
Under the hood in the Disaggregated COT Report, it was all Managed Money traders, plus much more, as they decreased their net short position by a very hefty 18,895 contracts...which they achieved by adding 7,264 long contracts, plus they covered 11,631 short contracts. This moved them from a net short position of 4,083 contracts in last week's COT Report, back to a net long position of 14,812 COMEX contracts.
To even things out on the Non-commercial side of things, the Other Reportables and Nonreportable traders were net sellers during the reporting week, as the former category reduced their net long position by 5,079 COMEX contracts -- and the latter by 1,239 contracts.
Doing the math: 18,895 minus 5,079 minus 1,239 equals 12,577 COMEX contracts, the change in the Commercial net short position.
The Commercial net short position in silver now stands at 45,025 COMEX contracts/225.13 million troy ounces...up those 12,577 contracts, from the 32,448 COMEX contracts/162.24 million troy ounces they were short in the March 1 COT Report.
In our telephone conversation yesterday, Ted was of the opinion that the managed money trader in the Big 4 covered enough of his 8,000 contract short position, to drop him back into the Big '5 through 8' short category -- and holds a short position of around 5,500 contracts. That trader would be the largest in that category -- and whatever trader was in that position before, got 'promoted' up to being the smallest member of the Big 4 commercial shorts.
The Big 4 shorts...all mostly bullion banks...increased their short position by a very smallish 1,556 contracts to 43,859 contracts during the reporting week...up from the 42,303 contracts they were short in last Friday's COT Report. They probably went short far more than that, which I'll get into in a bit. And with that managed money trader gone from that category, the Big 4 short position is back to being a pure number once again.
The Big '5 through 8' shorts, surprisingly, decreased their net short position during the reporting week...them by 1,018 contracts...from the 19,492 contracts in last week's report, down to 18,474 contracts in this week's COT Report. These traders in aggregate are still short 5 thousand contracts more than they were four months ago.
The Big 8 shorts in total increased their net short position from 61,795 contracts, up to 62,333 COMEX contracts week-over-week...an increase of only 538 COMEX contracts. But the Big 8 commercial shorts number is overstated by those approximately 5,500 contracts held by that Managed Money short, so that has to be subtracted out...leaving the remaining Big 7 commercial traders short a bit under 57,000 contracts approximately.
Ted's raptors, the small commercial traders other than the Big 8, after netting out that approximate 5,500 contracts held short by that one Managed Money trader, were the big sellers during the reporting week...reducing their long position by around 9,500 contracts...leaving them net long just under 12,000 contracts. They're a lot less long than that since the Tuesday cut-off -- and its a very strong possibility that they've sold all the longs they're going to sell on this rally.
Don't forget, that despite their small size, they're still commercial traders in the commercial category -- and all in the Swap Dealers category. It was their selling of those roughly 9,500 long contracts that mathematically increased the Commercial net short position, which is not an increase at all.
Here's Nick's 3-year COT Reportfor silver, updated with the above data. Click to enlarge.
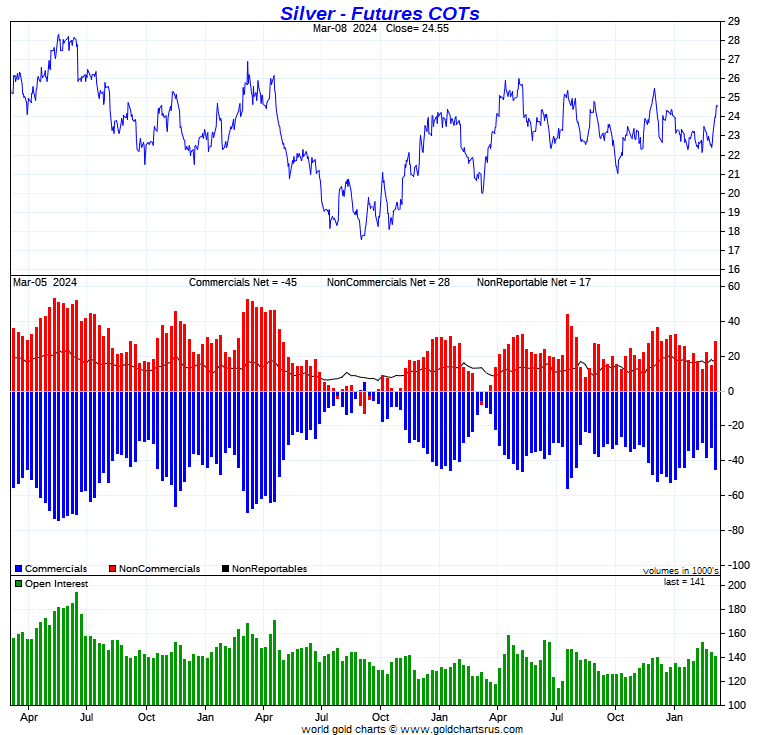
Despite the fact that total open interest in silver was lower by around 3,000 contracts during the reporting week, it didn't have much effect on what was happening from a COT perspective.
So, of the 12,577 increase in the commercial net short position in silver... about 9,500 contracts of that amount was long selling by Ted's raptors, the small commercial traders other than the Big 8 shorts, that accounted for almost all of the change.
But that short covering by that managed money trader did muddy the water a bit in the commercial category. In order for them to have reduced their short position from 8,000 contracts or so, down to around 5,000 contracts or so, they had to have bought around 2,500 long contracts to do it.
Because of that, the number of contracts that the remaining Big 3 in the Big 4 category went short during the reporting week, is understated by that amount.
What it boils down to is the fact that the commercial traders...the big bullion banks et al...were very careful not to go further short than they had to.
Ted was mulling this over when we spoke yesterday -- and will 'sleep on it'. I'll be interested in his final thoughts in his weekly review this afternoon.
Without doubt, there has been further managed money long buying and commercial selling since the Tuesday cut-off -- and the results of that won't be known until we see next Friday's COT Report.
From a COMEX futures market perspective, the set-up is still bullish...but not anywhere near as bullish as it was a week ago. And, as Ted pointed out on the phone yesterday, with the managed money traders now back on the long side by a decent amount, 'da boyz' may be tempted to go after this low-hanging fruit.
![]()
In gold, the commercial net short position blew out by 48,440 COMEX contracts/4.844 million troy ounces...which was no surprise.
They arrived at that number by reducing their long position by 4,409 contracts, but increased their short position by an eye-watering 44,031 COMEX contracts -- and it's the sum of those two numbers that represents their change for the reporting week.
Under the hood in the Disaggregated COT Report it was also no surprise that the Managed Money traders bought that amount, plus much more, increasing their net long position by 53,610 COMEX contracts...which they did by adding 41,221 long contracts, plus covering 12,389 short contracts.
Like in silver, the Other Reportables and Nonreportable/small traders both reduced their net long positions during the reporting week...the former by 3,953 COMEX contracts -- and the latter by 1,217 contracts.
Doing the math: 53,610 minus 3,953 minus 1,217 equals 48,440 COMEX contracts, the change in the commercial net short position.
The commercial net short position in gold now sits at 206,792 COMEX contracts/20.679 million troy ounces of the stuff...up those 48,440 contracts ...from the 158,352 COMEX contracts/15.835 million troy ounces they were short in the March 1 COT Report.
The Big 4 shorts increased their net short position by a very hefty 17,329 COMEX contracts...from 114,723 contracts, up to 132,052 contracts.
The Big '5 through 8' shorts also increased their net short position...from the 65,380 contracts they held short in the March 1 COT Report, up to 69,799 contracts held short in the current COT Report...an increase of 4,419 COMEX contracts.
The Big 8 commercial short position rose from 180,103 contracts/18.103 million troy ounces, up to 201,851 contracts/20.185 million troy ounces...an increase of 21,748 COMEX contracts.
Like in silver, Ted's raptors, the small commercial traders other than the Big 8 shorts were big sellers for the third week in a row...decreasing their long position by a further 26,692 COMEX contracts -- and are now net short gold by 4,941 COMEX contracts...something I mentioned in Friday's column that might occur -- and it did. I suspect they're even more short gold since the Tuesday cut-off.
Like in silver, their selling of long contracts had the mathematical effect of increasing the commercial net short position...which isn't an increase at all.
Don't forget that despite their small size, the raptors are still commercial traders in the commercial category.
Here's Nick Laird's 3-year COT Report chart for gold, updated with the above data. Click to enlarge.
Of the 48,440 contract increase in the commercial net short position in gold in yesterday's COT Report...55% of that amount was Ted's raptors selling long positions...which is not an increase at all.
But, having said that -- and looking at the price action since the Tuesday cut-off...combined with the ongoing blow-out in total open interest, one has to presume that from a COMEX futures market perspective, that we've swung from a very bullish configuration, to a bearish configuration in gold in the last seven trading sessions.
This is amplified by the fact that Ted's raptors, the small commercial traders have swung from a long position of 35,543 contracts just three weeks ago, to a short position of 4,941 contracts as of the COMEX close on Tuesday. And as I mentioned further up, it's pretty much guaranteed that they're even more short gold now.
'Day boyz' continue to have an iron grip on its price -- and that has been on full display over the last week. They still have an iron grip on silver as well, but are being super careful about not increasing their short position in it by any more than absolutely necessary.
Unless 'da boyz' get overrun, another 'wash, rinse & spin' cycle appears imminent -- and if/when it does appear, I suspect that it won't last long, but could be ugly.
![]()
In the other metals, the Managed Money traders in palladium increased their net short position by 820 COMEX contracts-- and are net short palladium by an eye-watering 12,370 contracts...58 percent of total open interest. The traders in the Other Reportables are net short palladium by a tiny amount as well...but the Nonreportable/small traders are back to being net long by a hair. The commercial traders remain very net long palladium in both categories...the Swap Dealers in particular.
In platinum, the Managed Money traders increased their net short position by a further 8,978 COMEX contracts during the reporting week -- and are now net short platinum by 20,424 contracts. The Producer/Merchant category is mega net short 15,201 COMEX contracts -- and are the only other category net short platinum. The Swap Dealers in the commercial category are net long platinum by 11,935 contracts. The traders in the Other Reportables and Nonreportable/small traders remain net long platinum by very decent amounts...especially the Other Reportables.
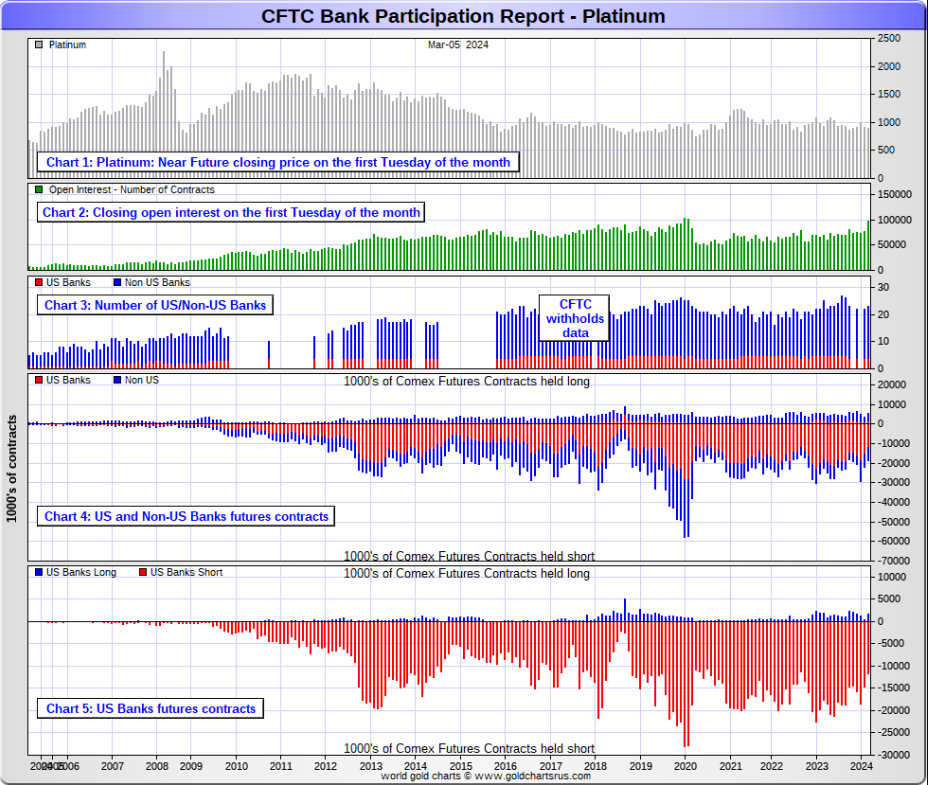
It's the world's banks in the Producer/Merchant category that are 'The Big Shorts' in platinum, as per the March Bank Participation Report that came out yesterday -- although they did reduce their short position in it by a very decent amount during the last month. More on this further down.
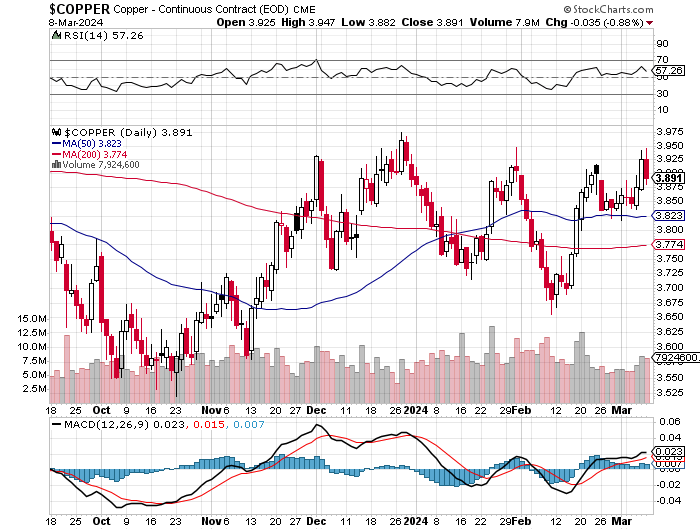
In copper, the Managed Money traders decreased their net long position by 13,609 COMEX contracts -- and are now back to being net short copper by 8,563 COMEX contracts... about 214 million pounds of the stuff as of yesterday's COT Report...compared to the 126 million pounds they were net long copper in last week's report. These traders are getting whip-sawed to death.
Copper, like platinum, continues to be a wildly bifurcated market in the commercial category. The Producer/Merchant category is net short 29,484 copper contracts -- while the Swap Dealers are net long 32,192 COMEX contracts.
Whether this means anything or not, will only be known in the fullness of time. Ted says it doesn't mean anything as far as he's concerned, as they're all commercial traders in the commercial category. However, this bifurcation has been in place for as many years as I can remember -- and that's a lot.
In this vital industrial commodity, the world's banks...both U.S. and foreign... are net long 12.9 percent of the total open interest in copper in the COMEX futures market as shown in the March Bank Participation Report that came out yesterday...up from the 9.6 percent they were net long in February's. At the moment it's the commodity trading houses such as Glencore and Trafigura et al., along with some hedge funds, that are net short copper in the Producer /Merchant category, as the Swap Dealers are mega net long, as pointed out above.
The next Bank Participation Report is due out on Friday, April 5.
![]()
Here’s Nick Laird’s “Days to Cover” chart, updated with the COT data for positions held at the close of COMEX trading on Tuesday, March 5. It shows the days of world production that it would take to cover the short positions of the Big 4 — and Big '5 through 8' traders in every physically traded commodity on the COMEX. Click to enlarge.
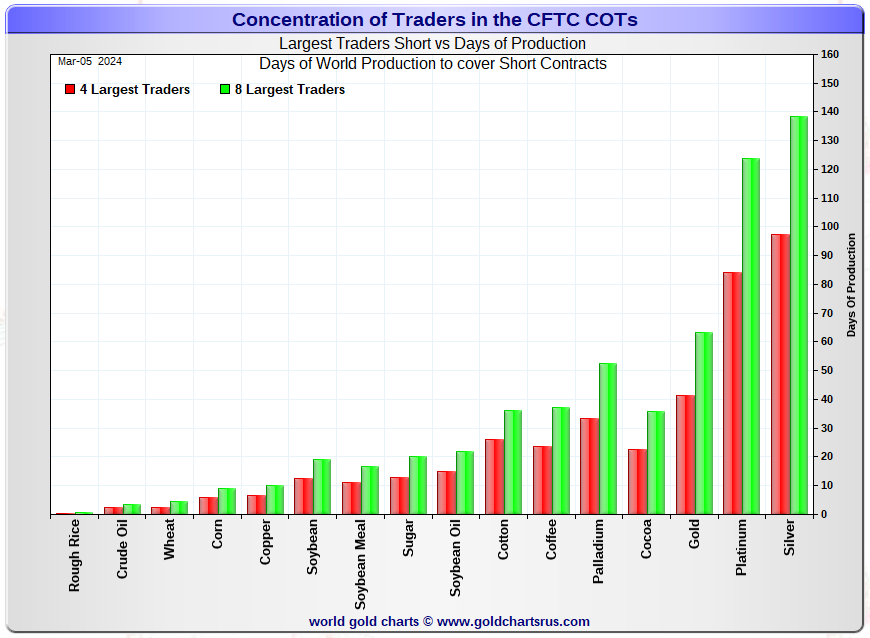
In this week's data, the Big 4 traders are short about 97 days of world silver production...up about 3 days from last week's report. The ‘5 through 8’ large traders are short an additional 41 days of world silver production...down about 2 days from last week, for a total of about 138 days that the Big 8 are short -- and up about 1 day from last week's report.
Those 138 days that the Big 8 traders are short, represents about 4.6 months of world silver production, or 311.67 million troy ounces/62,333 COMEX contracts of paper silver held short by these eight mostly commercial traders. Several of the largest of these are now non-banking entities, as per Ted's discovery a year or so ago. March's Bank Participation Report that came out yesterday continues to confirm that this is still the case -- and not just in silver, either.
And as I mentioned further up, because of the short covering by that one managed money trader in the Big 8 category, the short position of the Big 8 is actually understated by around 12.5 million troy ounces/5.5 days of world silver production.
Ted's raptors, the small commercial traders other than the Big 8 shorts sold about 9,500 contracts of their long position during the reporting week -- and after subtracting out those approximately 5,500 contracts held short by the Managed Money trader in the Big 8 category, his raptors remain long about 11,800 COMEX silver contracts. I suspect that they've sold even more of what's left of their remaining long positions since the Tuesday cut-off. And as I mentioned further up, I doubt they'll sell much more going forward.
In gold, the Big 4 are short about 42 days of world gold production...up 6 days from last week's COT Report. The '5 through 8' are short an additional 21 days of world production, up 2 days from last week...for a total of 63 days of world gold production held short by the Big 8 -- and up about 8 days from last Friday's COT Report.
The Big 8 commercial traders are short 44.2 percent of the entire open interest in silver in the COMEX futures market as of yesterday's COT Report, up a bit from the 42.8 percent that they were short in the March 1 COT Report. Factoring out their market neutral spread trades, the Big 8 are short a bit over 50 percent of the total open interest in silver.
In gold, it's 42.8 percent of the total COMEX open interest that the Big 8 are short, down a bit from the 43.8 percent they were short in the March 1 COT Report -- and a bit under the 50 percent mark once their market-neutral spread trades are subtracted out.
Ted is still of the opinion that Bank of America is short about one billion ounces of silver in the OTC market, courtesy of JPMorgan & Friends. He's also of the opinion that they're short 30 million troy ounces of gold as well. And with the latest OCC Report in hand for Q3/2023 that came out about three months ago...he hasn't changed his mind one bit on that -- and stated so in his mid-week commentary for his paying subscribers a few weeks back.
As reported further up, the short position in SLV now sits at 15.13 million shares as of last Tuesday's short report...up 20.02% from the 12.61 million shares sold short in the prior report.
The next short report is due out on Monday, March 11.
The situation regarding the Big 4/8 commercial short position in gold and silver is still obscene -- and got even more so in yesterday's COT Report... particularly in gold, as reported above.
As Ted has been pointing out ad nauseam forever, the resolution of the Big 4/8 short positions will be the sole determinant of precious metal prices going forward -- which should be totally obvious to all, but obviously isn't. And if it is, heaven forbid if they ever discuss it in the public domain. It's a sad, sad state that the entire precious metals space has degenerated into in the almost three decades I've been involved in it.
![]()
The March Bank Participation Report [BPR] data is extracted directly from yesterday's Commitment of Traders Report. It shows the number of futures contracts, both long and short, that are held by all the U.S. and non-U.S. banks as of this past Tuesday’s cut-off in all COMEX-traded products.
For this one day a month we get to see what the world’s banks have been up to in the precious metals. They’re usually up to quite a bit.
[The March Bank Participation Report covers the four-week time period from February 6 to March 5 inclusive]
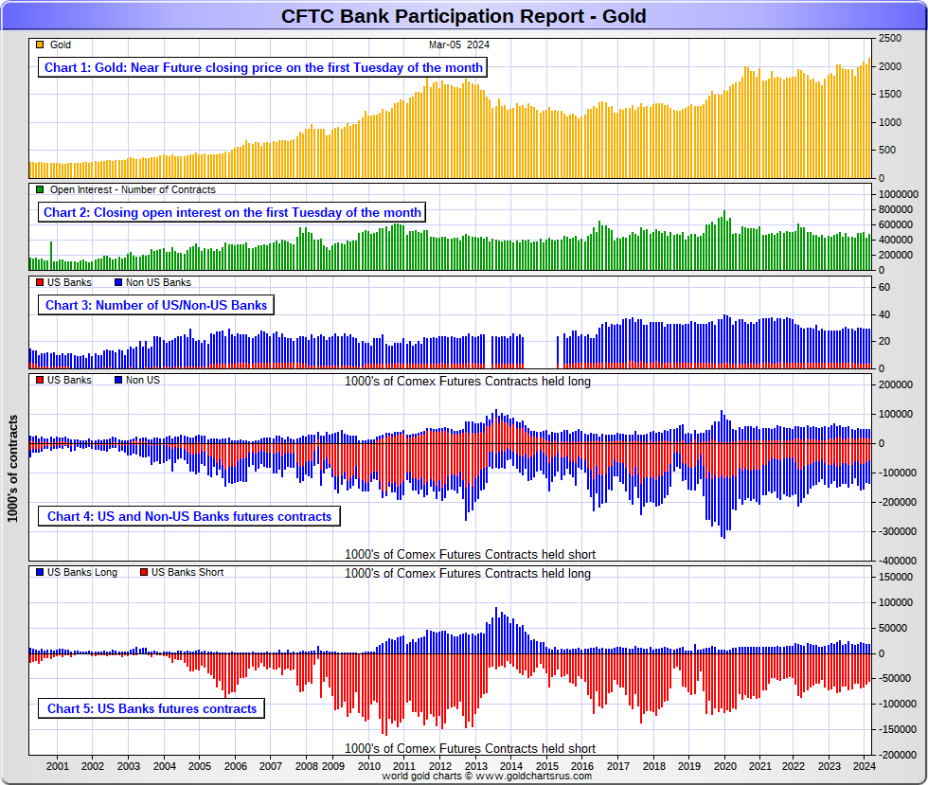
In gold, 4 U.S. banks are net short 36,473 COMEX contracts, down another 5,162 contracts from the 41,635 contracts that these same 4 U.S. banks were short in February's BPR.
Also in gold, 25 non-U.S. banks are net short 51,584 COMEX contracts, up a hefty 10,639 contracts from the 40,945 contracts that these same 25 non-U.S. banks were short in February's BPR.
At the low back in the August 2018 BPR...these same non-U.S. banks held a net short position in gold of only 1,960 contacts -- so they've been back on the short side in an enormous way ever since.
Although some of the largest U.S. and foreign bullion banks are in the Big 8 short category in gold, some of the hedge fund/commodity trading houses are short even more grotesque amounts of gold than the banks. It's also a strong possibility that the BIS could be short gold in the COMEX futures market as well.
As of March's Bank Participation Report, 29 banks [both U.S. and foreign] are net short only 18.7 percent of the entire open interest in gold in the COMEX futures market...down from the 19.8 percent that these same banks were net short in the February BPR.
Here’s Nick’s BPR chart for gold going back to 2000. Charts #4 and #5 are the key ones here. Note the blow-out in the short positions of the non-U.S. banks [the blue bars in chart #4] when Scotiabank’s COMEX short position was outed by the CFTC in October of 2012. Click to enlarge.
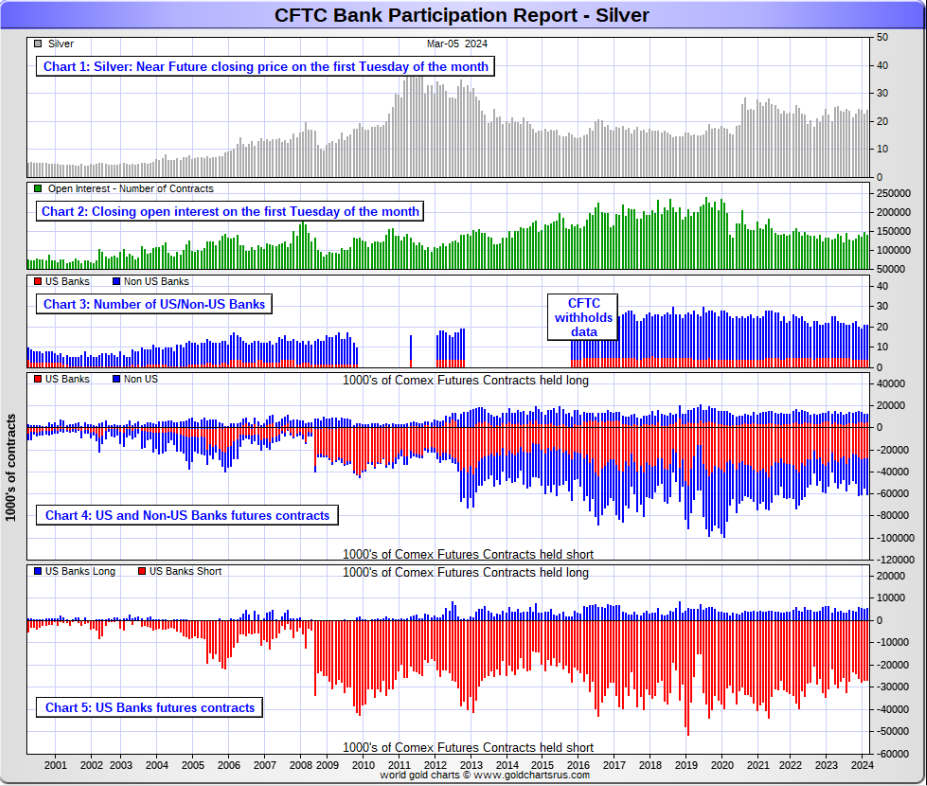
In silver, 4 U.S. banks are net short 21,669 COMEX contracts, down a tiny 102 contracts from the 21,771 contracts that these same 4 U.S. banks were short in the February BPR. This is the second month in a row where there's been just a tiny decrease in the short position of the U.S. banks...which I wouldn't read anything into.
The biggest short holders in silver of the four U.S. banks in total, would be Citigroup, Wells Fargo and Bank of America.
And, like in gold, I have my suspicions about the Exchange Stabilization Fund's role in all this...although, also like in gold, not directly.
Also in silver, 17 non-U.S. banks are net short 26,333 COMEX contracts, up 6,297 contracts from the 20,036 contracts that these same 17 non-U.S. banks were short in the February BPR.
I would suspect that HSBC, Barclays and Standard Chartered hold by far the lion's share of the short position of these non-U.S. banks...as do some of Canada's banks as well. And, like in gold, the BIS could also be actively shorting silver as well. The remaining short positions divided up between the other 12 or so non-U.S. banks are immaterial — and have always been so. The same can be said of most of the 25 non-U.S. banks in gold.
As of March's Bank Participation Report, 21 banks [both U.S. and foreign] are net short 34.0 percent of the entire open interest in the COMEX futures market in silver — up from the 28.4 percent that these same 21 banks were net short in the February BPR.
That percentage increases comes as a result of a drop in silver open interest, plus that rather large increase in the short position by those 17 non-U.S. banks during the past month.
Here’s the BPR chart for silver. Note in Chart #4 the blow-out in the non-U.S. bank short position [blue bars] in October of 2012 when Scotiabank was brought in from the cold. Also note August 2008 when JPMorgan took over the silver short position of Bear Stearns—the red bars. It’s very noticeable in Chart #4—and really stands out like the proverbial sore thumb it is in chart #5. Click to enlarge.
In platinum, 4 U.S. banks are net short 9,943 COMEX contracts in the March BPR, down a further 4,223 contracts from the 14,166 contracts that those same 4 U.S. banks were short in the February BPR.
At the 'low' back in September of 2018, these U.S. banks were actually net long the platinum market by 2,573 contracts. So they have a very long way to go to get back to just market neutral in platinum...if they ever intend to, that is. They look permanently stuck on the short side to me, a fact that I point out regularly.
Also in platinum, 19 non-U.S. banks decreased their net short position by 1,369 contracts...down to 3,108 contracts, from the 4,477 contracts that 18 non-U.S. banks were net short in the February BPR.
Platinum remains the big commercial shorts No. 2 problem child after silver ...but a very distant No. 2 down the list. How it will ultimately be resolved is unknown, but most likely in a paper short squeeze, as the known stocks of platinum are minuscule compared to the size of the short positions held -- and that's just the short positions of the world's banks I'm talking about here.
And as of March's Bank Participation Report, 19 banks [both U.S. and foreign] were net short 13.4 percent of platinum's total open interest in the COMEX futures market, which is down a huge amount from the 24.2 percent that 18 banks were net short in February's BPR.
Here's the Bank Participation Report chart for platinum. Click to enlarge.
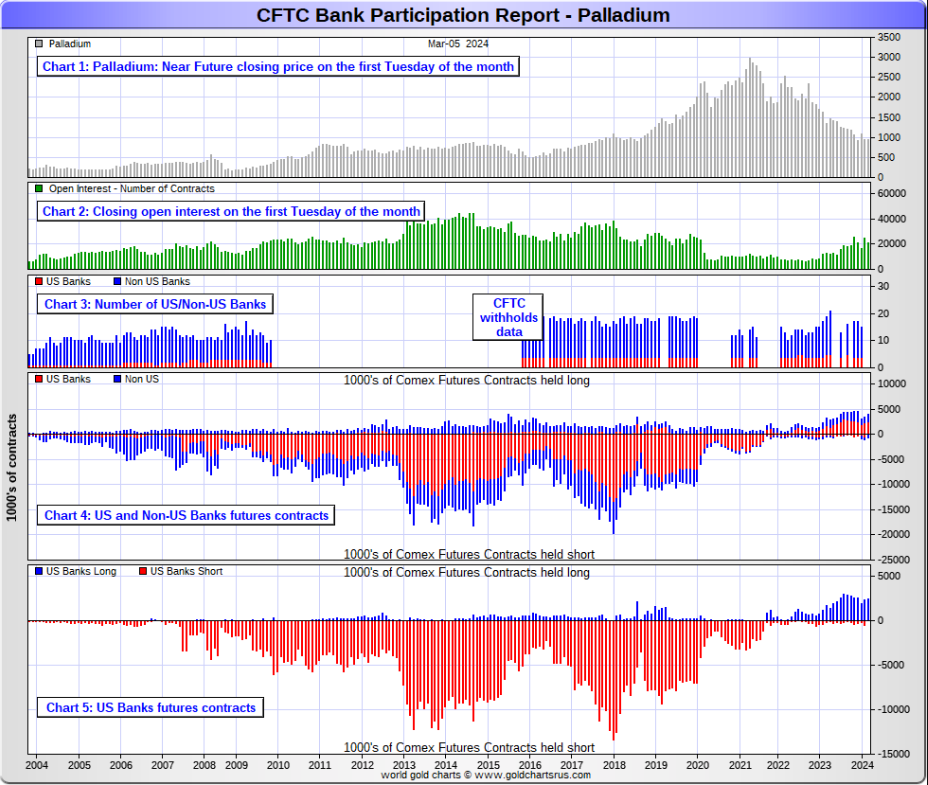
In palladium, 3 U.S. banks are net long 2,452 COMEX contracts in the March BPR, up 661 contracts from the 1,791 contracts that those same 3 U.S. banks were net long in the February BPR.
Also in palladium, 10 non-U.S. banks are net long 840 COMEX contracts, up from the 606 contracts that 12 non-U.S. banks were net long in the February BPR.
And as I've been commenting on for almost forever, the COMEX futures market in palladium is a market in name only, because it's so illiquid and thinly-traded. Its total open interest in yesterday's COT Report was only 21,297 contracts...compared to 96,814 contracts of total open interest in platinum...141,026 contracts in silver -- and 471,616 COMEX contracts in gold.
But I should point out that open interest in palladium has been on a slow but steady increase over the last year and a bit, because I remember when it was less than 10,000 contracts.
As I say in this spot every month, the only reason that there's a futures market at all in palladium, is so that the Big 8 commercial traders can control its price. That's all there is, there ain't no more.
As of this Bank Participation Report, 13 banks [both U.S. and foreign] are net long 15.5 percent of the entire COMEX open interest in palladium ...up from the 9.8 percent of total open interest that 15 banks were net long in the February BPR.
For the last 3+ years, the world's banks have not been involved in the palladium market in a material way. And with them still net long, it's all hedge funds and commodity trading houses that are left on the short side. The Big 8 commercial traders, none of which are banks, are short 45.4 percent of total open interest in palladium as of yesterday's COT Report.
Here’s the palladium BPR chart. Although the world's banks are net long at the moment, it remains to be seen if they return as big short sellers again at some point like they've done in the past. Click to enlarge.
Excluding palladium for obvious reasons, and almost all of the non-U.S. banks in gold and silver...only a small handful of the world's banks, most likely no more than 5 or so in total -- and mostly U.S.-based...along with the BIS... continue to have meaningful short positions in the other three precious metals.
As I pointed out above, some of the world's commodity trading houses and hedge funds are also mega net short the four precious metals...far more short than the U.S. banks in some cases. They have the ability to affect prices if they choose to exercise it...which I'm sure they're doing at times. But it's still the big bullion banks at Ground Zero of the price management scheme... which has been on full display once again over the last seven trading days.
And as has been the case for years now, the short positions held by these Big 4/8 traders, is the only thing that matters...especially the short positions of the Big 4...or maybe only the Big 1 or 2. How this is ultimately resolved [as Ted said earlier] will be the sole determinant of precious metal prices going forward.
The Big 8 commercial traders, along with Ted's raptors...the small commercial traders other than the Big 8 commercial shorts...continue to have an iron grip on their respective prices -- and it will remain that way until they either relinquish control voluntarily, or are told to step aside.
However, considering the current state of affairs of the world's banking and financial system as it stands today -- and the structural deficit in silver -- the chance that these big bullion banks and commodity trading houses could get overrun at some point, is not zero -- and certainly within the realm of possibility if things go totally non-linear.
And as Ted keeps reminding us from time to time, if they do finally get overrun...it will be for the very first time...which obviously wasn't allowed to happen this past week, either.
I only have a tiny handful of stories, articles and videos for you today.
![]()
CRITICAL READS
U.S. job growth totaled 275,000 in February but unemployment rate rose to 3.9%
Job creation topped expectations in February, but the unemployment rate moved higher and employment growth from the previous two months wasn’t nearly as hot as initially reported.
Nonfarm payrolls increased by 275,000 for the month while the jobless rate moved higher to 3.9%, the Labor Department’s Bureau of Labor Statistics reported Friday. Economists surveyed by Dow Jones had been looking for payroll growth of 198,000.
February was a step higher in growth from January, which saw a steep downward revision to 229,000, from the initially reported 353,000. Job growth in December also was revised down to 290,000 from 333,000, bringing the two-month total to 167,000 fewer jobs than initially reported. Click to enlarge.
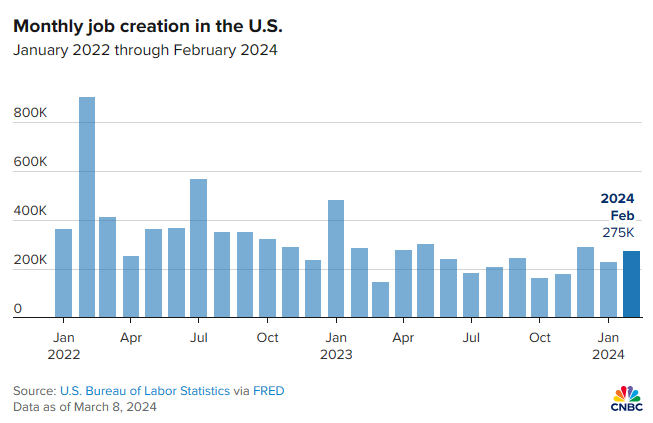
The jobless level increased as the household survey, used to calculate the unemployment rate, showed a decline of 184,000 in those employed. The increase came even though the labor force participation rate held steady at 62.5%, though the “prime age” rate increased to 83.5%, up two-tenths of a percentage point. The survey of establishments shows the total number of jobs.
Average hourly earnings, watched closely as an inflation indicator, showed a slightly less than expected increase for the month and a deceleration from a year ago. Wages rose just 0.1% on the month, one-tenth of a percentage point below the estimate, and were up 4.3% from a year ago, down from the 4.5% gain in January and slightly below the 4.4% estimate.
How much of this is real -- and how much of it politics, is anyone's guess. This CNBC news item, courtesy of Swedish reader Patrik Ekdahl, appeared on their Internet site at 8:31 a.m. EST on Friday morning -- and was updated about three hours later. Another link to it is here. The Zero Hedge take on this is headlined "Inside the Most Ridiculous Jobs Report in Recent History: Record 1.2 Million Immigrant Jobs Added in One Month" -- and linked here.
![]()
The Komodo Dragon of Foggy Bottom -- Bill Bonner
Goodbye and good riddance to Victoria Nuland
Today, we write about people who are smarter…more cunning…and more dangerous than Biden himself…the people who actually run the government.
Victoria Nuland was in the news this week; she fell off the ‘glass cliff’ at the State Department. She will probably go to work at some other arm of the Deep State. A think tank most likely. One financed by the ‘defense suppliers’ undoubtedly.
Ms. Nuland is the wife of Robert Kagan. The two are a ‘neo-con power couple’…a pair of big-shot meddlers…spilling treasure, blood and misery wherever they go. And doing it in the name of (what else?) democracy.
Ms. Nuland was a foreign policy wonk…and later…advisor to the Clintons…the Bush team…Obama and Biden. The only recent president she didn’t advise was Trump, largely because her husband had made such a public display of disgust with The Donald that his wife was persona non grata.
The problem for Mr. Kagan was that Trump was insufficiently bloodthirsty; he threw his support to the more reliable warmonger, Hillary Clinton.
Not that it mattered. Republicans, Democrats…teeters and totters…it didn’t make any difference to Kagan or his wife. Ms. Nuland is a pro, too. Whomever the people elected, it was she who was large and in charge. Swamp Critters ruled; and she was the Komodo dragon of Foggy Bottom. Besides, the new president wouldn’t know Donetsk from donuts. Ms. Nuland would guide him.
Like Hunter Biden, Toria had a special regard for the Ukraine. Her family was from there. She spoke Russian and had studied Tolstoi, Pushkin, and Dostoevsky in college. Mostly she had a special affinity – like Madeleine Albright, in whose dreadful footsteps she trod – for the firepower industry, which she and her husband saw as the source of their wealth, power, status…and a better world for everyone.
This worthwhile commentary from Bill showed up on his website early on Friday afternoon -- and comes to us courtesy of Roy Stephens. Another link to it is here. Then there's this directly related Zero Hedge story from last night headlined "'We Got to Reign Her In': Behind the Scenes of Nuland's Early Retirement" -- and linked here.
![]()
Q4 2023 Z.1: Bubble Confirmation -- Doug Noland
The Federal Reserve’s “Financial Accounts of the United States - Z.1” - where the rubber meets the road. Our quarterly read on systemic monetary (in)stability. Often concerning, but always refreshing: no Wall Street spin or B.S. – just 190 pages of data. And like booming securities markets and conspicuous speculative excess, Fed officials can ignore their own Credit and flows data at all our peril.
Q4 data confirm that government finance Bubble dynamics run unabated. The SAAR $2.878 TN increase in Federal Government borrowings accounts for over 80% of the NFD increase. For the year, Federal borrowings increased $2.620 TN, up from 2022’s $1.547 TN, and the largest gain since 2020’s $4.581 TN.
A brief response to John Williams’ comment on economic models. Good luck modeling speculative market dynamics, financial innovation, and contemporary Credit more generally. And without an overarching emphasis on today’s dynamic financial system, econometric models will be deficient much of the time and of significant negative value at financial and economic critical junctures.
March 8 – Bloomberg (James Crombie): “There’s no sign of a letup. U.S. companies are selling bonds like there’s no tomorrow and booming demand will keep the floodgates open. The first quarter will likely be the biggest ever for high-grade U.S. bond sales, with spreads close to two-year tights, tiny new issue concessions and all-in funding costs only looking more attractive as Treasury yields fall. This week’s high-grade supply handily beat expectations, as it has done for the last few weeks, and the outlook is for more of the same. Year-to-date supply of $440 billion, up 30% compared to last year, puts borrowers on track to crack the $510 billion first-quarter record set in 2020. Junk and structured credit issuance is also ramping up. And despite lousy high-grade returns, cash just keeps pouring in, pursuing all-in yields that still seem enticing.”
It’s interesting. Powell and Fed officials seem hellbent on cutting rates, irrespective of booming markets, liquidity overabundance, economic resilience, and ongoing elevated system Credit expansion. Powell was all over the subject of financial conditions when conditions were tightening. He now completely disregards exceptionally loose market financial conditions. The Fed is preparing to back away from its so-called “restrictive” rate policy in anticipation of weaker growth dynamics. Yet such loose conditions, inflating asset prices, and booming corporate debt issuance further increase the likelihood of overheating.
Doug's weekly commentary is always worth reading -- and this iteration appeared on his website shortly before midnight PST on Friday night. Another link to it is here. Gregory Mannarino didn't have a post market close rant yesterday...but his pre-market rant for Friday is linked here, if interested.
![]()
I didn't see any precious metal-related stories that I thought worth posting.
![]()
QUOTES and CARTOON of the DAY


![]()
The WRAP
"Understand this. Things are now in motion that cannot be undone." -- Gandalf the White
![]()
Today' pop 'blast from the past' dates from 1967 -- and came from another U.K. rock band that was part of the 'British Invasion' of North America going on at the time. It was a huge hit in most countries...except in the U.S. for whatever reason...but that's no reason not to post it -- and the link is here. Their other big hit is linked here. A bass cover to the first tune is here.
Today's classical 'blast from the past' comes courtesy of French composer Paul Dukas -- and is hands-down his most famous and well-known work...his 'scherzo for orchestra' composed in 1897...which was was based on Johann Wolfgang von Goethe's 1797 poem of the same name, "The Sorcerer's Apprentice".
By far the most performed and recorded of Dukas' works, its notable appearance in the Walt Disney 1940 animated film Fantasia led to the piece becoming widely known to audiences outside the classical concert hall.
Here's the Russian Philharmonic/Moscow City Symphony serving it up just right in a performance from 20 June 2012. This is a huge orchestra -- as I noted 16 chairs in the first violin section -- and 10 cellos. That's a lot! I'd love to have been there. Maestro Michail Jurowksi conducts -- and the link is here.
![]()
Since the rally in gold began seven business days ago, total gold open interest has exploded by some 123,000 COMEX contracts...a chunk of which Ted would think were those uneconomic and market-neutral spread trades being put at this time of month.
But, having said that, I cannot remember any point in the past when total gold open interest in gold has blown out this quickly -- and by this much...as the commercial shorts have pulled out all the stops to prevent gold from breaking out to the upside in a major way. This fact was on full display during the COMEX trading session in New York again yesterday.
Could gold and silver prices continue higher from here? Sure. But the rotten price action in the gold stocks, coupled with the horrid price action in silver...courtesy of the commercial traders of whatever stripe...signifies an interim top in the precious metals has most likely been set. At least that's how it appears to me at the moment.
But there's still that chance, however remote, that the commercial traders may get overrun this time around. However, as Ted continues to point out, if that happens, it will be for the very first time.
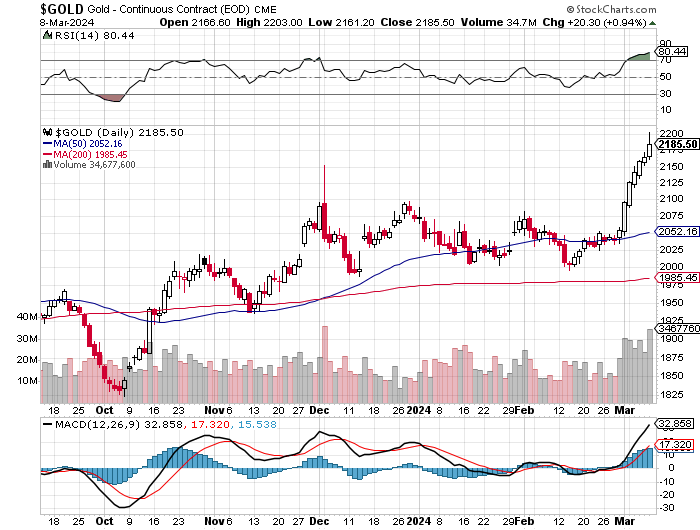
At its high tick in intraday trading yesterday, gold broke at $2,200 in the April contract, but was hauled down and closed fifteen bucks below it. Its RSI trace is the most its been overbought since August of 2020.
Silver was closed lower by 3 cents in the May contract -- and 31 cents off its high tick in that month. Its RSI trace hovers just below the overbought mark.
As reader Dave Draughton correctly pointed out yesterday..."silver's not even back to its December 1 highs...even though gold is well above it." That goes to show you just how desperate the Big 4/8 silver shorts are, as they know perfectly well what will happen the moment they let silver run.
Platinum was allowed to come within 30 cents of its 200-day moving average intraday on Friday, but the not-for-profit sellers were standing by to smack it lower...closing it back below its 50-day moving average in the process.
Palladium got the same treatment as platinum, as it was closed lower for the second day in a row -- and 49 dollars off its high tick in its current front month.
Copper wasn't spared, either...as it was closed down 3.5 cent at $3.891/ pound...taking more than half of Thursday's big gain with it in the process.
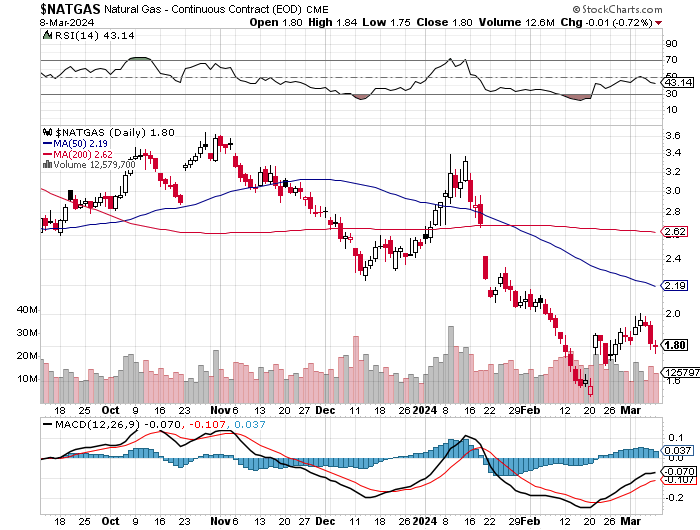
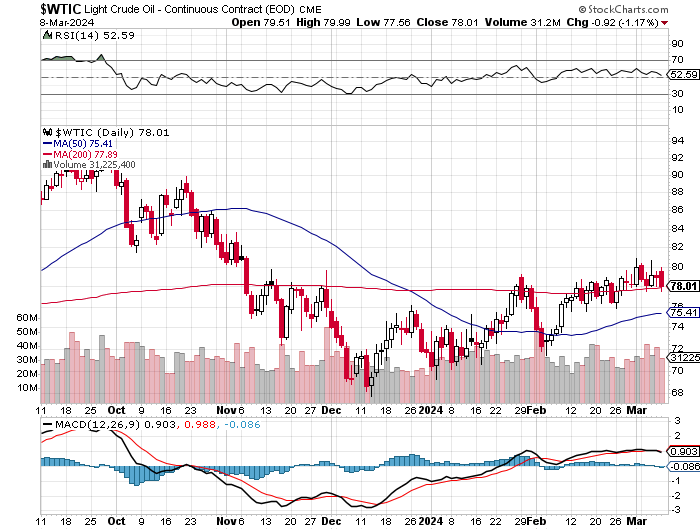
Natural gas [chart included] had its third down day in a row, closing lower by a penny at $1.80/1,000 cubic feet. WTIC was also closed lower, it by 92 cents -- and intraday it was sold back below its 200-day moving average...but was allowed to close above it by 12 cents, at $78.01/barrel.
Here are the 6-month charts for the Big 6+1 commodities...courtesy of stockcharts.com as always and, if interested, their closing prices in their current front months on Friday should be noted. Click to enlarge.
The war is certainly on to keep gold and silver price from blowing sky high -- and that event in turn would set off a boom in the entire commodities complex. The rush from paper assets to hard assets would be on in earnest. Only the Big 4/8 shorts -- and most likely the Big 4...or maybe only the Big 2 are standing in the path of such an event.
'Da boyz' are particularly anxious to keep silver off the investment demand radar screen, as the moment it kicks in, it will be game over...something which Ted pointed out in his mid-week commentary for his paying subscribers on Wednesday.
With the structural deficit in silver now hard-wired into the supply/demand equation...it has become a waiting game to see how long JPMorgan will continue to dump silver from its hoard in order to keep the deficit beast at bay.
That beast was a particularly voracious this past week, with over 12.5 million ounces disappearing out of SLV alone -- and it's now just a matter of time before they have to make their next deposit into that silver ETF.
This structural deficit has been forty or fifty years in the making -- and now that it's here, it's not about to go away anytime soon. Current silver production doesn't even cover current industrial demand, let alone any potential [and most likely imminent] investor demand...whether it be retail, or institutional. It took decades to reach the deficit situation that we have now -- and will take a decade or more to resolve. New and aggressive exploration will not take place, nor will new mines be constructed until the silver price is far higher than it is today -- and has been at that price for a while.
But as I pointed out in this space recently, prices can't be allowed to rise without having the possible effect of blowing up the COMEX in a short covering rally of Biblical proportions. However, continuing the price management scheme in silver guarantees that the current price runs into that structural deficit brick wall at some point.
The Big commercial shorts are up against it no matter what they do. On one hand they have to allow its price to rise...but on the other hand, they can't -- and how this Gordian knot is unravelled...or cut...will become the stuff of legend at some point in history.
The daily minutiae is very frustrating and disheartening...but end it must -- and end it will at some point...either by design, or by circumstance. All the swamp creatures at the CFTC, the CME Group and the DoJ know that too.
So we wait some more.
I'm still 'all in' -- and, as always, will remain that way to whatever end.
I'm done for the day -- and the week -- and I'll see you here on Monday.
Ed
About the author

SUBSCRIBE: https://edsteergoldsilver.com/

Ed Steer’s Daily Analysis of the Gold and Silver Markets
After eight years of writing about the precious metals for Casey Research, the folks at Stansberry & Associates—who just recently purchased controlling interest in the company—decided that my ‘niche market’ column didn’t fit into their plans.
Since the time that Casey Research was kind enough to offer me a stand-alone column, it became their most highly-rated blog almost from the outset—and has remained that way up to this date...