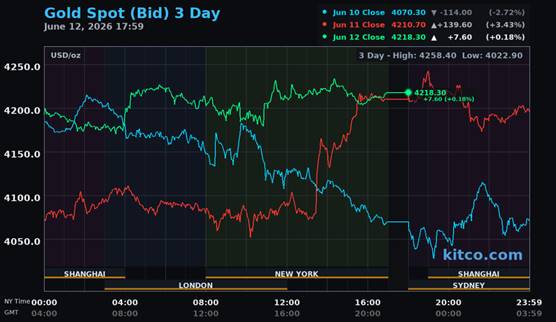
All of gold's rally attempts in Globex trading overseas were turned lower -- and it wasn't until about 10:50 a.m. in COMEX trading in New York that it was finally allowed to rally above the unchanged mark and more or less stayed there. But even then, it's three ticks higher after that were all tapped lower.
The low and high ticks in gold were recorded by the CME Group as $4,191.10 and $4,267.80 in the August contract...an intraday move of $76.70 an ounce. The June/ August price spread differential in gold at the close in New York yesterday was $23.80...August/October was $29.50...October/ December was $32.10 -- and December/February27 was $33.20 an ounce.
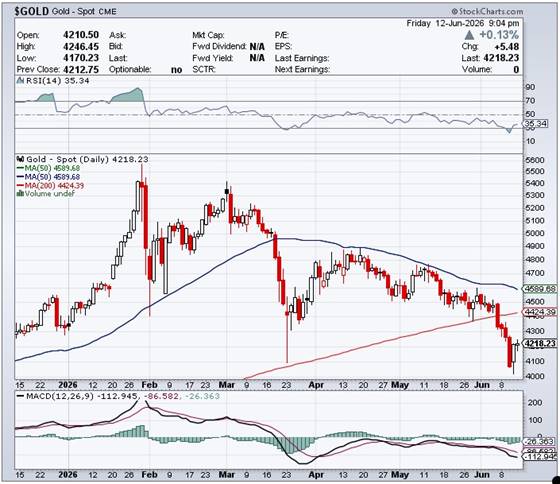
Gold was closed on Friday afternoon in New York at $4,218.30 spot...up $7.40 on the day -- and $27.00 off its Kitco-recorded high tick. Net volume was certainly on the lighter side at around 122,500 contracts -- and there were around 14,000 contracts worth of roll-over/switch volume on top of that.
I saw that 1,167 gold, plus only 11 silver contracts were traded in June yesterday and, as is always the case, it remains to be seen just how much of these amounts show up in tonight's Daily Delivery and Preliminary Reports further down in today's column.

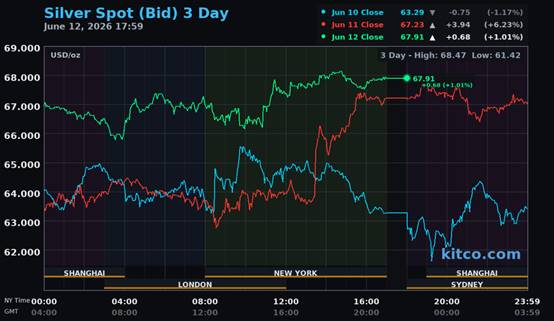
After quiet rally attempts shortly after Globex trading began on Thursday evening in New York, silver was sold quietly lower until around 9 a.m. in London. Its two broad steps higher from that point ended at its 2:45 p.m. EDT high tick in after-hours trading in New York -- and it was then had a quiet and slightly ascending down/up move that ended when the market closed at 5:00 p.m.
The low and high ticks in silver were reported as $65.965 and $68.445 in the July contract. The July/September price spread differential in silver at the close in New York yesterday was 50.4 cents...September/December was 71.6 cents -- and December/March27 was 71.0 cents an ounce.
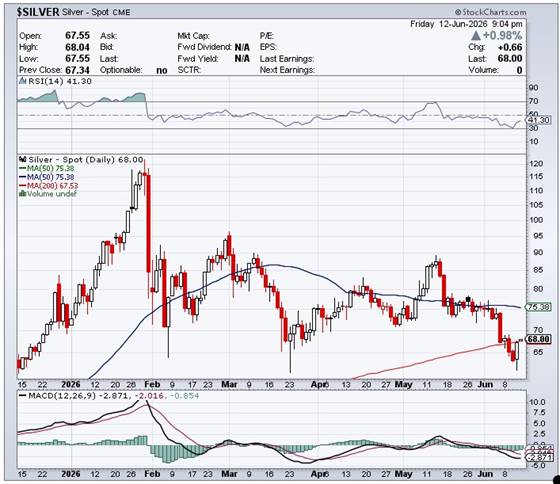
Silver was closed on Friday afternoon in New York at $67.91 spot...up 67 cents on the day -- and 31 cents off its Kitco-recorded high tick. Net volume was close to fumes & vapours once more at a bit over 29,500 contracts -- and there were 15,500 contracts worth of roll-over/switch volume out of July and into future months in this precious metal...mostly September.
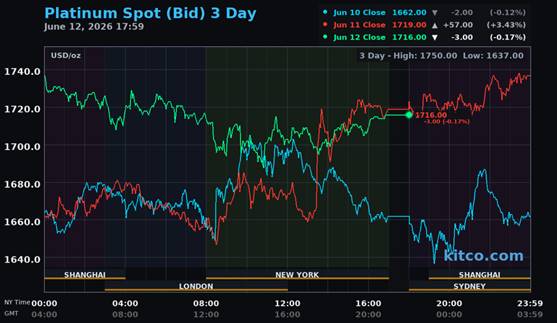
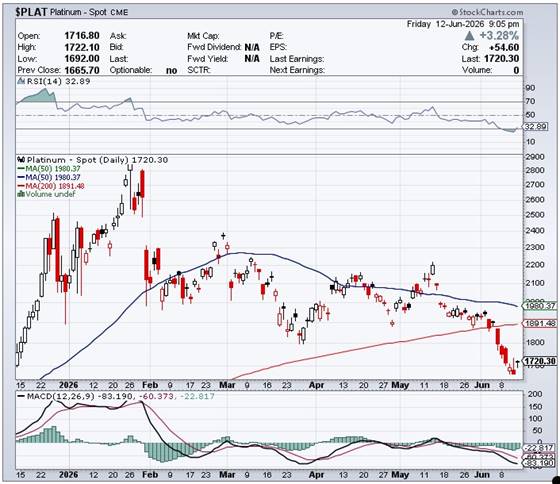
Platinum chopped sideways until Shanghai opened on their Friday -- and then chopped higher until noon CST. Quiet and very choppy price pressure commenced at that point -- and also lasted until 10:45 a.m. in COMEX trading in New York. From that point it chopped quietly higher until the market closed at 5:00 p.m. EDT. Platinum was closed at $1,716 spot...down 3 dollars on the day -- and 24 bucks off its Kitco-recorded high tick.
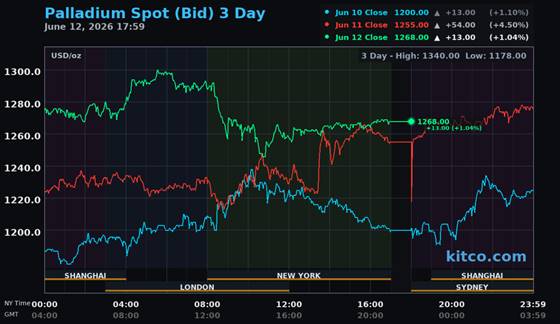
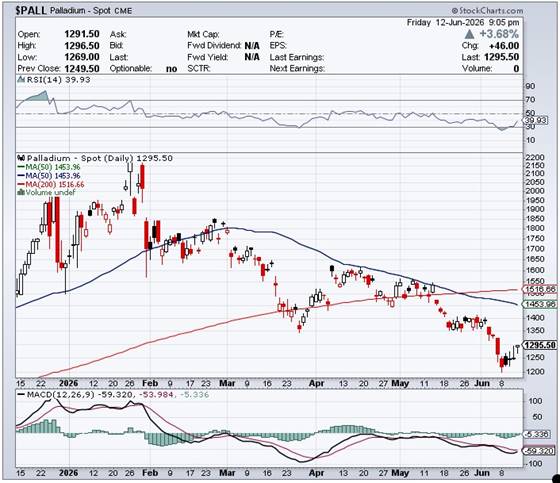
Palladium didn't do much until it had a broad and descending up/down move that started shortly after Globex trading began in Zurich -- and also ended at 10:45 a.m. EDT in COMEX trading in New York. It then edged a bit higher until around 11:25 a.m. -- and didn't do much of anything after that. Palladium was closed at $1,268 spot...up 13 bucks from Thursday -- and 32 dollars off its Kitco-recorded high tick.
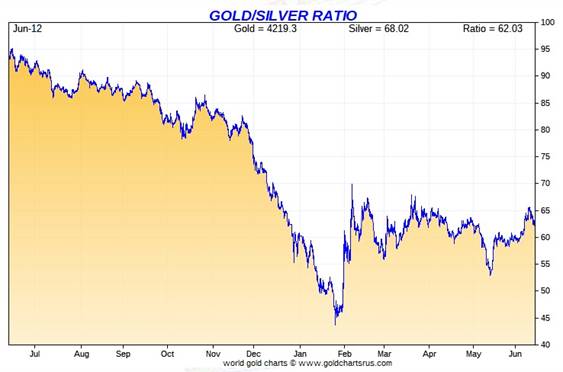
Based on the kitco.com spot closing prices in silver and gold posted above... the gold/silver ratio worked out to 62.1 to 1 on Friday...compared to 62.6 to 1 on Thursday.
Here's the 1-year Gold/Silver Ratio chart from Nick Laird -- and updated with this past week's data. Click to enlarge.
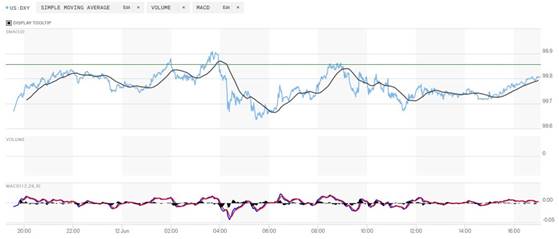
The dollar index was marked-to-close at 99.86 very late on Thursday afternoon in New York -- and then opened lower by 19 basis points once trading commenced at 7:34 p.m. EDT on Thursday evening...which was 7:34 a.m. China Standard Time on their Friday morning. It the proceed to wander/ chop broadly and unevenly sideways in directionless trading until the market closed at 5:00 p.m. in New York.
The dollar index finished the Friday session at 99.81...down 5 basis points from its close on Thursday.
Here's the DXY chart for Friday...thanks to marketwatch.com as usual. Click to enlarge.
Here's the 6-month U.S. dollar index chart...courtesy of stockcharts.com as usual. The delta between its close...99.81...and the close on DXY chart above, was zero basis points. Click to enlarge.
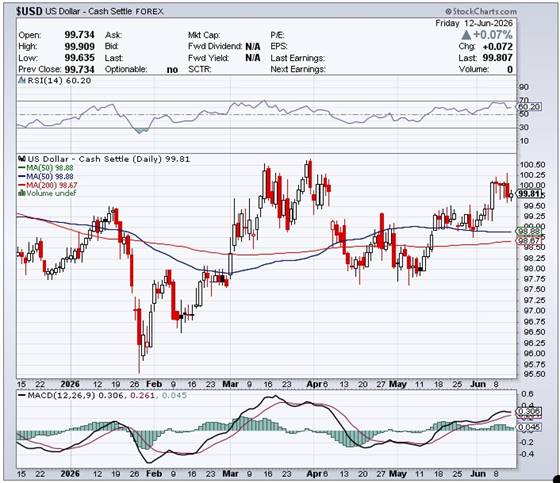
It's impossible to read anything into the dollar index action yesterday regarding its relevance to the price action in any of the precious metals.
U.S. 10-year Treasury: 4.4870%...up +0.0240/(+0.54%)...as of the 1:59:54 p.m. CDT close
The ten-year was heading impressively higher right from the COMEX open in New York on Friday morning and hit 4.5070% at 9:45 a.m. CDT/10:45 a.m. EDT. The Fed stepped in five minutes later and worked their magic...which was the exact time when all four precious metals began to head higher.
For the week just passed, the ten-year closed down 2.90 basis points -- and only down because of the continuous intervention by the Fed...with yesterday's action being the latest poster boy for that.
Here's the 5-year 10-year U.S. Treasury chart from the yahoo.com Internet site -- which puts the current yield into a somewhat longer-term perspective. Click to enlarge.
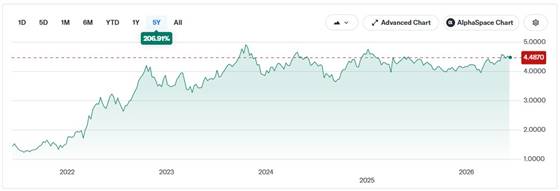
It still hasn't been allowed to take out its 4.92% high of October 15, 2023 -- and it's more than obvious that the Fed isn't going to allow that to happen any time soon. It closed above the 4.50 mark at 4.536% last Friday -- and I made the comment in last Saturday's column that it would be of some interest to see if the Fed would allow that to last. They didn't.

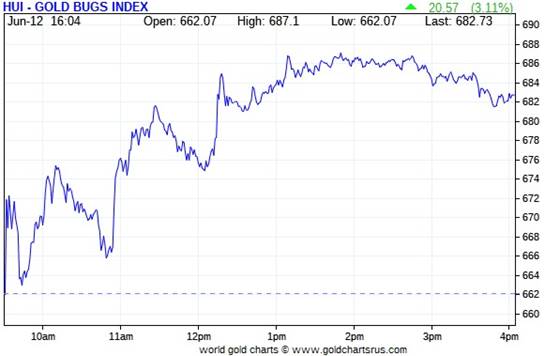
The gold shares began to chop higher as soon as the markets opened at 9:30 a.m. in New York on Friday morning -- and that rally petered out around 1:50 p.m. EDT -- and from that juncture they edged a bit lower until the markets closed at 4:00 p.m. EDT. The HUI closed up 3.11 percent.
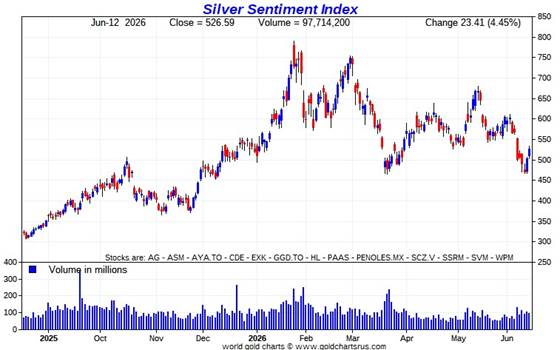
The price action in the silver equities was a virtual carbon copy of what happened with the gold stocks -- and Nick Laird's Silver Sentiment Index closed higher by 4.45 percent. Click to enlarge.
The biggest star was Aya Gold & Silver, as it closed up 7.49 percent...with Hecla Mining being the biggest underperformer, as it closed higher by only 2.00 percent.
Yesterday was the first time in a very, very, very long time where the equities vastly outperformed their respective underlying precious metals -- and because of that -- and what's in this week's COT Report...my 'spidey senses' are tingling once more.
There was this news from Silvercorp Metals yesterday.
Silver rose by 1.01% on Friday -- the Silver Sentiment Index finished the day up 4.45% -- and Sprott's PSLV finished the day higher by 1.22%
Gold closed higher by 0.18%...the HUI closed up 3.11% -- and Sprott's PHYS closed higher by 0.19%
The Shanghai/U.S. price premium in silver was back up to 11.19 percent on their Friday.
The reddit.com/Wallstreetsilver website, now under 'new' and somewhat improved management, is linked here. The link to two other silver forums are here -- and here.

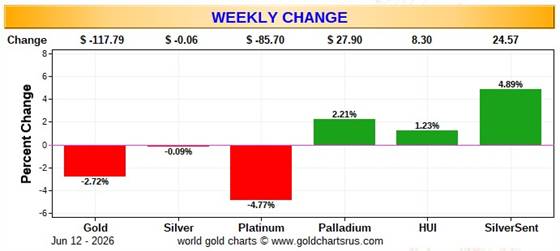
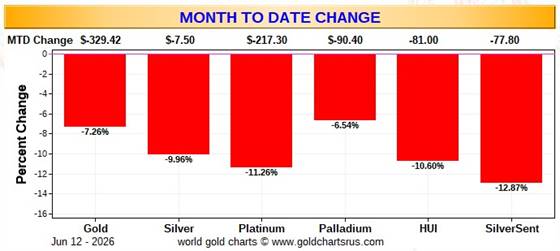
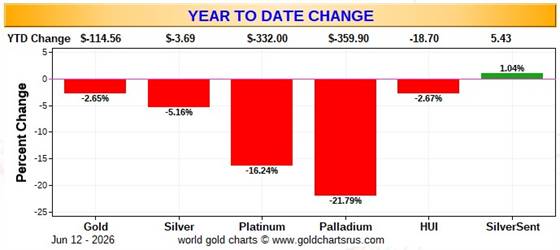
Here are the usual three charts that appear in this spot in every weekend missive. They show the changes in gold, silver, platinum and palladium in both percent and dollar and cents terms, as of their Friday closes in New York — along with the changes in the HUI and the Silver Sentiment Index.
Here's the weekly chart -- and it's a vast improvement from the wall-to-wall red we saw in last Saturday's column. The equities certainly outperformed their respective underlying precious metals...the silver stocks in particular. Click to enlarge.
Here's the month-to-date chart -- and it's pretty much just as butt-ass ugly this week as last -- and we can thank the collusive commercial traders of whatever stripe for this one -- and the year-to-date chart below as well. Click to enlarge.
Here's the year-to-date chart -- and the only green to be see is the skinny 1.04 percent gain in the silver equities. But don't forget that all three of these charts are collateral damage when 'da boyz' are running one of their patented 'wash, rinse & spin' cycles in the Globex/COMEX futures market. But this too, as it always does, will pass. Click to enlarge.
Despite the fact that silver has now broken the $120 barrier...albeit briefly -- and the silver well in London came close to running dry last October...the gold/silver ratio remains at a farcical 62.1 to 1 as of Friday's close. The 'normal' and historical ratio is around 15 to 1...which would put silver at about $280 based on gold's closing price on Friday. And if priced at the ratio of 7:1 that it comes out of the ground at, compared to gold...that would put silver at a bit under $600 an ounce. So a rather impressive triple-digit silver price is in our future...most likely somewhere between those two numbers.
As I say in this spot every Saturday...all that remains to be resolved is what that price will be -- and how soon 'da boyz' allow it to happen. Its first attempt to reach one of these values back at the end of January was obviously crushed ...as were all the rest since then. But in the face of the continuing structural deficit in silver -- and all the other stuff going on in the world today, they can't keep it up forever.

The CME Daily Delivery Report for Day 12 of June deliveries showed that 706 gold -- and zero silver contract were posted for delivery within the COMEX-approved depositories on Tuesday.
In gold, the only three short/issuers of the five in total that mattered were British bank Barclays, Deutsche Bank and Wells Fargo Securities...issuing 282, 240 and 172 contract respectively...Barclay's from their so-called client account. The two largest long/stoppers of the three in total were French bank BNP Paribas once again -- and Deutsche Bank...picking up 614 and 82 contracts respectively....the latter for their house account.
In copper, there were a further 322 contracts/8.050 million pounds of the stuff issued and stopped.
The link to yesterday's Issuers and Stoppers Report is here.
So far in June there have been 33,930 gold contracts issued and stopped ...5,139 of those in the last five days...plus 2,181 silver contracts issued and stopped...with only 72 silver contracts added this past week.
On First Notice Day for June back on May 29, there were 25,381 gold contracts still open this month -- and that number in silver was 2,147 COMEX contracts. The standouts here are the huge number of gold contracts added in June so far -- and the total lack of it silver, for the first time in a very long time.
The CME Preliminary Report for the Friday trading session showed that gold open interest in June cratered by 2,855 COMEX contracts, leaving 931 still around...minus the 706 contracts out for delivery on Tuesday as per the above Daily Delivery Report. Thursday's Daily Delivery Report showed that 3,561 gold contracts were actually posted for delivery on Monday...so that means that 3,561-2,855=706 gold contracts were added to the June delivery month -- and it's more than obvious that those are the same 706 contracts out for delivery on Monday, as just mentioned.
Silver o.i. in June declined by 14 contracts, leaving 222 still open -- and none were posted for delivery on Tuesday. Thursday's Daily Delivery Report showed that 14 silver contracts were actually posted for delivery on Monday ...so that means that the change in open interest and deliveries match...for once.
Total gold open in interest in Friday night's Preliminary Report declined by 1,314 COMEX contracts. Total Silver o.i. rose by 261 contracts. Nothing to see here.
[I checked the final change in total open interest for gold on Thursday -- and it showed a smallish decline...from +5,344 COMEX contracts, down to +4,744 contracts. The final change in total silver o.i. for Thursday showed a smallish and immaterial increase...from +1,238 contracts, up to 1,331 COMEX contracts.]
Gold open interest inJuly in Friday morning's final report from the CME Group increased by 143 contracts, leaving 3,447 contracts still open -- and silver o.i. July fell by a further 2,964 contracts, leaving 50,704 contracts still around.
For the second day in a row there were no reported changes in GLD. But there was yet another withdrawal from SLV...as an authorized participant removed further 1,356,810 troy ounces of silver.
The SLV borrow rate showed no data points again on Friday. The GLD borrow rate began the day at 0.42% -- and finished it at 0.43%...with 4.8 million shares available.
In other gold and silver ETFs and mutual funds on Earth on Friday ...net of any changes in COMEX, GLD and SLV activity, there were a net 662,290 troy ounces of gold taken out. The reason it's such a large amount is because most funds only report their activity once a week -- and that's Friday. But there were only a net 87,932 troy ounces of silver taken out.

There was no in/out activity in gold over at the COMEX-approved depositories on the U.S. east coast on Thursday -- and the only paper activity there was, were the 9,645.300 troy ounces/300 kilobars transferred from the Eligible category and into Registered -- and no doubt getting teed up for immediate delivery. The link to this is here.
The only activity in silver were the 13,926 troy ounces received at Delaware. There was nothing shipped out -- and no paper activity, either. The link to this is here.
The Shanghai Futures Exchange updated their silver inventories as of the close of business on their Friday -- and it showed that a net and further 295,917 troy ounces/9.204 metric tonnes of silver were withdrawn... leaving their silver inventories at 28.488 million troy ounces/886.061 metric tonnes.

Here are the usual 20-year charts that show up in this space in every weekend column. They show the total amounts of physical gold and silver held in all known depositories, ETFs and mutual funds as of the close of business on Friday. Click to enlarge.
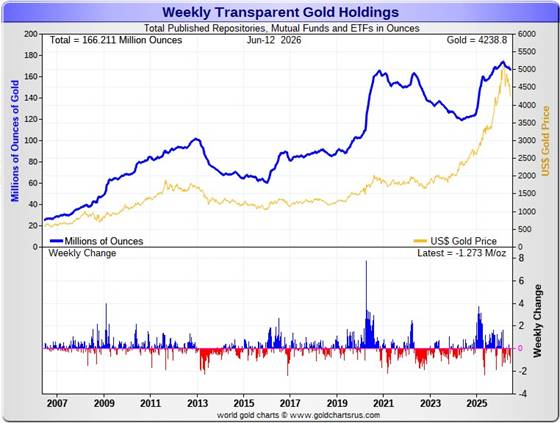
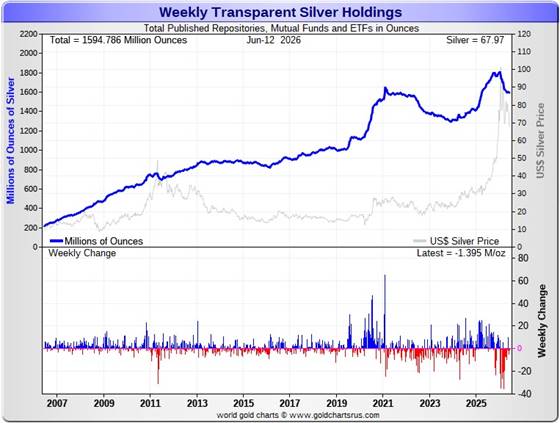
During the business week just past, there were a net and further 1.273 million troy ounces of gold withdrawn -- along with a net and smallish 1.395 million troy ounces of silver.
According to Nick Laird's data on his website, a net 1.2611 million troy ounces of gold were removed from all the world's known depositories, mutual funds and ETFs during the last four weeks. The only 'in' amount worth mentioning were the 181,547 troy ounces deposited into India's various and sundry ETFs.
The largest two 'out' amounts by far were the 764,217 troy ounces that left the COMEX...followed by the 749,412 troy ounces that departed GLD... followed by the 312,511 troy ounces that were shipped out of UBS.
The amount of gold in all the world's ETFs and mutual funds remains only a hair above its old all-time high of late 2020...see the above chart. But it should be far higher...considering gold's current price...far more than double it was back then. Why it isn't, is beyond me...but suspect it has something to do with the 'everything bubble' in the equity markets.
A net 9.795 million troy ounces of silver were withdrawn during that same 4-week time period.
The largest 'in' amount were the 4.256 million troy ounces into the COMEX... followed by the 1.233 million troy ounces into iShares/SSLN.
The largest 'out' amounts were the 8.398 million oz. that left SLV -- and the 3.029 million oz. out of Sprott's PSLV. Next were the 1.892 million out of Sprott's CEF...plus the 1.545 million troy ounces out of Aberdeen.
It should be noted that the amount of silver held in all these depositories, ETFs and mutual funds remains below its old all-time high inventory level of January 2021. But it should be far higher than it is as well, because silver is about 2.5x the price it was back then.
Back at its previous inventory peak in late January 2021, silver was around $27 an ounce. Now its about 41 bucks higher. Why the precious metal ETFs aren't doing better is a mystery for which I have no answer....except for what was mentioned a few paragraphs ago.
Retail demand remains comatose...although I was a buyer this past week -- and there are no 'out of stock' signs over at all the retail bullion stores that I follow. They have decent stocks in just about everything they normally carry. The buy/sell spreads at most bullion stores remain a bit north of 10 percent -- and in the case of anything less than 0.999+ pure, it's far more than that. This obviously means that they have lots of stock -- and are not at all enthusiastic about buying anything.
COMEX silver withdrawals had been monstrous up until recently...135 million in Q1/2026...23 million oz. in April -- but only 12.6 million oz. in May -- and nothing worth mentioning in June so far. As you can see, withdrawals from the COMEX have imploded in the last few months.
These amount don't include the 10.905 million oz. issued and stopped on the COMEX in the June delivery month so far. But this is not really silver demand per se...as all that's happening is that silver already sitting on the COMEX just changes ownership.
But silver demand from the COMEX can only go on for so long, as a huge chunk of silver sitting on the COMEX is owned privately in the Eligible category -- and not for sale or delivery. Just how much silver is actually available for shipment on demand to the LBMA of elsewhere, is unknown...but it's most certainly finite.
We're also well into the sixth year of a structural deficit in silver according to the ongoing reports from The Silver Institute. However, subscriber John Macintosh thinks it's far more than they're reporting -- and threw the b.s. flag on their latest report in an essay headlined "The Silver Institute Strikes Again" -- and linked once more here.
The vast majority of precious metals being held in these depositories are by those who won't be selling until the silver price is many multiples of what it is today...if ever.
Sprott's PSLV is the third largest depository of silver on Planet Earth with 215.6 million troy ounces...unchanged from last week -- and a great distance behind the COMEX, which has now been demoted to the second largest silver depository, where there are 319.4 million troy ounces being held...up a skinny 200,000 troy ounces this past week...but minus the 103 million troy ounces being held in trust for SLV by JPMorgan that Ted Butler found out about many years ago.
That 103 million ounce amount brings JPMorgan's actual silver warehouse stocks down to around the 37 million troy ounce mark...quite a bit different than the 139.8 million they indicate they have -- down 500,000 troy ounces on the week. They've parted with a lot of silver in the last six or so months... around 73 million oz.
But that number doesn't include the silver that JPMorgan owns and has stored at the other COMEX-approved depositories. They've shipped out lots of that over the months and years...especially this year so far -- and a lot of it out of CNT.
PSLV remains a very long way behind SLV as well -- still the largest silver depository...with 481.0 million troy ounces as of Friday's close...down a further 1.9 million troy ounces from last week.
On a net basis since the latter parts of December -- and despite the big spike in the silver price at the end of January, just about every depository or ETF had been hemorrhaging silver. However, that outflow has declined precipitously over the last three months...as I pointed out a bunch of paragraphs ago regarding the COMEX.
The latest short report [for positions held at the close of business on Friday, May 29] showed that the short position in SLV fell by 5.48%...from the 28.48 million shares sold short in the prior report...down to 26.92 million shares in the latest short report that came out earlier this week. This amount represents 5.05 percent of total SLV shares outstanding...still a bit obscene, but not nearly as bad as it was early in the year. Don't forget that there's no physical silver backing any of these shorted shares as the SLV prospectus requires.
BlackRock issued a warning more than ten years ago now to all those short SLV, that there might come a time when there wouldn't be enough metal for them to cover. That would only be true if JPMorgan decides not to supply it to whatever entity requires it. Those that remain short SLV shares are in equally dire straits as the Big 8 shorts in silver in the COMEX futures market -- and I suspect that they're the same entities.
The next short report...for positions held at the close of trading on Monday, June 15 will be posted on The Wall Street Journal's website on Thursday, June 25.
Then there's that other little matter of the monster short position in silver held by Bank of America in the OTC market...with JPMorgan & Friends on the long side. Ted said it hadn't gone away. He wrote an article about this back in April 2021 headlined "A New Piece of the Puzzle" -- and linked here.
In the article, the OCC Report stated that BofA had $8.3 billion in precious metal derivatives at the end of Q4/2020 -- but the BofA's derivatives position is now up to $120.7 billion as of the end of Q4/2025...an almost fifteen-fold increase.
A while after that article came out, he also come to the conclusion that they're short around 25 million ounces of gold with these same parties as well. Once these short covering rallies in both silver and gold begin anew...we'll see if they need to get taken over, like Bear Stearns did back in 2008 -- and for the same reason. If that's the case, JPMorgan...their counterparty to these trades ...will pick them up for next to nothing as well.
The next report from OCC should be out in less than two weeks time.

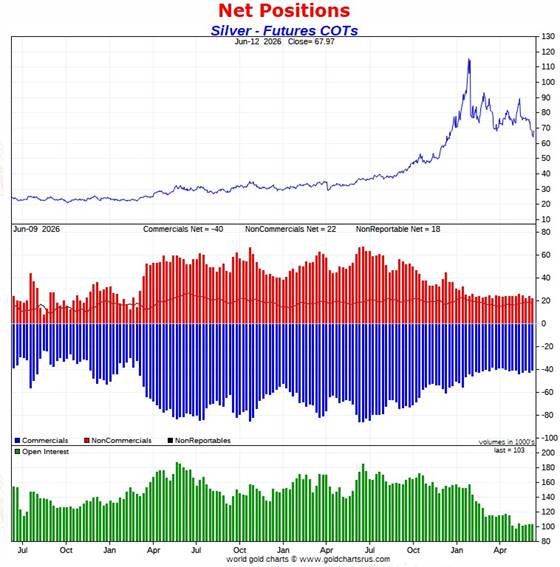
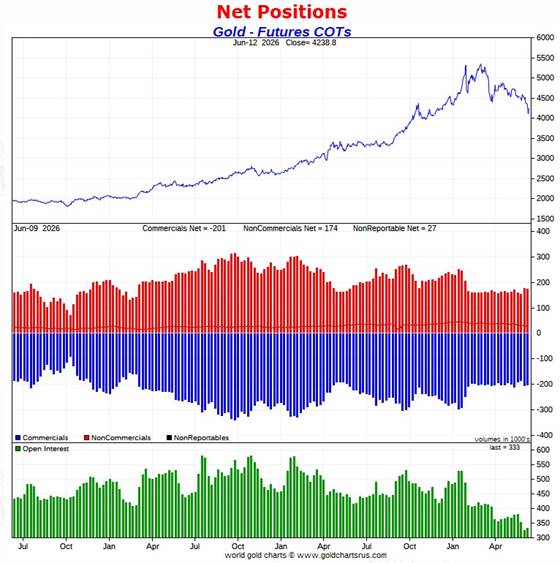
The Commitment of Traders Report, for positions held at the close of COMEX trading on Tuesday, shows the expected declines in the commercial net short positions in both gold and silver...but fell far short of what I was expecting as far as the size of the declines were concerned. They were piddling in the overall.
In silver, the Commercial net short position declined by only 2,293 COMEX contracts...11.465 million troy ounces of the stuff. To make matters far worse, of that amount...1,127 contracts were new longs added by Ted Butler's raptors...the small commercial traders other than the Big 8 shorts...which meant that the Big 8 accomplished virtually nothing. It was just as bad in gold...but more on that further down.
The commercial traders in silver arrived at that 2,293 contract number through the purchase of 878 long contracts -- and also bought back/covered 1,415 short contracts. It's the sum of those two numbers that represents their change for the reporting week.
Under the hood in the Disaggregated COT Report, all three groups of traders reduced their net long positions...the Managed Money by a shockingly tiny 41 contracts...the Other Reportables by 1,671 contracts -- and the Nonreportable/small traders by 581 COMEX contracts.
Doing the math: 41 plus 1,671 plus 581 equals 2,293 COMEX contracts...the change in the Commercial net short position.
The Commercial net short position in silver now stands at 40,368 COMEX contracts/201.840 million troy ounces...down those 2,293 contracts from last week's report.
The Big 4 collusive commercial traders decreased their net short position by only 845 COMEX contracts, down to 29,997 COMEX contracts...which is still about 200 contracts off their lowest short position on record.
The Big '5 through 8' decreased their net short position by only 321 COMEX contracts...down to 14,895 COMEX contracts -- and still about 2,200 contracts above their lowest short position on record.
The Big 8 commercial traders in total are net short 44,892 COMEX silver contracts...down only 1,166 contracts on the week -- and still about 1,500 contracts above their lowest short position I have records for.
But since the Big 8 shorts accounted for only 1,166 contracts of the decrease in the Commercial net short position -- and the Commercial net short position fell by 2,293 COMEX contracts, that meant that Ted's raptors, the 28 small commercial traders other than the Big 8, had to have been long buyers during the reporting week -- and they were.
They increased their net long position by 2,293-1,166=1,127 COMEX contracts -- and now hold a net long position of 4,524 contracts.
Their act of buy long contracts had the mathematical effect of decreasing the Commercial net short position by that amount during the reporting week... which isn't a decrease at all. When these small traders are net long as they are now...it's only what the Big 8 commercial shorts do that matters. It's been that way forever.
Here's the 3-year COT chart for silver thanks to Nick Laird -- and updated with the above data. Click to enlarge.
Despite the fact the collusive commercial traders of whatever stripe closed silver below its 200-day moving average on the last day of the reporting week...Tuesday...they must have been exceedingly unhappy about what they managed to accomplish...or more appropriately put, what they didn't accomplish.
Not only didn't they cover enough of their short positions to blow out their old record low of April 7...they weren't even able to buy back enough contracts to cover what they went short in the prior week.
Of course their so-called partners in crime, Ted Butler's raptors...the small commercial traders other than the Big 8...have been less than helpful, as they've added 2,706 long contracts during the last month...contracts that the Big shorts would have dearly love to have bought...so there's no honour amongst this set of thieves.
But what's even more important is that the non-commercial and small traders have refused to follow the Pavlovian script of selling big when important moving averages are broken to the downside.
This is especially true of the Managed Money traders who, as of this COT Report remain net long 10,403 COMEX contracts. Normally the would be net short silver by a bit now -- and all those aforesaid mentioned contracts would be in the hands of the Big 8 shorts. But not this time around.
However, there's always a chance that not all of Tuesday's trading data made it into this week's COT report -- and there's also what happened since the COMEX close on Tuesday...as 'da boyz' really beat the crap out of silver on Wednesday -- and again in the first hour of Globex trading on Wednesday evening.
But even factoring that in, one has to doubt that the Big 8 commercial shorts accomplished much since the Tuesday COMEX close cut-off. Hopefully next Friday's COT Report will shine further light on that.
The Big 8 commercial traders are net short 43.4 percent of total open interest in silver in the COMEX futures market...down a bit from the 44.8 percent they were short in last week's COT Report. The weekly change in total open interest in silver was not a factor in the percentage calculation.
But the bottom line here is that despite this enormous 'wash, rinse & spin' cycle that 'da boyz' put silver through, it was a massive failure for them...as they accomplished less than nothing -- and are worse off now than they were two weeks ago...and from their record lows of April 7.
You couldn't make this stuff up -- and it was even worse for them in gold.
In gold, the commercial net short position only fell by 5,309 COMEX contracts ...530,900 troy ounces of paper gold.
They arrived at that number through the purchase of 5,135 long contract -- and also bought back/covered 174 short contracts. It's the sum of those two numbers that represents their change for the reporting week.
Under the hood in the Disaggregated COT Report is where it got a bit strange. The Managed Money traders only reduced their net long position by 6,316 COMEX contracts -- and the Nonreportable/small traders reduced their net long position by 3,126 contracts. This meant that to make the numbers work out, the traders in the Other Reportables category had to have increased their net long position...which they did to the tune of 4,133 COMEX contracts.
Doing the math: 6,316 plus 3,126 minus 4,133 equals 5,309 COMEX contracts...the change in the commercial net short position...which it must do.
The commercial net short position in gold now stands at 201,036 COMEX contracts/20.104 million troy ounces...down those 5,309 contracts from last week's report.
The Big 4 commercial traders decreased their net short position by only a tiny 738 COMEX contracts, down to 126,096 contracts -- and still 4,000 contracts above their lowest short position that I have records for.
The Big '5 through 8' commercial traders also decreased their net short position...them by an equally insignificant 682 contracts, down to 47,247 COMEX contracts...their largest short position since March 24.
The Big 8 commercial traders in total are net short 173,341 COMEX contracts...down only 1,422 contracts from last week -- and a hefty 11,443 contracts above their record low of 161,898 contracts that they were short just two weeks ago.
But since the commercial net short position fell by 5,309 COMEX contracts -- and the Big 8 only accounted for only 1,422 of those contracts...that meant that Ted's raptors, the 30 small commercial traders other than the Big 8, had to have been big buyers as well during the reporting week -- and they were. They decreased their net short position by 5,309-1,422=3,887 contracts -- and are now net short 'only' 27,695 COMEX contracts...their largest short position since March 17.
And like they currently are in silver, they would normally be net long gold by many thousands of contracts [if not tens of thousands of contracts] at this point in the price cycle -- and why they're not this time around, I have no idea...but suspect that they have been recruited into the trenches in the fight to prevent a massive rise in the gold price. But if they weren't short this amount -- and net long those thousands [to tens of thousands] of contracts that they normally would be, it's a guarantee that gold would be many, many thousands of dollars higher in price than it is now.
I suspect that no more than two or three of these small commercial traders hold the vast majority of this short position...so it's the 'Big 10 or 11' -- and not just the 'Big 8' traders that are running the gold price management show.
Here's Nick's 3-year COT chart for gold -- and updated with the above data. Click to enlarge.'
'Da boyz' blew gold below -- and closed it well below its 200-day moving average during the reporting week. But this is all they had to show for it which, like in silver, was worse than nothing.
In last week's COT Report, the Big 8 increased their short position by 12,885 COMEX contracts...but only covered 1,422 of those contracts in this week's COT Report...despite their huffing and puffing. WTF? Ted's raptors didn't help...as they covered 3,887 of their own short positions.
So, instead of a new record low for the Big 8 shorts in gold...they are still 11,443 contracts off it...despite the pounding they laid on the gold price during the reporting week. But also like in silver, I'm sure they improved their lot somewhat since the Tuesday COMEX close cut-off for next week's COT report.
The Big 8 are now are short 52.1 percent of total open interest in gold in the COMEX futures market...down a bit from the 53.6% they were short in last week's report -- and also down a bit because of the 6,657 increase in total open interest during the reporting week, which obviously affects the percentage calculation.
However, unlike silver, the commercial net short position in gold is much larger than the Big 8 short position...because the rest of the collusive commercial traders, Ted Butler's raptors, are also net short gold. Adding them into the mix, which you have to do, puts the commercial net short position in gold at 60.4 percent of total open interest in the COMEX futures market...down from the 63.3% that they were short in last week's report -- with part of that decrease because of the increase in open interest mentioned in the previous paragraph.
And if you subtract out the uneconomic and market-neutral spread trades, the commercial net short position in gold soars to something around 70% of total open interest...which is grotesque beyond belief.
So, the Big 8 shorts got their collective heads handed to them this week in both precious metals. I'm sure they were even more shocked that I, when I uncovered all this. So it's obvious that the traders in the non-commercial and small trader categories are now made of far sterner stuff than those of years gone by. Pavlov has left the building!
Not only has that law of diminishing returns come up to bite 'da boyz' hard once again...the COT Reports of the last several months are sure signs that the collective short positions through price management to the downside cannot be reduced further going forward without draconian and/or official intervention. Or, as reader John Glavin pointed out in a phone call to me late last night, this may force the commercials to cover into rising prices. Good luck with that. I have more on this in The Wrap.
Of course the corollary to all this is that there's now a rock-solid price floor under these two precious metals -- and I suspect in platinum and palladium as well. The set-up for massive rallies from a COMEX futures market perspective remains off-the-charts wildly bullish -- and all we await now is when 'da boyz' get the word to allow that to happen.
In the other metals, the Managed Money traders in palladium increased their net short position by a further 969 COMEX contracts -- and are now net short palladium by 4,460 COMEX contracts.
The commercial traders in the Swap Dealers category are net long palladium by 2,822 contracts -- but the commercial traders in the Producer/Merchant category remain net short 586 COMEX contracts. The traders in the Other Reportables are net long 1,496 contracts in this metal at the moment -- and the Nonreportable/small trader categories are net long 728 COMEX contracts.
As I keep mentioning about these numbers, palladium is a very dinky market. Total open interest is only 17,455 COMEX contracts...an increase of 1,171 contracts this past reporting week...still about the lowest it's been since mid-2023. Open interest in platinum is also about the lowest since that time as well.
The world's banks are net short 9.3 percent of total open interest in palladium in the COMEX futures market as of the June Bank Participation Report that came last Friday...which is a decrease from the 12.1 percent that they were net short in May's Bank Participation Report.
This is a very strange and twisted market once you get a look into its internal structure -- and as I point out in every monthly Bank Participation Report, the only reason that there's a COMEX futures market in palladium is so the collusive commercial traders of whatever stripe can manage its price.
In platinum the Managed Money traders decreased their net long position by a further 3,543 COMEX contracts -- but remain net long platinum by 8,274 contracts. The traders in the Other Reportables and Nonreportable/small trader category remain net long platinum by very respectable amounts as well.
The commercial traders in the Producer/Merchant category in platinum are net short 12,284 COMEX contracts. The Swap Dealers are net short platinum by 8,268 COMEX contracts.
It's mostly the world's banks that are 'The Big Shorts' in platinum in the COMEX futures market, as per June's Bank Participation Report that came out a week ago Friday -- but haven't done much of anything in platinum in the last five months, in aggregate.
In copper, the Managed Money traders decreased their net long position by 6,543 COMEX contracts during the past reporting week -- but remain net long copper by 69,204 contracts...1.730 billion pounds of the stuff. The traders in the Other Reportables and Nonreportable categories are net long copper as well.
Copper, like palladium, continues to be a wildly bifurcated market in the commercial category. The Producer/Merchant category is net short 109,260 copper contracts/ 2.731 billion pounds -- while the Swap Dealers are net long 25,325 COMEX contracts/633 million pounds of the stuff. So it's the commercial traders in the Producer/Merchant category that are short against every other group of trader...including the commercials in the Swap Dealer category.
Whether this dichotomy in copper means anything or not, will only be known in the fullness of time. Ted Butler said it didn't mean anything as far as he was concerned, as they're all commercial traders in the commercial category. But this bifurcation has been in place for as many years as I've been keeping records -- and that's a very long time....10+ years.
In this vital industrial commodity, the world's banks...both U.S. and foreign... are net short copper by 2.1% of total open interest in the June Bank Participation Report. Back in the October 2025 BPR, these same banks were net long 0.90% of the total open interest in copper in the COMEX futures market. So basically they're market neutral...but only numerically, as that dichotomy between the two groups of commercial traders is still there.
At the moment it's all the commodity trading houses such as Glencore and Trafigura et al., along with some hedge funds, that are mega net short copper in the Producer/Merchant category, as the Swap Dealers are net long, as pointed out above.
The next Bank Participation Report for the June trading period is due out on Friday, July 10.

Here’s Nick Laird’s “Days to Cover” chart, updated with the COT data for positions held at the close of COMEX trading on Tuesday, June 9. It shows the days of world production that it would take to cover the short positions of the Big 4 — and Big '5 through 8' traders in every physically traded commodity on the COMEX. This chart is a graphical representation of what's shown in the COT Report above. Click to enlarge.
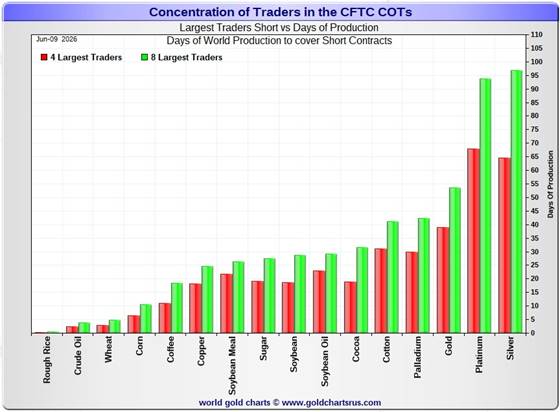
In this week's data, the Big 4 traders are short about 65 days of world silver production...down about 1 day from the prior COT report. The ‘5 through 8’ large traders are short an additional 32 days of world silver production...also down about 1 day from last week's report...for a total of 97 days that the Big 8 are short...and down about 2 days from that last Friday's COT Report.
Those 97 days that the Big 8 traders are currently short, represents about 3.2 months of world silver production, or 224.460 million troy ounces/44,892 COMEX contracts. That's down from the 230.290 million troy ounces/46,058 contracts in last Friday's COT Report.
In gold, the Big 4 are short about 39 days of world gold production... unchanged from the prior report -- and the Big '5 through 8' are short an additional 15 days of world production...also unchanged from last week, for a total of 54 days of world gold production held short by the Big 8 commercial traders -- and obviously unchanged from last week.
In silver, I suspect that a goodly chunk of the gross short position in the Big 4 commercial category is mostly held by only two traders...both of them U.S. banks...Wells Fargo and BofA. In last week's Bank Participation Report, 5 U.S. bullion banks held a gross short position of 12,884 COMEX contracts...down a whole bunch from April -- and their lowest short position on record -- and one has to suspect that it's even lower than that now.
After a one-month or so break, silver is now back in No. 1 spot with the largest number of days of production held short...bumping platinum into No. 2 position by 3 day's worth. This chart is also a graphical representation of why I consider platinum to be 'da boyz' No. 2 problem child after silver -- and it's a big problem child.
I also note from this chart that cotton has slipped down to the No. 5 spot for the first time in a couple of months -- and as has been the case for the last 25+ years...the four precious metals are back to where they have always been...the four most shorted products offered in the COMEX futures market.
The short position in SLV now sits at 26.92 million shares/troy ounces as of the latest short report that came out on Tuesday, June 9...for positions held at the close of trading on Friday, May 29. This represents a decrease of 5.48% from the prior report -- and 5.05% of total SLV shares outstanding. This is not as off-the-charts grotesque and obscene as it once used to be -- but realistically should be something less than half that amount.
Don't forget that there's not a single solitary troy ounce of silver backing any of these shorted shares as the SLV prospectus requires.
The next short report...for positions held at the close of business on Monday, June 15...is due out on Thursday, June 25.
In the overall in yesterday's COT Report, the short positions of the Big 8 commercial traders in silver decreased by a smallish amount. In gold, the Big 8 also decreased their short position by a smallish amount. As you know, I was expecting huge declines, which didn't materialize...which was shocking.
As Ted Butler pointed out quite often over the years, the resolution of the Big 4/8 short positions will be the sole determinant of precious metal prices going forward...although that short position in gold held by his raptors continues to be a negative factor -- but it did decrease by a noticeable amount during this past reporting week. However, under normal circumstances, it wouldn't be there at all...it would be a huge long position.
And as he also pointed out over the years, there would come a time when what the numbers show in the COT Report won't matter, as events in the real world...whatever they may be...will overtake them. That hasn't happened yet...but that day now appears to be fast approaching.
All that we await now, is the denouement that follows. The big bear raids we've endured over the last many months, weeks and days...are all part and parcel of the process to keep their respective prices in line...plus allow the collusive commercial traders of whatever stripe to cover as many short positions as possible...until that moment arrives.

CRITICAL READS & VIDEOS
Despite inflation surging past short-term yields, households kept pouring cash into money market funds (MMFs) in Q1. Balances in MMFs held by households rose by $89 billion from the prior quarter, and by $626 billion from a year ago, to $5.21 trillion, according to the Fed’s quarterly Z1 Financial Accounts. Since Q1 2022, when the Fed started hiking its policy rates, balances have about doubled.
These MMF balances include retail MMFs that households bought from their broker or bank, and institutional MMFs that households bought indirectly through their employers, trustees, and fiduciaries – such as in their 401(k) plans.
MMFs are short-term liquid low-risk investments, a form of interest-earning cash: At current MMF yields of around 3.5% and at Q1 MMF balances, households would earn $182 billion in interest in a 12-month period.
MMFs have been earning around 3.5%, give or take a little, down from over 5% in 2024 before the rate cut started.
Treasury bills, a close alternative to MMFs, are currently earning between 3.66% (investment rate of the 4-week T-bills sold at auction this week) and 3.91% (investment rate of the 1-year T-bills sold at auction this week).
This 3-chart commentary from Wolf showed up on his Internet site on Friday sometime -- and I thank Mike Coombs for sharing it with us. Another link to it is here.
SpaceX and a Z.1 (Q1 2026) -- Doug Noland
For posterity, SpaceX traded 522 million shares in its initial Friday trading session, gaining 19.2%, and inflating market capitalization to $2.105 TN. By market cap, SpaceX trails only Nvidia, Alphabet, Apple, Microsoft and Amazon in the U.S. The world has its first trillionaire.
“‘Praise the Lord’: Traders Feel Lucky to Get a Piece of Space X.” “‘Manic Impulsiveness’ Drives SpaceX-Fueled Retail Risk Complex.” “SpaceX’s Goldilocks IPO Just Changed Markets Forever.” “Financials Up on Anticipation of Investment Banking Bonanza.” “Goldman and Morgan Stanley to Pocket $100 Million Each In SpaceX IPO Fees.” “The SpaceX Feeding Frenzy is Under Way.”
One would be hard-pressed to conceive of a more telling sign that a major market top is at hand. At least SpaceX, Trump claims of an imminent Iran deal, and an impending quarterly options/derivatives expiration made for lively market dynamics.
Rapid financial sector expansion ensures the perception of endless liquidity. In particular, historic Broker/Dealer, Repo, money market fund, banking system, and Rest-of-World ballooning stokes Bubble excess while creating acute financial fragility.
Doug's long weekly commentary is more than a bit thick this week -- and always is when discussing the latest Z. 1 numbers. The link to it is here.
The Next Big Money Printing Cycle is Almost Here -- Lawrence Lepard
This 1-hour long video interview with Larry was hosted by Adam Taggart about ten or so days ago -- and didn't show up on the youtube.com Internet site until this past Monday -- and for length reasons had to wait for today's column. He's one of the few market analysts out there that I have all the time in the world for, as it calls it like it is...a no b.s. kind of guy. I thank Alfredo Zilla for sending it along on Monday -- and the link to it is here.
Why China's Population Decline Is Irreversible
China’s demographic collapse is so advanced that even an immediate return to replacement-level fertility cannot prevent a massive population decline because there are simply too few women of childbearing age.
The ageing crisis facing China is well documented and widely reported. The crisis stems from a combination of longer life expectancies and a reduction in births below the replacement level of 2.1 children per woman. The result is a smaller workforce, a smaller pool of taxpayers, a smaller group of consumers driving the economy, and a growing population of retirees who need financial and medical support.
China’s ageing crisis, however, is so acute that this framing misses a crucial structural issue.
Currently, the pool of women capable of bearing children is so depleted that even an overnight return to replacement-level fertility cannot prevent substantial population decline.
China has approximately 190 million women of childbearing age. Even if the fertility rate immediately rose to 2.1, the population would still decline by more than 40 percent by the end of the century. The demographic pyramid has already determined the outcome. The trajectory is irreversible.
China’s population has contracted for four consecutive years. According to the National Bureau of Statistics’ 2025 Statistical Communiqué, the total population stood at 1.40489 billion at the end of 2025, a net decrease of 3.39 million people. Births numbered 7.92 million against 11.31 million deaths, yielding a natural growth rate of negative 2.41 per thousand, the steepest annual loss on record outside of the 1959–61 famine caused by Mao’s misguided policies.
Well, dear reader, most countries have now fallen into this demographics trap...Japan first and foremost...along with now almost all of the west. This interesting article was something I found on Zero Hedge on Friday -- and the link to it is here.
Four informative and worthwhile video interviews
1. Trump’s Biggest Mistake -- Colonel Douglas Macgregor
This 25-minute video interview with the Colonel was hosted by Judge Andrew Napolitano -- and showed up on the youtube.com Internet site on Thursday. I didn't have the room for it in Friday's missive...so here it is now. I thank Guido Tricot for sending it along -- and is definitely worth your time if you have the interest. The link to it is here.
2. The Era of Impunity for Israel & the U.S. in West Asia Is Over -- Ambassador Chas Freeman
This very worthwhile but longish 56-minute interview with Ambassador Freeman was hosted by Nima Alkhorshid on Friday morning EDT -- and as you are more than aware, I have all the time in the world for what this thoughtful man has to say. I thank Guido for this one as well -- and the one that follows. This is definitely worth watching -- and the link to it is here.
3. Trump Dismantling NATO -- Professor John Mearsheimer
This 25-minute excerpt from what was a much longer video interview with the professor, was hosted Lt. Colonel Daniel Davis early on Friday morning EDT -- and it also very much worth your time. The link to it is here.
4. INTEL Roundtable w/Larry Johnson & Ray McGovern: Weekly Wrap 12-June
This informative and worthwhile 33-minute video discussion with former CIA analysts Johnson and McGovern was hosted by Judge Napolitano very late on Friday afternoon EDT -- and of course I thank Guido Tricot for this one as well. The link to it is here.
Mother of All 'Ifs': Trump Officials Claim Iran Deal Delivers Peace, Inspections & Hormuz Reopening; Iran Says Indeed 'Close'
Summary
- Araghchi: A deal, if reached, will be signed remotely by both sides and then announced.
- The UAE had agreed to release a total of $10b, more than $3b of which had already been delivered (Reuters).
- Bloomberg latest: U.S. Senior administration officials says Iran deal accomplishes core U.S. objectives and deal reopens Strait of Hormuz; Iran deal guarantees long-term peace in region and includes inspection regime.
- Pakistan PM Sharif: "we can confirm that a final, agreed upon text of the peace deal has been reached & Pakistan is now working closely with both sides to finalize the next steps."
- Surprise, surprise: Iran FM says sides "have never been closer and pending its finalisation, the media should refrain from entering speculation about its content, details to be shared in due course."
- Trump on Truth Social rejects Iran's version of MoU terms (below): "What they said, including their weak & pathetic statement on having a deal, bears no relation to the truth."
- Tehran: "Contrary to what is being circulated by Western media, Iran will not commit to relinquishing control of the Strait of Hormuz."
- CNN speculates (prematurely, it seems) on Geneva signing of 'Islamabad Declaration' as soon as Sunday or next week.
Place your bets, dear reader. This long and updated Zero Hedgestory was last updated at 4:30 p.m. on Friday afternoon EDT -- and another link to it is here.
CME Plans to Offer 24/7 WTIC Oil and Gold Contracts
The Chicago Mercantile Group announced plans to offer 24-hour, seven-days-a-week trading in new, smaller crude oil futures and its existing gold contract, the exchange said Thursday.
The new oil-linked contract, set to be one-tenth the size of the existing Micro WTI futures contract, will debut Aug. 30, according to the release, while 24/7 trading in 1-ounce gold futures will begin July 26.
The oil and gold contracts, which are still pending regulatory review, will be cash-settled and listed on NYMEX and COMEX, respectively.
Well, dear reader, I suppose this was inevitable...considering the wild success of their newly introduced 100 oz. bar cash-settled silver contract. The rest of this Bloomberg story is hidden behind their paywall -- and I found it on the gata.org Internet site. Another link to it is here.
Gold in time of war -- Alasdair Macleod
Currencies are debased during and after wars, because government spending goes through the roof not just due to defence spending but also because of the economic consequences.
Financial markets, particularly in North America and Europe are ignoring the lessons of history. By their actions participants believe that it is the marginal cost of holding gold over prospective interest rates which determine the former’s value. The assumption is that inflation is increasingly likely to surprise on the upside as a result of the closure of the Straits of Hormuz, removing the hoped-for reduction in interest rates later this year and substituting the likelihood of an increase.
This is thoughtless nonsense which assumes that currency deposits in a bank are the ultimate safety. The delusion is primarily due to accounting investment returns in these currencies, which ignores the factors changing their purchasing power. Last week has been a prime example of this error, as the values of currencies have been driven higher against those of gold and silver.
Trading short-term is particularly hazardous. But there is a major benefit for stackers prepared to benefit from an arbitrage between current investment misconceptions about the role of gold and silver, and the reality which always undermines currency values following war.
This rather brief 5-chart article put in an appearance on the goldmoney.com Internet site on Friday -- and I found it embedded in a GATA dispatch. Another link to it is here.
QUOTE of the DAY

The WRAP
"Understand this. Things are now in motion that cannot be undone." -- Gandalf the White
Today's pop 'blast from the past' popped into my head a few days ago -- and I can't get rid of it...so posting it here may excise the beast. It's 53-years old -- and just loaded with hooks. I remember spinning this 45 rpm record on CHAR FM radio in Alert, N.W.T. way back then...when I was 25 years young. The link is here. I was disappointed that there was no bass cover for this tune.
Today's classical 'blast from the past' is one that I've featured before...most likely within the last year or so...but I don't care. It's Johannes Brahms' Piano Concerto No. 2 in B♭ major, Op. 83...which he completed in a three- year time period between 1878 and 1881.
He wrote to Clara Schumann about it saying that: "I want to tell you that I have written a very small piano concerto with a very small and pretty scherzo." He was ironically describing a huge piece. [A monster piece! - Ed]
The public premiere of the concerto was given in Budapest on 9 November 1881, with Brahms as soloist and the Budapest Philharmonic Orchestra, and [not at all surprisingly] was an immediate success.
Here's Russian pianist Grigory Sokolov wrestling it to the ground in a live performance from 1987...accompanied by the Finnish Radio Symphony Orchestra...with a very young Maestro Jukka-Pekka Saraste at the podium. It's obviously an old video recording -- and with a time burn...but with this performance, it just doesn't matter. There are two encore works as well. The link is here.
It was a somewhat schizophrenic trading pattern in the dollar index and the precious metals yesterday...but I did note a couple of things of interest. The first of which was that all four precious metals rallied rather sharply starting at 10:50 a.m. in New York...which was the moment that the Fed stepped into the treasury market and smacked the ten-year yield back below 4.50%. Secondly, I took careful note of the fact that 'da boyz' ensured that silver closed below $68 spot.
Gold remains mired $200+ below its 200-day moving average. However, silver's small gain on Friday closed it above its 200-day.
Trading volumes in both silver and gold were back to being very light...fumes & vapours in the case of silver -- and the changes in total open interest in last night's Preliminary Report were insignificant in both. Nothing to see here.
Platinum was closed down 3 bucks in the spot market...but higher by $54.60 in its current front month. Palladium closed up 13 dollars in the spot market ...but up 46 bucks in its current front month. Despite those gains, both remain far below any moving averages that matter to the Managed Money Traders et al.
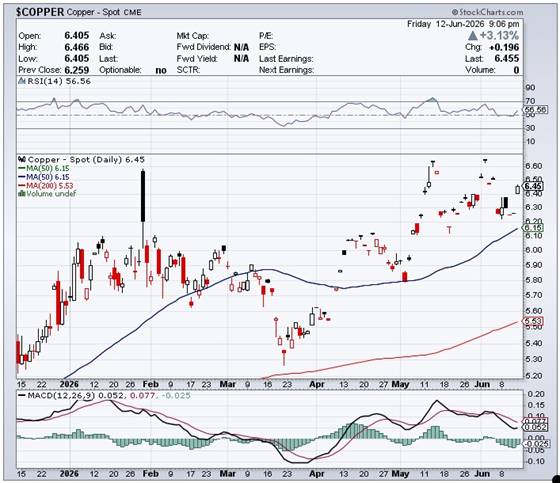
Copper had a boomer of a day, closing higher by 19.6 cents at $6.455/pound -- and now a very respectable distance above any moving averages that matters.
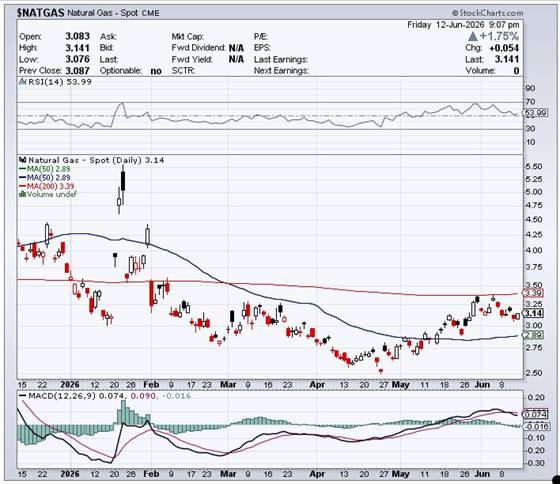
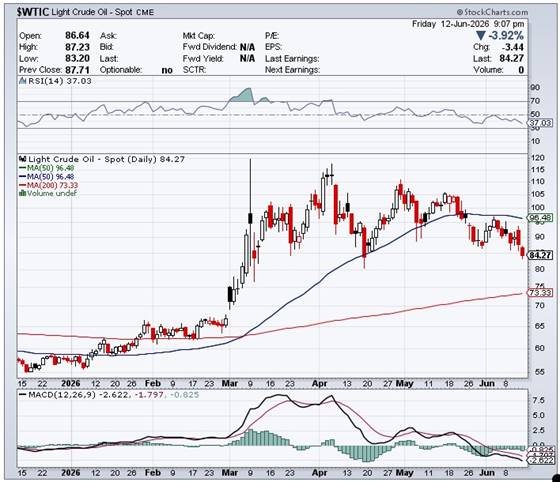
Natural gas [chart included] closed up 5.4 cents at $3.141/1,000 cubic feet ...but still some distance below its 200-day moving average...a price which 'da boyz' are actively defending. WTIC's fall from grace continued again on Friday. It was hit for $3.44 -- and closed at $84.27/barrel.
Here are the 6-month charts for the Big 6+1 commodities for Friday... thanks to stockcharts.com as always and, once again, the candle for silver doesn't show all of its intraday price move yesterday. Click to enlarge.
When I first saw the changes in the commercial net short positions in yesterday's legacy Commitment of Traders Report, I was more than disappointed...as I was expecting new record low short positions by the Big 8 shorts in both silver and gold.
But that initial disappointment turned into astonishment the further I got into the numbers, when it became crystal clear what had happened...or rather what hadn't happen.
Despite the pounding that the collusive commercial traders of whatever stripe laid on silver and gold during the reporting week...the traders in the non-commercial and small trader categories refused to sell as much as 'da boyz' were hoping for, or expecting. Their usual Pavlovian response of puking up longs and going massively short didn't happen.
And because of that 'up yours' from them...not only did the commercial traders not set the expected new lows in their respective short positions...they weren't even able to cover all of the short positions that they put on during the prior week. They weren't even close in gold.
And to add insult to injury in gold, the traders in the Other Reportables category didn't sell at all. Instead, they actually increased their net long position by 4,133 COMEX contracts.
And I'll repeat here, what I said in my COT commentary on gold further up...
"So, the Big 8 shorts got their collective heads handed to them this week in both precious metals. I'm sure they were even more shocked than I, when I uncovered all this. So it's obvious that the traders in the non-commercial and small trader categories are now made of far sterner stuff than those of years gone by. Pavlov has left the building!
Not only has that law of diminishing returns come up to bite 'da boyz' hard once again...the COT Reports of the last several months are sure signs that the collective short positions through price management to the downside cannot be reduced further going forward without draconian and/or official intervention."
Or, as reader John Glavin pointed out in a phone call to me late last night, this may force the commercials to cover into rising prices. Good luck with that... was my answer.
The reason that I wished the commercials -- and the other shorts 'good luck with that' is for the simple reason that if/when they go into the market to buy long contracts in order to cover...who will be willing to take the short side of that trade...as every other category of trader is mega net long silver and gold.
The question then becomes...at what price would a seller be willing to go short -- and the answer to that is simple...only at prices that are many multiples of what they are today.
It should be noted as to what happened after the Tuesday COMEX close cut-off for yesterday's COT Report. The collusive commercial traders smashed their respective prices even lower on Wednesday...right up until 7 p.m. EDT in Globex trading on Wednesday evening. So one has to suspect that 'da boyz' were able to entice more Managed Money traders et al. into selling...but how much more, is the $64,000 question that may or may not be answered in next Friday's COT Report -- and there are still two more trading sessions between now and then.
I suspect that the extra day of huffing & puffing after Tuesday's COMEX close, didn't net them all that much -- and whatever success they did have...limited or otherwise...was 'da boyz' last hurrah.
So...here we sit at the end of this 'wash, rinse & spin' cycle with a set-up for massive price rallies in the COMEX futures market as incandescently white hot bullish in all four precious metals that I have records for. This, at the same time as the collusive commercial shorts appear to be all out of aces.
But, as silver analyst Ted Butler pointed out over the years, one must never underestimate the treachery of the collusive commercial traders of whatever stripe...especially in the dire straits they appear to be in now.
If they do come up with something out of left field, it would have to be draconian in nature -- and it's guaranteed that the CME Group and the CFTC would be complicit in it.
Where we go from here is entirely up to the powers-that-be in the U.S. financial system. All I'm doing is reporting the facts and then commenting on them as time goes along.
As I've mentioned before, it's sort of like walking in a fog. You go as far as you can see -- and when you get there, you'll be able to see further.
So we wait some more.
As always, I remain 'all in' -- and I'm even more 'all in' today, than I was at the beginning of the week.
Enjoy what's left of your weekend -- and I'll see you here on Tuesday.
Ed
About the author

SUBSCRIBE: https://edsteergoldsilver.com/

Ed Steer’s Daily Analysis of the Gold and Silver Markets
After eight years of writing about the precious metals for Casey Research, the folks at Stansberry & Associates—who just recently purchased controlling interest in the company—decided that my ‘niche market’ column didn’t fit into their plans.
Since the time that Casey Research was kind enough to offer me a stand-alone column, it became their most highly-rated blog almost from the outset—and has remained that way up to this date...