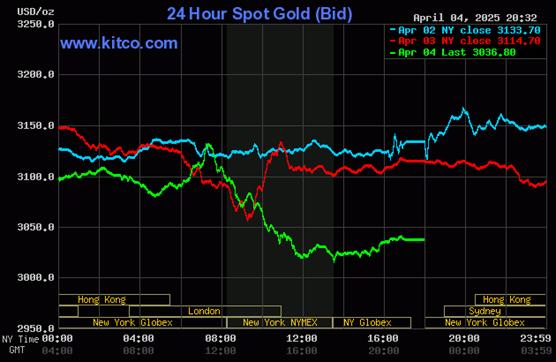
The gold price had a quiet and descending down/up move centered around 11:35 a.m. China Standard Time on their Friday morning, which ended at the 2:15 p.m. afternoon gold fix in Shanghai. It was then sold quietly lower until around 9:45 a.m. in Globex trading in London, with its ensuing rally running into 'something' at or shortly after the noon BST silver fix. Then the collusive commercial traders of whatever stripe really got serious -- and that engineered price decline lasted until around 11:35 a.m. in COMEX trading in New York. Its quiet up/down move from there ended at its 1:30 p.m. COMEX close low tick of the day -- and it took one quiet and broad step higher from that point until trading ended at 5:00 p.m. EDT.
The high and low ticks in gold were reported as $3,160.20 and $3,032.70 in the June contract... an intraday move of $127.50 the ounce. The April/June price spread differential in gold at the close in New York yesterday was $23.40 ...June/August was $24.90...August/October was $23.10 -- and October/ December was $22.80 an ounce.
Gold was closed in New York on Friday afternoon at $3,036.80 spot...down $77.90 on the day/2.50% -- and $22.80 off its Kitco-recorded low tick. Net volume was beyond Neptune once again at about 309,500 contracts -- and there were around 30,500 contracts worth of roll-over/switch volume on top of that.
I saw that 3,247 gold, plus only 61 silver contracts were traded in April yesterday -- and it will be of some interest as to how much of that shows up in tonight's Daily Delivery and Preliminary Reports.

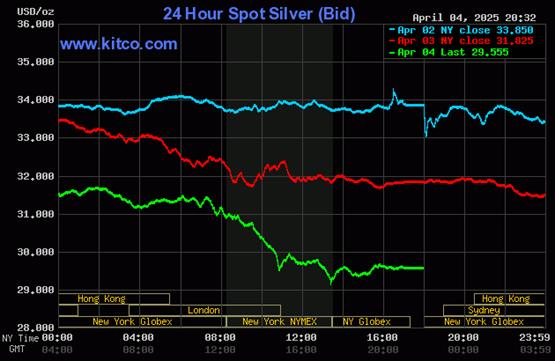
The bear raid by 'da boyz' in silver followed the same price path as gold's -- and they set its low tick five minutes before the 1:30 p.m. COMEX close in New York. From that juncture it took two tiny steps higher until trading ended at 5:00 p.m. EDT.
The high and low ticks in silver were recorded by the CME Group as $32.045 and $29.115 in the May contract...an intraday move of an eye-watering $2.93 an ounce. The May/July price spread differential in silver at the close in New York yesterday was 28.5 cents...July/September was 25.8 cents -- and September/December was 36.0 cents an ounce.
Silver was closed on Friday afternoon in New York at $29.555 spot...down another $2.27 from Thursday/7.13% -- and 44.5 cents off its Kitco-recorded low tick. Net volume was beyond Mars once again, but not as far beyond that planet as it was on Thursday, at a hair under 103,000 contracts -- and there were a bit under 23,500 contracts worth of roll-over/switch volume out of May and into future months in this precious metal...mostly July, but with very noticeable amounts into June, September and December as well.

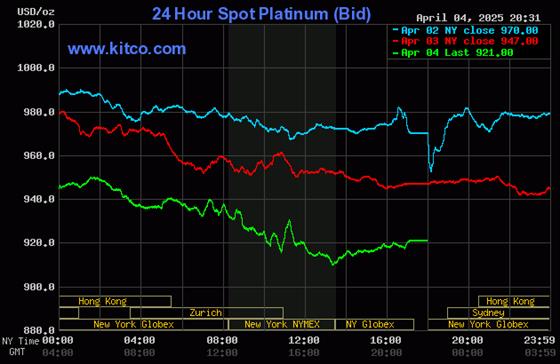
Platinum had a quiet and shallow down/up move in early Globex trading in the Far East on their Friday -- and that ended around 1:30 p.m. in Shanghai. The not-for-profit sellers appeared, setting its low tick about ten minutes before the 1:30 p.m. COMEX close in New York -- and from that point it crawled very quietly higher until trading ended at 5:00 p.m. EDT. Platinum was closed down a further 26 dollars at $921 spot -- and 11 bucks off its Kitco-recorded high tick.

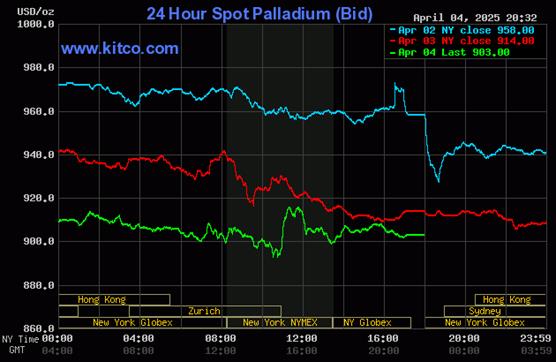
Palladium's engineered price decline was managed in a similar fashion as platinum's, except that it ended at the 11:00 a.m. EDT Zurich close. It then had the audacity to rally above unchanged shortly after that, but 'da boyz' appeared -- and that was that. Palladium was closed at $903 spot...down another 11 dollars.
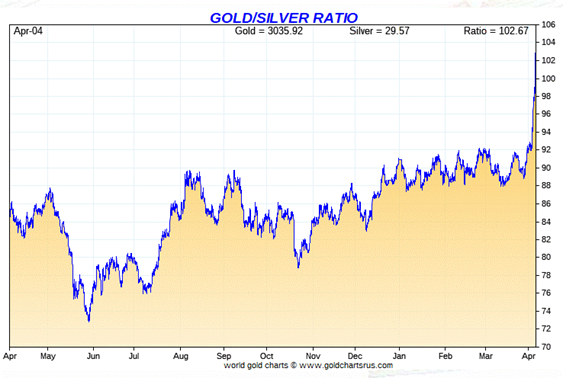
Based on the kitco.com spot closing prices in silver and gold posted above, the gold/silver ratio worked out to 102.8 to 1 on Friday...compared to 97.9 to 1 on Thursday.
Here's the 1-year Gold/Silver Ratio Chart...courtesy of Nick Laird. Click to enlarge.
![]()
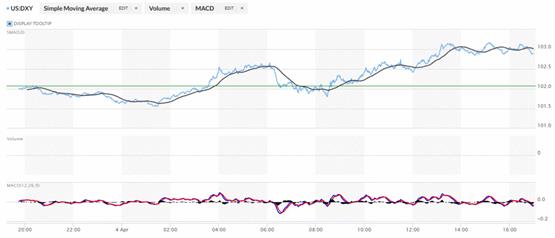
The dollar index was marked-to-close on Thursday afternoon in New York at 102.07 -- and then opened lower by 8 basis points once trading commenced at 7:45 p.m. EDT on Thursday evening...which was 7:45 a.m. China Standard Time on their Friday morning. After a brief tick higher, it began to wander/chop quietly lower -- and its low tick of the day was set around 1:27 p.m. CST. It then wandered broadly and unevenly higher until around five minutes before the COMEX close in New York -- and then wandered sideways to a bit lower until trading ended at 5:00 p.m. EDT.
The dollar index was marked-to-close in New York at 103.02...up 95 basis points from Thursday -- and 13 basis points above its indicated close on the DXY chart below.
Here's the DXY chart for Friday...thanks to marketwatch.com as usual. Click to enlarge.

Here's the 6-month U.S. dollar index chart...courtesy of stockcharts.com as always. The delta between its close...102.99...and the close on DXY chart above was 3 basis points below that. The dollar index traded in a 164 basis point range yesterday -- and has now bounced back above the oversold mark on its RSI trace by a bit. Click to enlarge.
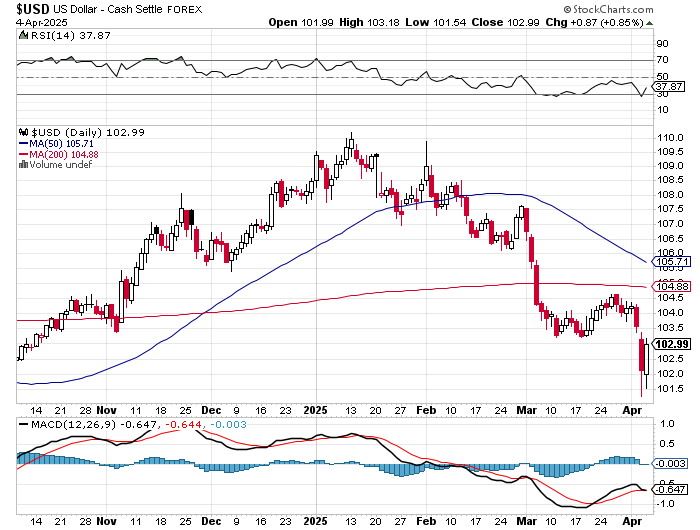

You should carefully note that on the two big dollar index down days on Wednesday and Thursday, gold and silver prices were crushed -- and crushed more on that dollar index 'rally' yesterday. As I've stated several times over the last week or so, it wouldn't at all surprise me if the 'da boyz' ran the DXY shorts in order to engineer gold prices lower, which is what they did yesterday. But even with the DXY down big after the Tuesday cut-off, 'da boyz' wouldn't allow that fact to be translated into higher precious metal prices. That's their iron fist price management scheme on full display.
U.S. 10-year Treasury: 3.9850%...down 0.0700/(-1.7263%)...as of the 1:59:50 p.m. CDT close
The ten-year quietly rallied above the 4% mark as the Friday trading session progressed -- and the Fed was obliged to step in minutes after 1 p.m. CDT to ensure that it closed with a '3' handle going into the weekend.
The 10-year closed down 27.00 basis points on the week.
Here's the 5-year 10-year U.S. Treasury chart from the yahoo.com Internet site -- which puts the yield curve into a somewhat longer-term perspective. Click to enlarge.
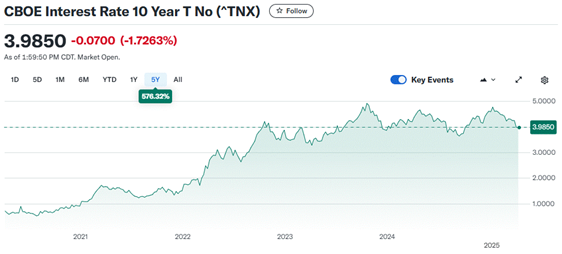
As I continue to point out in this spot every week, the 10-year hasn't been allowed to trade above its 4.92% high tick set back on October 15, 2023 -- and it's more than obvious from the above chart that it will he held at something under 5% until further notice, as yield-curve control is now firmly in place. However, I suspect that 4.00 percent will become a ceiling at some point as the year progresses and interest rates fall.
![]()
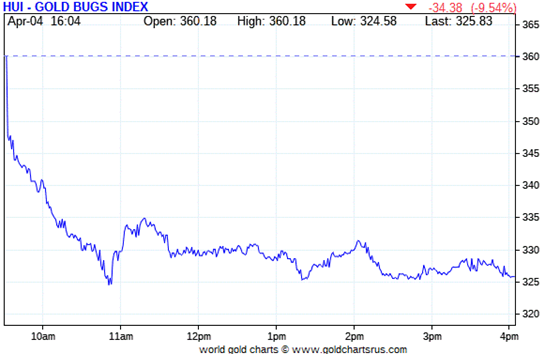
The gold shares gapped down at the 9:30 opens of the equity markets in New York on Friday morning -- and continued lower until their low ticks were set around 10:50 a.m. EDT. They bounced a bit higher until 11:15 a.m. -- and then proceeded to wander quietly lower until the markets closed at 5:00 p.m. EDT. The HUI was crushed by 9.54 percent.

The silver equities weren't spared either, as Nick Laird's 1-year Silver Sentiment Index closed down a whopping 12.59 percent. Click to enlarge.
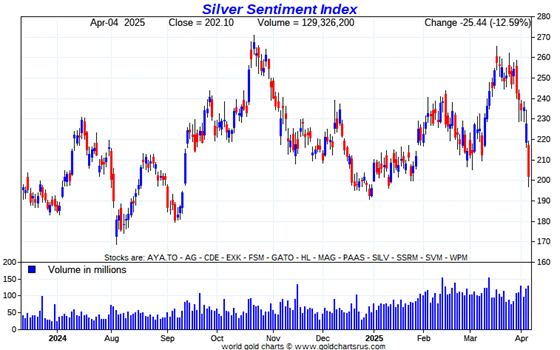

With no exceptions, it was wall-to-wall dogs yesterday.
But it should be carefully noted that all those hundreds of millions of precious metal shares sold in a panic, all found new buyers -- and they are much stronger hands than the ones that sold them.
I didn't see any news yesterday on any of the now eleven silver companies that comprise the above Silver Sentiment Index.
The silver price premium in Shanghai over the U.S. price on Friday is M.I.A. because China was closed for its Ching Ming Festival.
The reddit.com/Wallstreetsilver website, now under 'new' and somewhat improved management, is linked here. The link to two other silver forums are here -- and here.
![]()
Here are two of the usual three charts that appear in this spot in every weekend missive. They show the changes in gold, silver, platinum and palladium in both percent and dollar and cents terms, as of their Friday closes in New York — along with the changes in the HUI and the Silver Sentiment Index.
Here's the weeklychart...and it's pretty brutal...all thanks to the collusive commercial traders of whatever stripe. Click to enlarge.
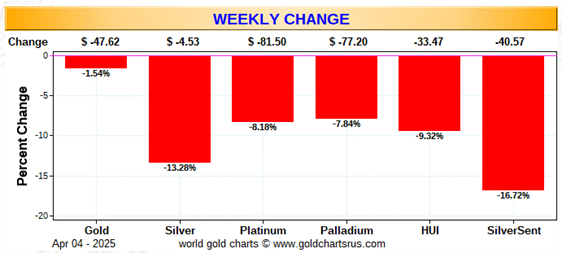
I passed on posting the month-to-date chart, as it's only includes the last four trading sessions -- and doesn't look much different that the weekly chart, as most of the precious metal damage came after the beginning of the month. It will return in this spot next week.
Here's the year-to-date chart -- and because of the pounding that the COMEX crooks have laid on silver since Wednesday, it and its associated equities are almost back to unchanged on the year. For that reason, everything gold-related looks better...but only because gold isn't down 13% on the week like silver is. Click to enlarge.
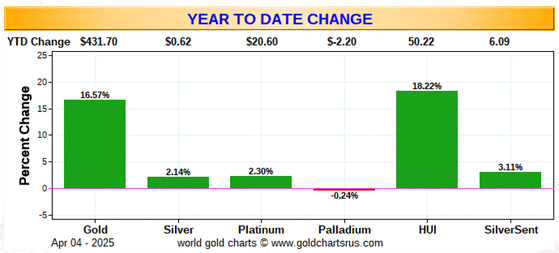
Of course -- and as I mention in this spot every Saturday -- and will continue to do so...is that if the silver price was sitting at a new all-time high of $50+ dollars an ounce, like gold is sitting close to its all-time high of $3,100 spot... it's a given that the silver equities would be outperforming their golden cousins ...both on a relative and absolute basis -- and by a country mile.
![]()
The CME Daily Delivery Report for Day 6 of April deliveries, showed that 1,505 gold -- and 65 silver contracts were posted for delivery within the COMEX-approved depositories on Tuesday.
In gold, the three biggest short/issuers were Goldman Sachs, Australia's Macquarie Futures and Wells Fargo Securities, issuing 700, 250 and 178 contracts out of their respective house accounts.
The biggest long/stopper was JPMorgan, picking up 455 contracts in total -- and 441 of those were for its client account. Next down the list was British bank Standard Chartered, stopping 380 contracts for its own account... followed by British bank HSBC, picking up 236 contracts in total -- and 153 of those contracts were for clients. The list goes on and on...
In silver, the two short/issuers were British bank HSBC and ADM, issuing 59 and 6 contracts out of their respective client accounts. The three largest long/stoppers were Wells Fargo Securities, Australia's Macquarie Futures -- and JPMorgan...picking up 32, 15 and 14 contracts respectively...JPMorgan for clients.
In platinum, there were a further 1,065 COMEX contracts issued and stopped.
The link to yesterday's Issuers and Stoppers Report is here -- and it's worth a quick look if you have the interest.
Month-to-date, there have been 52,434 gold contracts issued/reissued and stopped already -- and that number in silver is up to 2,150 COMEX contracts. In platinum it's 4,028 -- and in palladium...one contract.
The Preliminary Report for the Friday trading session showed that gold open interest in April dropped by 1,481 COMEX contracts, leaving 3,772 contracts still open -- and minus the 1,505 contracts out for delivery on Monday, as per the above Daily Delivery Report. Thursday's Daily Delivery Report showed that 3,225 gold contracts were actually posted for delivery on Monday, so that means that a further 3,225-1,481=1,844 gold contracts just got added to the April delivery month.
Silver o.i. in April declined by 214 COMEX contracts, leaving 450 still around...minus the 65 silver contracts out for delivery on Tuesday. Thursday's Daily Delivery Report showed that 240 silver contracts were posted for delivery on Monday, so that means that 240-214=26 more silver contracts were added to April deliveries.
Total gold open interest on Friday fell by a hefty and net 19,1336 COMEX contracts, which is pretty decent. But total silver o.i. fell by only 183 contracts...so besides long selling by the Managed Money traders et al...there had to have been massive shorting going on a well.
[I checked the final total open interest number in gold for the Thursday trading session -- and it showed a decrease from the previous nights Preliminary Report...from -7,302 contracts, down to -8,712 contracts. Total silver open interest also fell...it from -3,809 contracts, down to -4,848 COMEX contracts -- and the more the better, as always.]
![]()
After a big addition to GLD on Thursday, there was a largish withdrawal on Friday, as an authorized participant removed 110,659 troy ounces of gold. There was finally an addition to SLV, as an authorized participant added 909,818 troy ounces of silver to it.
The SLV borrow rate started the Friday session at 2.36%...and finished it at 2.27%...with 3.1 million shares available. The GLD borrow rate started the day at 1.02% -- and closed at 1.33%...with 4.9 million shares available for shorting purposes.
In other gold and silver ETFs and mutual funds on Planet Earth on Friday...net of any changes in COMEX, GLD and SLV activity, showed that a net 196,876 troy ounces of gold added...but a net 1,436,298 troy ounces of silver were removed involving five different depositories/ETFs.
There was no sales report from the U.S. Mint on Friday -- and nothing in April so far.
And still nothing from the Royal Canadian Mint for Q4/2024.
![]()
There was only a tiny amount of gold reported received over at the COMEX-approved depositories on the U.S. east coast on Thursday. The only 'in' action there was were the 800 kilobars/25,720.800 troy ounces received at Loomis International -- and the only 'out' amount were the 675 troy ounces that departed the International Depository Services of Delaware. There was no paper activity at all. The link to this is here.
But that was far from the case in silver, as 5,145,798 troy ounces were reported received -- and nothing was shipped out. The two largest 'in' amounts were the four truckloads/2,398,860 troy ounces received at Loomis International -- and the three truckloads/1,818,943 troy ounces that arrived at JPMorgan.
There was a bit of paper activity, as 130,254 troy ounces were transferred from the Eligible category and into Registered -- and no doubt going out for immediate delivery. The largest amount there were the 125,346 troy ounces transferred that direction over at Manfra, Tordella & Brookes, Inc.
The link to all off Thursday's impressive COMEX silver action is here.
The Shanghai Futures Exchange didn't have a report today because of that above-mentioned holiday. They'll be open again on Monday.
![]()
Here are the usual 20-year charts that show up in this space in every weekend column. They show the total amounts of physical gold and silver held in all known depositories, ETFs and mutual funds as of the close of business on Friday.
During the week just past, there were a net 2.032 million troy ounces of gold added...with almost all of that going into the COMEX -- plus a net 13.849 million troy ounces of silver were were also added during that same time period, with almost all of it going into the COMEX as well. Click to enlarge.
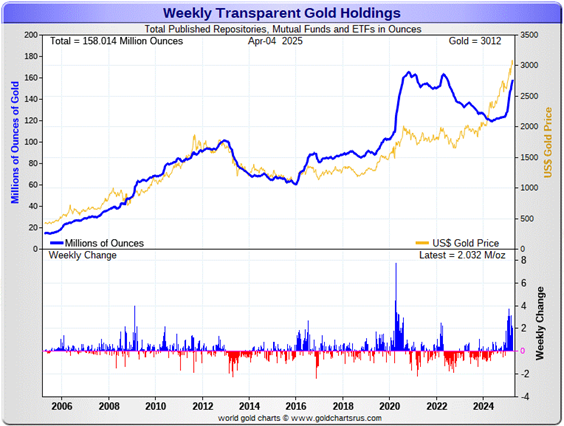
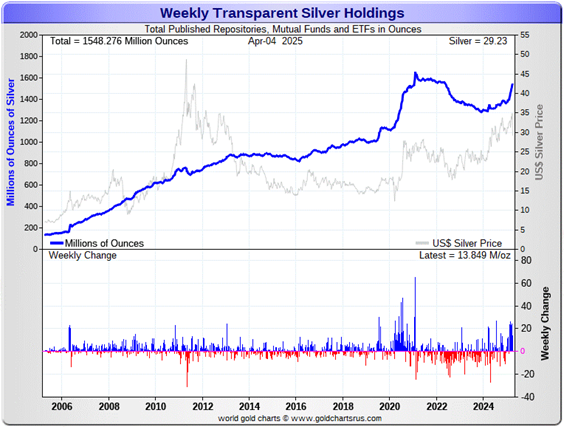
According to Nick Laird's data on his website, a net 8.856 million troy ounces of gold were added to all the world's known depositories, mutual funds and ETFs during the last four weeks -- with a net 6.541 million oz. of it going into either the COMEX or GLD...mostly the former. And a net 68.799 million troy ounces of silver were were also added during that same time period, with a net 59.799 million oz. of that amount going into the COMEX... 9.874 million into SLV -- and 2.101 million troy ounces into Sprott's PSLV.
Retail bullion sales, from what I've heard from my sources, are barely OK -- and premiums remain at rock bottom, with no signs that they've been raising them. It remains a buyer's market for physical at the retail level for the moment.
At some point there will be large quantities of silver required by all the ETFs and mutual funds once serious institutional buying really kicks in -- and there were some signs of that, both this week and last. But for the moment, the only silver movements that matter remains with the COMEX and SLV, as it still a big boy's game.
The really big buying lies ahead of us when the silver price is finally allowed to rise substantially, which I'm sure is something that the powers-that-be in the silver world are keenly aware of. Their efforts to prevent that from happening were on full display again this week, especially on Thursday and Friday...but can't last forever. I have more on this in The Wrap.
And as Ted stated some time ago now, it stands to reason that JPMorgan has parted with most of the at least one billion troy ounces that they'd accumulated since the drive-by shooting that commenced at the Globex open at 6:00 p.m. EDT on Sunday, April 30, 2011.
They had to supply huge amounts to both India and China in 2024 -- and one has to suspect that this amount of demand will continue in 2025 as well...if not increase further. I also suspect that most of the silver flown into the COMEX from London so far this year...194 million ounces...came from their stash. But they continue to build their COMEX silver reserves in New York regardless.
Nothing has changed from last week, as the physical demand in silver at the wholesale level continues unabated -- and was 'peddle-to-the-metal' ginormous again this past week...as it's been every week so far this year. The amount of silver being physically moved, withdrawn, or changing ownership remains breath-taking... including April deliveries, where over 10 million oz. have been delivered so far.
That was also on prominent display during the December delivery month, as 40.435 million troy ounces of physical silver were delivered/changed hands, along with the 11.85 million troy ounces of silver in January. In February, there were 23.94 million troy ounces issued and stopped...4,788 COMEX contracts -- and 76.95 million ounces in March. I have a bit more on this in The Wrap.
New silver has to be brought in from other sources [JPMorgan in London] and elsewhere to meet the ongoing demand for physical metal...as the metal currently sitting in New York is already spoken for and not for sale. That's been more than obvious on the COMEX since the beginning of the year -- and as mentioned a bit further up, where 59.80 million oz. have been flow in from London in the last four weeks...plus the 13.65 million oz. added to SLV the Monday prior. This demand will continue until available supplies are depleted... which will most likely be the moment that JPMorgan & Friends stop providing silver to feed this deepening structural deficit, now in its fifth year.
The vast majority of precious metals being held in these depositories are by those who won't be selling until the silver price is many multiples of what it is today.
Sprott's PSLV is the third largest depository of silver on Planet Earth with 182.7 million troy ounces...up 0.1 million ounces from last week -- but a great distance behind the COMEX, now the largest silver depository, where there are 490.1 million troy ounces being held...up a net 17.7 million troy ounces this past week...but minus the 103 million troy ounces being held in trust for SLV by JPMorgan.
That 103 million ounce amount brings JPMorgan's actual silver warehouse stocks down to around the 95 million troy ounce mark...quite a bit different than the 198.1 million they indicate they have...up a net 7.7 million ounces on the week.
PSLV remains a very long way behind SLV as well -- as they are now the second largest silver depository after the COMEX, with 446.3 million troy ounces as of Friday's close...down a net 2 million troy ounces on the week.
The latest short report [for positions held at the close of business on Friday, March 14] showed that the short position in SLV rose by 30.85%...from the 49.15 million shares sold short in the prior report...up to 64.31 million shares in this latest report...a hair over 13% of total SLV shares outstanding. This amount remains grotesque, obscene -- and fraudulent beyond description...as there is no physical silver backing any of it.
BlackRock issued a warning several years ago to all those short SLV, that there might come a time when there wouldn't be enough metal for them to cover. That would only be true if JPMorgan decides not to supply it to whatever entity requires it...which is most certainly a U.S. bullion bank, or perhaps more than one.
The next short report...for positions held at the close of trading on Monday, March 31...will be posted on The Wall Street Journal's website on Wednesday evening EDT on April 9.
Then there's that other little matter of the 1-billion ounce short position in silver held by Bank of America in the OTC market...with JPMorgan & Friends on the long side. Ted said it hadn't gone away -- and he'd also come to the conclusion that they're short around 25 million ounces of gold with these same parties as well.
The latest report on Bank Trading and Derivatives Activity for Q4/2024 from the OCC came out last Friday -- and I thank Justin Newman for sending it along. However, my computer still won't open the .xml file that contains the charts and data -- and I just haven't had the time to sort this out.
But as I keep pointing out in this spot every weekend, the OCC indicator is flawed for two very important reasons, as way back 10-15 years ago, this report used to include the top dozen or so U.S. banks -- and included the likes of Wells Fargo and Morgan Stanley, amongst others...that are card-carrying members of the Big 8 shorts. Now the list is down to just four banks...so a lot of data is hidden...which is certainly the reason why the list was shortened. On top of that, the list doesn't include the non-U.S. banks that are members of the Big 8 shorts: British, French, German -- and Canadian.
![]()
The Commitment of Traders Report, for positions held at the close of COMEX trading on Tuesday, turned in very positive surprises in both silver and gold.
I had said in my Thursday missive that..."The five candles of the reporting week in their respective six-month charts above, certainly suggests that there will be some increase in the commercial net short position in gold -- and maybe a smallish decrease in the Commercial net short position in silver."
I was wrong on both counts, as there were fairly substantial declines in both...which makes no sense when the candles of the past reporting week are given even a cursory glance. But they are what they are -- and I shan't look this particular gift horse in the mouth.
In silver, the Commercial net short position declined by a decent 4,300 COMEX contracts, or 21.5 million troy ounces of the stuff.
They arrived at that number by increasing their long position by 2,337 contracts -- and also bought back 1,963 short contracts. It's the sum of those two numbers that represents their change for the reporting week.
Under the hood in the Disaggregated COT Report it was all Managed Money traders -- and almost right to the contract, as they decreased their net long position by 4,373 COMEX contracts...which they accomplished through the sale of 1,833 long contracts, plus they sold 2,540 short contracts. It's the sum of those two numbers that represents their change for the reporting week.
The traders in the Other Reportables and Nonreportable/small trader categories basically cancelled each other out...as the former increased their net long position by 681 COMEX contracts -- and the latter reduced their net long position by 608 contracts.
Doing the math: 4,373 minus 681 plus 608 equals 4,300 COMEX contracts...the change in the Commercial net short position.
The Commercial net short positionin silver now stands at 76,405 COMEX contracts/382.025 million troy ounces...down those 4,300 contracts from the 80,705 COMEX contracts/403.525 million troy ounces that they were short in last Friday's COT Report.
The Big 4 shorts decreased their net short position by 659 COMEX contracts... from 57,334 contracts, down to 56,675 contracts.
The Big '5 through 8' shorts decreased their net short position by 215 COMEX contracts...from the 20,809 contracts in last Friday's COT Report, down to 20,594 contracts in yesterday's COT Report.
The Big 8 shorts in total decreased their overall net short position from 78,028 contracts, down to 77,269 COMEX contracts week-over-week...a decrease of 759 COMEX contracts.
But since the Commercial net short position fell by 4,300 contracts in yesterday's COT Report -- and the Big 8 decreased their net short position by only 759 contracts, this meant that Ted's raptors...the small commercial traders other than the Big 8...had to have been buyers during the reporting week -- and they were, for the second week in a row...decreasing their short position by 4,300-759=3,541 COMEX contracts.
This flips them from a short position of 2,677 contracts in last week's COT Report, to a long position of 864 contracts in yesterday's.
Here's Nick's 9-year COT chart for silver -- and updated with the above data. Click to enlarge.
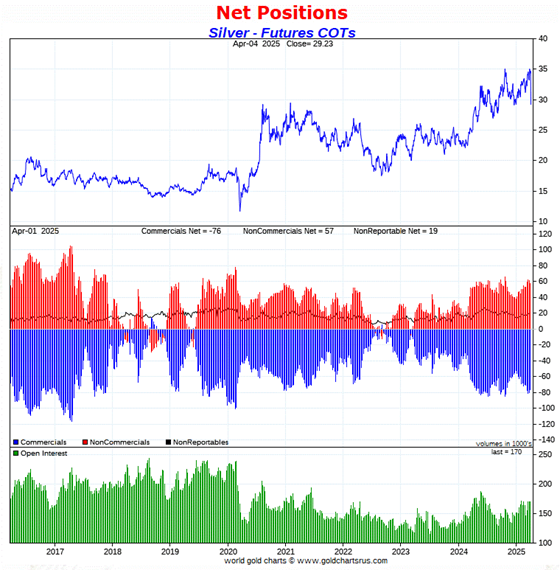
Of course all the numbers above are totally irrelevant because of the bear raid by the collusive commercial shorts since the Tuesday cut-off -- and when I said in yesterday's column that today's COT data should be read for 'entertainment purposes only'...I wasn't kidding.
Now the food fight is on in the commercial category. Which group of collusive commercial traders benefited the most from this current [and hopefully last] engineered price decline...the Big 4, the Big '5 through 8'...or Ted's raptors?
These three groups will be fighting each other to scoop up as many long contracts as possible from the Managed Money traders et al...as they puke up long contracts in a panic -- and go short.
In yesterday's irrelevant COT Report, The Big 8 collusive commercial traders were net short 45.4 percent of the total open interest in silver, compared to the 46.0 percent they were net short in the last COT Report.
And nothing has changed with regards to that ongoing and deepening structural deficit in the physical market...which is now in its fifth consecutive year.
As it's been for decades, it only matters what the collusive Big 8 commercial traders do... especially the Big 1 or 2...both of which are U.S. bullion banks, I'm sure.
Of course not to be forgotten -- and which also has a huge and negative impact on the silver price, is the outrageous and grotesque short position in SLV...64.31 million shares/troy ounces...as of last short report that came out a bit over ten days ago. The next short report, for positions held at the close of COMEX trading on March 31, will be posted on the WSJ's website early Tuesday evening on April 9.
![]()
In gold, the commercial net short position declined by a surprising 13,537 COMEX contracts, or 1.354 million troy ounces of the stuff.
They arrived at that number through the sale of 17,963 long contracts, but bought back 31,500 short contracts -- and it's the difference between those two numbers that represent their change for the reporting week.
But it was wild under the hood in the Disaggregated COT Report, as the Managed Money traders reduced their net long position by an eye-watering 32,733 contracts...which they accomplished by reducing their long position by 8,672 contracts -- and also sold 24,061 short contracts. It's the sum of those two numbers that represents their change for the reporting week.
It was equally eye-opening in the Other Reportables category, as they increased their net long position by 21,371 COMEX contracts...mostly through the addition of 20,036 long contracts. The Nonreportable/small traders decreased their net long position by 2,175 contracts.
Doing the math: 32,733 minus 21,371 plus 2,175 equals 13,537 COMEX contracts...the change in the commercial net short position.
The commercial net short position in gold now sits at 265,061 COMEX contracts/26.506 million troy ounces of the stuff...down those 13,537 contracts from the 278,598 COMEX contracts/27.860 million troy ounces they were short in last Friday's COT Report.
The Big 4 shorts in gold decreased their net short position by 12,505 contracts this reporting week...from 141,680 contracts they were short in the last COT report, down to 129,175 contracts in yesterday's report. This is their smallest short position since March 1 of last year -- and vastly improved from the 198,271 contracts there were net short in the January 21 COT Report.
But the Big '5 through 8' shorts increased their net short position in yesterday's report...from 72,565 contracts they were short in last Friday's COT Report, up to 79,799 contracts held short in the current report...an increase of 7,234 COMEX contracts.
The Big 8 short position increased from 208,173 contracts/20.817 million troy ounces in last Friday's COT Report...up to 208,974contracts/20.897 million troy ounces in yesterday's...an increase of a tiny 801 COMEX contracts.
But since the commercial net short position fell by 13,537 COMEX contracts during the reporting week -- and the Big 8 commercial short position actually increased by 801 COMEX contracts, that meant that Ted's raptors...the small commercial traders other than the Big 8 had to have been huge long buyers during the reporting week -- and they were. They decreased their grotesque short position by 13,537+801=14,338 COMEX contracts. Their short position is down to 56,087 contracts...from the 70,425 contract short position they held in last Friday's COT Report.
And after that big increase in the gross short position in the Managed Money trader category in yesterday's COT Report, it's a certainty that there are now two rogue managed money traders with large enough short positions to be somewhere in the Big '5 through 8' commercial category. They've made a lot of money since they established those short positions.
Here's Nick's 9-year COT chart for gold -- and updated with the above data. Click to enlarge.
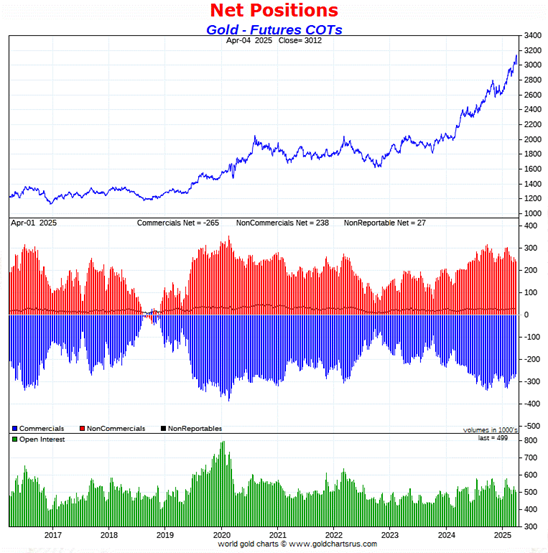
Of course all those numbers above mean nothing now after the bear raid in gold that's been ongoing since the beginning of the week.
The Big 8 collusive traders are short 41.9 percent of total open interest in gold in the COMEX futures market...up from the 40.7 percent they were short in the prior COT Report. The sole reason that the percentage number increased instead of decreasing was because of the 12,736 contract drop in total open interest, which obviously affects the calculation.
However, from a Big 8 short perspective, the set-up for them is borderline very bullish after Friday's price action...even though neither of gold's 50 or 200-day moving average have been penetrated to the downside as of yet.
And despite the slight increase in the commercial net short position of the Big 8 traders in yesterday's COT Report...their collective short positions are down to just about what they were back on March 8 of last year. Needless to say, the short position of the Big 8 has imploded since the Tuesday cut-off...as has the short position of Ted's raptors, the small commercial traders other than the Big 8.
And once you remove the influence of the now two rogue Managed Money trader that currently contaminates that Big 8 commercial net short position, the set-up in gold is ever more bullish than just stated in the previous two paragraphs.
So it's a whole new ball game from a COMEX futures market perspective in both gold and silver as of the close of trading on Friday -- and I'll have more on this in The Wrap.
![]()
In the other metals, the Managed Money traders in palladium decreased their net short position by a further 1,821 COMEX contracts -- and remain net short palladium by 9,661 contracts...48.4 percent of total open interest. The commercial traders in the Producer/ Merchant category remain on the short side for the fourth week in a row, them by a tiny 628 COMEX contracts...but the commercial traders in the Swap Dealers category remain mega net long palladium by 7,664 contracts. The traders in the Other Reportables and Nonreportable/ small trader categories remain net long by decent amounts as well.
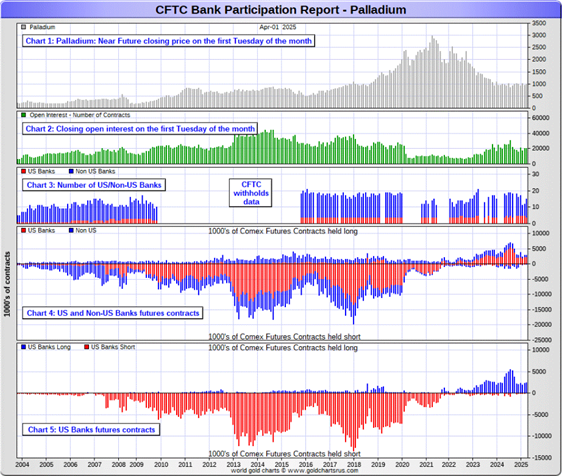
And it shouldn't be forgotten that the world's banks remain net long 13.1 percent of the total open interest in palladium in the COMEX futures market as of yesterday's Bank Participation Report.
In platinum, the Managed Money trader didn't do much, as they decreased their net long position by only 438 COMEX contracts during the reporting week -- and remain net long platinum by 3,013 COMEX contracts.
The commercial traders in the Producer/Merchant category in platinum are meganet short a knee-wobbling 24,5601 COMEX contracts -- but the Swap Dealers in the commercial category are net long 5,064 contracts. The traders in both the Other Reportables and Nonreportable/small traders categories remain net long platinum by very hefty amounts...especially the Other Reportables.
It's mostly the world's banks in the Producer/Merchant category that are 'The Big Shorts' in platinum in the COMEX futures market, as per April's Bank Participation Report that came out yesterday -- and have decreased their short position in platinum by a bit since the March report, especially the U.S. banks.
In copper, the Managed Money traders decreased their net long position by 2,264 contracts -- and remain net long copper by 34,432 COMEX contracts... about 861 million pounds of the stuff as of yesterday's COT Report...down from the 917 million pounds they were net long copper in last Friday's COT report.
Copper, like platinum, continues to be a wildly bifurcated market in the commercial category. The Producer/Merchant category is net short 40,088 copper contracts/1.002 billion pounds -- while the Swap Dealers are net long 8,979 COMEX contracts/224 million pounds of the stuff.
Whether this means anything or not, will only be known in the fullness of time. Ted said it didn't mean anything as far as he was concerned, as they're all commercial traders in the commercial category. However, this bifurcation has been in place for as many years as I can remember -- and that's a lot.
In this vital industrial commodity, the world's banks...both U.S. and foreign... are net long 7.3 percent of the total open interest in copper in the COMEX futures market as shown in the April Bank Participation Report that came out yesterday -- and down a bit from the 9.2 percent they were net long in February's.
At the moment it's the commodity trading houses such as Glencore and Trafigura et al., along with some hedge funds, that are net short copper in the Producer/Merchant category, as the Swap Dealers are net long, as pointed out above.
But, like the COT data further up, the data for these 'other metals' is very much yesterday's news as well.
The next Bank Participation Report is due out next Friday, May 9.
![]()
Here’s Nick Laird’s “Days to Cover” chart, updated with the COT data for positions held at the close of COMEX trading on Tuesday, April 1. It shows the days of world production that it would take to cover the short positions of the Big 4 — and Big '5 through 8' traders in every physically traded commodity on the COMEX. Click to enlarge.
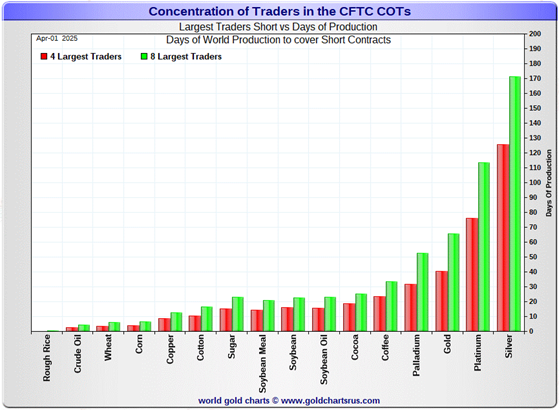
In this week's data, the Big 4 traders are short 126 days of world silver production... down about 1 day from the prior COT report. The ‘5 through 8’ large traders are short an additional 45 days of world silver production...also down about a day from the last COT Report, for a total of about 171 days that the Big 8 are short -- and obviously down about 2 days from last Friday's COT report.
Those 171 days that the Big 8 traders are short, represents around 5.7 months of world silver production, or 386.345 million troy ounces/77,269 COMEX contracts of paper silver held short by these eight commercial traders. Several of the largest of these are now non-banking entities, as per Ted's discovery a year or so ago. April's Bank Participation Report continued to confirm that this is still the case -- and not just in silver, either.
The small commercial traders other than the Big 8 shorts, Ted's raptors reduced their short position from 2,677 contracts in last Friday's COT Report... and are now long silver in the COMEX futures market by 864 contracts.
In gold, the Big 4 are short about 41 days of world gold production...down about 4 days from the prior COT Report. The Big '5 through 8' are short an additional 25 days of world production, up about 5 days from last the last report...for a total of 66 days of world gold production held short by the Big 8 -- and obviously up 1 day from last Friday's COT Report.
As mentioned further up, the Big 8 commercial traders are net short 45.4 percent of the entire open interest in silver in the COMEX futures market as of yesterday's COT Report, down a tiny bit from the 46.0 percent they were net short in last Friday's report.
In gold, it's 41.9 percent of the total COMEX open interest that the Big 8 are net short, up a bit from the 40.7 percent they were net short in the last COT Report -- and would have been less than that, except for the 12,736 contract decrease in total open interest during the reporting week, which obviously affects the calculation.
But the total commercial net short position in gold is 53.1 percent of total open interest once you add in what Ted's raptors [the small commercial traders other than the Big 8] are short on top of that...a further 56,087 COMEX contracts. That percentage number would have also been lower except for that increase in total open interest.
Of course all this data is 'yesterday's news' as well.
Ted was of the opinion that Bank of America is short about one billion ounces of silver in the OTC market, courtesy of JPMorgan & Friends. He was also of the opinion that they're short 25 million ounces of gold as well.
And the latest OCC report from late December [for Q3/2024] showed that their positions are up 20 percent from what they were holding at the end of Q2/2024...with most of that increase most likely being price related. The new OCC report for Q4/2024 is available, but my computer won't open the document for some strange reason.
The short position in SLV now sits at 64.31 million shares as of the last short report that came out ten days ago, for positions held at the close of COMEX trading on Friday, March 14...up a chunky 30.85 percent from the 49.15 million shares sold short on the NYSE in the prior report. This number remains off-the-charts grotesque and obscene -- and yet another way that 'da boyz' are controlling the silver price.
The next short report is due out Wednesday, April 9...for positions held at the close of COMEX trading on Monday, March 31.
The fall-out from the bear raids in both silver and gold since the Tuesday cut-off suggests that from a COMEX futures market perspective, the set-up both gold and silver is now bullish to very bullish. However, I'll want to see next Friday's COT Report before posting the 'all clear'...if we make it until then with the set-up we have as of the COMEX close yesterday.
As Ted had been pointing out ad nauseam, the resolution of the Big 4/8 short positions will be the sole determinant of precious metal prices going forward -- although the monster-but-shrinking short position held by his raptors in gold is still of some concern.
![]()
The April Bank Participation Report [BPR] data is extracted directly from yesterday's Commitment of Traders Report data. It shows the number of futures contracts, both long and short, that are held by all the U.S. and non-U.S. banks as of Tuesday’s cut-off in all COMEX-traded products.
For this one day a month we get to see what the world’s banks have been up to in the precious metals. They’re usually up to quite a bit -- and they certainly were again this past month...but not as much as earlier months, which I found quite surprising considering the run-up in gold and silver prices.
[The April Bank Participation Report covers the four-week time period from March 4 to April 1 inclusive]
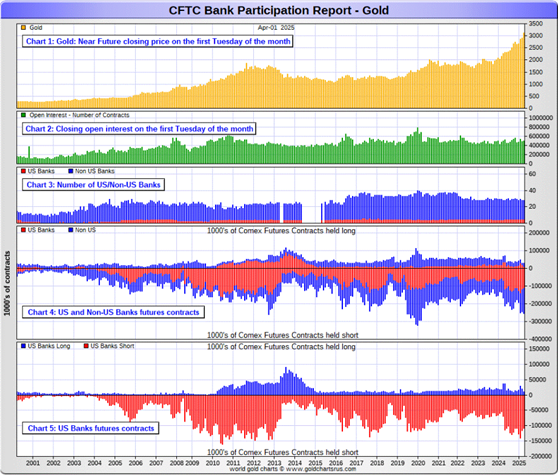
In gold, 5 U.S. banks are net short 97,959 COMEX contracts, up only 1,219 contracts from the 96,740 contracts that these same 5 U.S. banks were net short in the March BPR. This is not a lot considering how much gold ran up in price during March.
Also in gold, 23 non-U.S. banks are net short 127,926 COMEX contracts, up a further 8,858 contracts from the 119,068 contracts that these same 23 non-U.S. banks were short in March's BPR...their largest short position since August 2019 -- and their second highest short position on record. In the last three months these non-U.S. banks have added a net and whopping 86,528 short contracts.
At the low back in the August 2018 BPR...these non-U.S. banks held a net short position in gold of only 1,960 contacts -- so they've been back on the short side in a gargantuan way ever since. Only a tiny handful of these banks hold a meaningful short position in gold. The short positions of the rest are of no consequence -- and never have been. A few of them may actually be net long gold by a bit.
Although a lot of the largest U.S. and foreign bullion banks are in the Big 8 short category in gold, some of the hedge fund/commodity trading houses are short even more grotesque amounts of gold than the banks in the Big 4/8 category.
It's also a strong possibility that the BIS could be short gold in the COMEX futures market as well.
As of April's Bank Participation Report, 28 banks [both U.S. and foreign] were net short 45.3 percent of the entire open interest in gold in the COMEX futures market...up from the 44.1 percent that these same 28 banks were net short in the March BPR. This is an obscene and manipulative short position.
Here’s Nick’s BPR chart for gold going back to 2000. Charts #4 and #5 are the key ones here. Note the blow-out in the short positions of the non-U.S. banks [the blue bars in chart #4] when Scotiabank’s COMEX short position was outed by the CFTC in October of 2012. Click to enlarge.
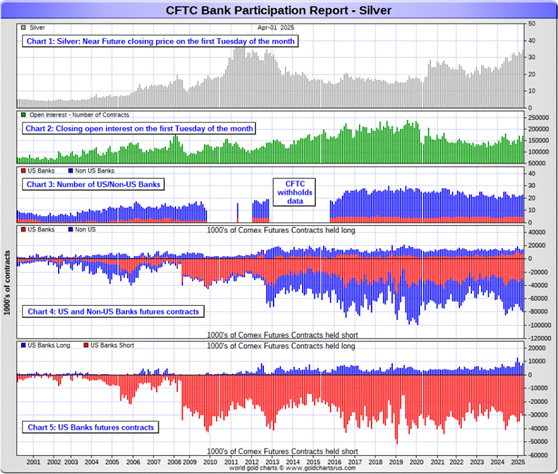
In silver, 5 U.S. banks are net short 21,890 COMEX contracts, up a tiny 118 contracts from the 21,772 contracts that these same 5 U.S. banks were short in the March BPR...which is a negligible amount considering the big rally in silver over at that time period.
The short holders in silver of the five U.S. banks in total, would be Citigroup, Wells Fargo, Bank of America, Goldman Sachs and JPMorgan.
Also in silver, 18 non-U.S. banks are net short 42,806 COMEX contracts, up a further 1,075 contracts from the 41,731 contracts that that 17 non-U.S. banks were net short in the March BPR...their biggest short position in silver since March 2020. In the last three months, these non-U.S. banks have added a net 16,141 short contracts in silver.
It's a safe bet that the non-U.S. bank[s] that have increased their short position in silver over the last three months, is/are the same bank[s] that have increased their short position[s] in gold over that same time period.
It's a given, based on silver deliveries so far this year, that HSBC, Barclays, Standard Chartered, BNP Paribas and Macquarie Futures hold by far the lion's share of the short position of these non-U.S. banks...as do some of Canada's banks as well...with the Bank of Montreal and Scotia Capital/Scotiabank coming to mind.
And, like in gold, the BIS could also be actively shorting silver. However, the remaining short positions divided up between the remaining small handful of non-U.S. banks are immaterial — and have always been so....the same as most of the 20 non-U.S. banks in gold as well.
As of April's Bank Participation Report, 23 banks [both U.S. and foreign] were net short 38.0 percent of the entire open interest in silver in the COMEX futures market — and down big from the 43.5 percent that 22 banks were net short in the March BPR...and only down because of the huge increase in silver open interest during the month, which affects the percentage calculation.
Here’s the BPR chart for silver. Note in Chart #4 the blow-out in the non-U.S. bank short position [blue bars] in October of 2012 when Scotiabank was brought in from the cold. Also note August 2008 when JPMorgan took over the silver short position of Bear Stearns—the red bars. It’s very noticeable in Chart #4—and really stands out like the proverbial sore thumb it is in chart #5. Click to enlarge.
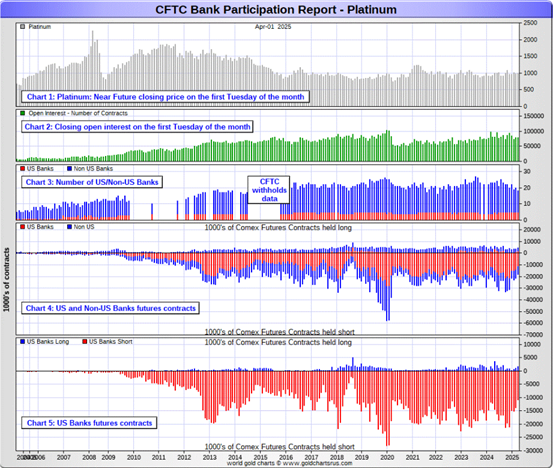
In platinum, 5 U.S. banks are net short 9,194 COMEX contracts in the April BPR, down a decent 3,587 contracts from the 12,781 contracts that these same 5 U.S. banks were short in the March BPR -- but still an horrific amount.
At the 'low' back in September of 2018, these U.S. banks were actually net long the platinum market by 2,573 contracts. So they have a very long way to go just to get back to market neutral in platinum...if they ever intend to, that is. They look permanently stuck on the short side to me, a fact that I point out from time to time.
Also in platinum, 13 non-U.S. banks decreased their net short position by only 480 contracts...from 5,142 contracts held by 15 banks in March's BPR... down to 4,662 contracts in the April BPR.
Back in the December 2023 BPR, these non-U.S. banks were net short a microscopic 35 platinum contracts...so they've got work to do if they ever want to get back to that number.
As you already know, platinum remains the big commercial shorts No. 2 problem child after silver. How it will ultimately be resolved is unknown, but most likely in a paper short squeeze, as the known stocks of platinum are minuscule compared to the size of the short positions held -- and that's just the short positions of the world's banks I'm talking about here.
Of course there's now a long-term structural deficit in it [and palladium] as well.
And as of April's Bank Participation Report, 18 banks [both U.S. and foreign] were net short 17.5 percent of platinum's total open interest in the COMEX futures market, down from the 22.6 percent that 20 banks were net short in March's BPR.
Here's the Bank Participation Report chart for platinum. Click to enlarge.
In palladium, 4 U.S. banks are net long 2,344 COMEX contracts in the April BPR, up 175 contracts from the 2,169 contracts that that 5 U.S. banks were net long in the March BPR.
Also in palladium, 11 non-U.S. banks are net long 284 COMEX contracts... down from the 647 contracts that 7 non-U.S. banks were net long in the February BPR.
And as I've been commenting on for almost forever, the COMEX futures market in palladium is a market in name only, because it's so illiquid and thinly-traded. Its total open interest in yesterday's COT Report was only 19,975 contracts...compared to 78,874 contracts of total open interest in platinum...170,197 contracts in silver -- and 498,746 COMEX contracts in gold.
Total open interest in palladium has increased quite a bit over the last number of years, because I remember when it was less than 9,000 contracts. So it's nowhere near as illiquid as it used to be -- and it's also been helped along by the fact that the bid/ask is now only 40 bucks. It used to be $150 at one point way back when.
As I say in this spot every month, the only reason that there's a futures market at all in palladium, is so that the Big 8 commercial traders can control its price. That's all there is, there ain't no more.
As of this Bank Participation Report, 15 banks [both U.S. and foreign] are net long 13.1 percent of total open interest in palladium in the COMEX futures market...down from the 14.1 percent of total open interest that 12 banks were net long in the March BPR.
For the last 5 years or so, the world's banks have not been involved in the palladium market in a material way...see its chart below. And with them still net long, it's almost all hedge funds and commodity trading houses that are left on the short side. The Big 8 commercial shorts, none of which are banks, are short 48.5 percent of total open interest in palladium as of yesterday's COT Report...down from the 50.6 percent they were short in March's BPR.
Here’s the palladium BPR chart. Although the world's banks are net long at the moment, it remains to be seen if they return as big short sellers again at some point like they've done in the past. Click to enlarge.
Excluding palladium for obvious reasons, and almost all of the non-U.S. banks in gold, silver and platinum...only a handful of the world's banks, most likely no more than a dozen or so in total -- and mostly U.S. and U.K.-based...along with French bank BNP Paribas...continue to hold meaningful short positions in the other three precious metals...although I won't let Canada's Bank of Montreal or Scotia Capital/Scotiabank off the hook just yet...nor Deutsche Bank in gold.
As I pointed out above, some of the world's commodity trading houses and hedge funds are also mega net short the four precious metals...far more short than the U.S. banks in some cases. They have the ability to affect prices if they choose to exercise it...which I'm sure they're doing at times -- and this is particularly obvious in the thinly-traded and illiquid palladium market. But it's still the collusive Anglo/American bullion bank cartel in the commercial category that are at Ground Zero of the price management scheme in the COMEX futures market in the other three.
And as has been the case for years now, the short positions held by the Big 4/8 traders is the only thing that matters...especially the short positions of the Big 4...or maybe only the Big 1 or 2 in both silver and gold. How this is ultimately resolved [as Ted kept pointing out] will be the sole determinant of precious metal prices going forward.
The Big 8 commercial traders continue to have an iron grip on their respective prices -- and that was on full display for the entire world to see since the Tuesday cut-off. That circumstance will continue until they either relinquish control voluntarily, are told to step aside...or get overrun.
Considering the current state of affairs of the world as they stand today -- and the structural deficit in silver -- and now in platinum and palladium as well, the chance that these big bullion banks and commodity trading houses could get overrun at some point, is no longer zero -- and certainly within the realm of possibility if things go totally non-linear, as they just might if the drain on LBMA gold and silver stockpiles continues.
But...as Ted kept reminding us from time to time...if they do finally get overrun, it will be for the very first time...which obviously wasn't allowed to happen this past month, either.
The next Bank Participation Report is due out on Friday, May 9.
![]()
CRITICAL READS
U.S. payrolls rose by 228,000 in March, but unemployment rate increases to 4.2%
Job growth was stronger than expected in March, providing at least temporary reassurance that the labor market is stable, the Labor Department reported Friday.
Non-farm payrolls increased 228,000 for the month, up from the revised 117,000 in February and better than the Dow Jones estimate for 140,000, according to the Bureau of Labor Statistics.
However, the unemployment rate moved up to 4.2%, higher than the 4.1% forecast as the labor force participation rate also increased.
Though the headline number beat estimates, the report comes against a highly uncertain backdrop after President Donald Trump’s tariff announcement this week that has intensified fears of a global trade war that could damage economic growth.
This CNBC story showed up on their Internet site at 8:31 a.m. on Friday morning EDT -- and is the first offering of the day from Swedish reader Patrik Ekdahl. Another link to it is here.
![]()
Powell sees tariffs raising inflation and says Fed will wait before further rate moves
Federal Reserve Chair Jerome Powell said Friday that he expects President Donald Trump’s tariffs to raise inflation and lower growth, and indicated that the central bank won’t move on interest rates until it gets a clearer picture on the ultimate impacts.
In a speech delivered before business journalists in Arlington, Virginia, Powell said the Fed faces a “highly uncertain outlook” because of the new reciprocal levies the president announced Wednesday.
Though he said the economy currently looks strong, he stressed the threat that tariffs pose and indicated that the Fed will be focused on keeping inflation in check.
“Our obligation is to keep longer-term inflation expectations well anchored and to make certain that a one-time increase in the price level does not become an ongoing inflation problem,” Powell said in prepared remarks. “We are well positioned to wait for greater clarity before considering any adjustments to our policy stance. It is too soon to say what will be the appropriate path for monetary policy.”
Another CNBC story courtesy of Patrik Edkahl. This one appeared on their website at 11:25 a.m. on Friday morning EDT -- and was updated two hours later. Another link to it is here. A related CNBC story, also from Patrik, is headlined "Traders betting Fed will cut rates at least 4 times this year to bail out economy" -- and linked here.
![]()
Worse than the Worst-Case -- Doug Noland
“Worse than the worst-case scenario.” “Liberation day,” a day that will live in infamy. Financial Times Editorial Board: “America’s Astonishing Act of Self-Harm.” The catalyst for bursting history’s greatest Bubble was delivered Wednesday on the White House lawn – pomp and circumstance, celebratory propaganda, placards, and disinformation aplenty.
The historic, multi-decade, global Bubble was always going to end badly. The circumstances I see today are worse than what I had previously contemplated as the worst case. It’s difficult to envisage the U.S. more unprepared for what will now unfold - an atrocious backdrop for heading into crisis. Society is angry and so deeply divided – with stocks only somewhat off record highs and unemployment at 4.2%. Washington is at the brink of complete dysfunction.
The existing world order is collapsing. Extraordinary fragmentation and hostility risk great peril. The unfolding global trade war backdrop is uncharted waters. Scenario analysis should now include the possibility of things spiraling out of control over time - prolonged financial crisis, severe economic recession/depression, and even war of the non-trade variety. Financial markets will now factor in myriad extraordinary risks. At the minimum, the unfolding crisis will lack the concerted global response that has been instrumental in calming previous panics.
“Liberation Day” has unleashed crisis dynamics, with unemployment at 4.2%. Until recently, financial conditions were exceptionally loose, cheap Credit easily available, speculative Bubbles manic, and economic fundamentals seemingly robust. “American exceptionalism” was accepted as an indisputable fact. The “Fed put” is today unusually ambiguous. Unless the Fed is focused specifically on the potential for highly destabilizing speculative deleveraging, there is little that would point to imminent aggressive rate cuts, let alone a massive QE response.
I could be proven wrong on this. What most believe are robust financial and economic structures, I view as fragile. And how this debate plays out will be of monumental importance. My analytical framework is unequivocal: Nothing short of historic Credit and speculative Bubbles, along with a “Bubble economy.” I have argued that the “Roaring Twenties” period offers the closest parallels. Today’s market structure, with hundreds of trillions of derivatives, dynamic hedging strategies that risk self-amplifying “flash crash” selling, $11 TN of ETFs, record household stock exposure, unprecedented indebtedness, and Bubbles in stocks, Credit and crypto – create unprecedented fragility.
This worthwhile and interesting commentary from Doug appeared on his website around midnight on Friday night PDT -- and another link to it is here. Gregory Mannarino's post market close rant for Friday runs for 39 minutes -- and is linked here.
![]()
The Apoplexy Over the Trump Tariffs is the “Trillions at Stake” Part of Our Decade’s Long Discussion
During one of the 2016 Republican debates, the Wall Street Journal’s Kimberly Stassel challenged Donald Trump on the projected revenue from his proposed tax plan. In essence Stassel claimed some economists doubted the growth factor Mr. Trump projects in his tax proposal.
What was highlighted within the question was one of the larger hurdles Trump faced as he needs to re-educate an entire generation on a fundamentally new vision of the U.S. economy. A return to a goods-based manufacturing and industry driven economic model.
President Trump’s MAGAnomic trade and foreign policy agenda is jaw-dropping in scale, scope and consequence. There are multiple simultaneous aspects to each policy objective; they have been outlined for a long time.
Interestingly, many people have forgotten a 1991 (35 years old) video of Donald Trump testifying before congress – as evidence of him being tuned in to the economic consequences of political activity.
The entire video is well worth watching, because it gives us insight into a very specific moment in time as they discuss the ‘Reagan era’ 1986 tax reform act.
However, for the sake of this discussion post, I would like to draw your attention to a very specific exchange between Donald Trump and Representative Helen Delich Bently (R-MD).
This fairly long, but very interesting and worthwhile essay was posted on theconservativetreehouse.com Internet site on Friday -- and I thank Mike Coombs for finding it for us. Another link to it is here.
![]()
Two very interesting and worthwhile videos
1. Netanyahu’s Domestic Woes -- Max Blumenthal
This very interesting 23-minute video interview with Max was hosted by Judge Andrew Napolitano -- and was posted on the youtube.com Internet site on Wednesday -- and I thank Guido Tricot for sharing it with us. The link to it is here.
2. INTEL Roundtable with Larry Johnson & Ray McGovern : Weekly Wrap
This longish but very worthwhile 40-minute video with former CIA analysts Johnson and McGovern put in an appearance on the youtube.com Internet site around 4 p.m. EDT on Friday afternoon. It's also hosted by the Judge -- and also sent to us by Guido. The link to it is here.
![]()
Germany considers withdrawing 1,200-tonne gold stockpile from U.S. in riposte to Trump
Germany is considering removing an enormous stockpile of gold from a vault in New York over worries about Donald Trumps unpredictable policies.
For decades, Berlin has stashed 1,200 tonnes of its famous gold reserves, the second largest on the planet after those of the United States, in a vault deep underground at the U.S. Federal Reserve in Manhattan.
Now senior figures from the conservative Christian Democratic Union (CDU) party, which is set to lead the next German government, have discussed removing it from New York because of concerns that Washington is no longer a reliable partner, the Bild newspaper has reported.
"Of course, the question has arisen again," Marco Wanderwitz, a former German government minister who gave up his CDU seat in the Bundestag this year, told Bild.
Mr. Wanderwitz has long advocated for a policy that would allow German officials to regularly inspect the gold -- or withdraw it completely.
He has previously lobbied to visit the gold reserves and personally inspect them, but his request was rejected in 2012.
The rest of this very worthwhile gold-related news item is hidden behind The Telegraph's paywall. It was posted there on Friday -- and I found it embedded in a GATA dispatch. Another link to it is here.
![]()
Sound money or collapse: Lawrence Lepard warns 'nothing stops this train'
The United States is hurtling toward a monetary breaking point, and according to sound money advocate and investor Lawrence Lepard, the clock is running out.
Lepard laid out the core thesis of his book The Big Print: What Happened to America and How Sound Money Will Fix It, offering a scathing critique of fiat currency, Federal Reserve policy, and the political establishment.
"We have built our financial system on a bedrock of sand, not sound money. It is collapsing," Lepard told Kitco News. According to him, the inflation, debt, inequality, and social division that define America today are all symptoms of a deeper monetary disorder that began decades ago.
"The greatest issue of our time is the broken monetary system, which leads to enormous wealth inequality," Lepard said. "It's inherently unfair when someone can click a mouse key and create money."
According to data from the Federal Reserve Bank of St. Louis, the U.S. M2 money supply grew from $663 billion in 1971 to over $21 trillion by late 2024. This represents a compound annual growth rate of nearly 6.8%, a monetary expansion that Lepard says is the true driver of inflation – not corporate greed or external shocks.
This 52-minute video interview from the kitco.com Internet site was something I found a couple of days ago, but for length reasons I thought it best to save it for Saturday -- and here it is. I always have all the time in the world for whatever Larry has to say -- and it's definitely worth your while. Another link to it is here.
![]()
QUOTE of the DAY

![]()
The WRAP
"Understand this. Things are now in motion that cannot be undone." -- Gandalf the White
![]()
Today's pop 'blast from the past' was released 46 years plus one month ago. I've featured it before -- but it's been a while, so time for a revisit. Neither the song, or the group that made it a smash hit back in 1979, needs any introduction. Here's their lead singer Roger Hodgson performing it 36 years later -- and he's still got the pipes. The link is here. Of course there's a bass cover to it -- and that's linked here.
Today's classical 'blast from the past' is somewhat more ancient -- and was composed by Johann Sebastian Bach c. 1717-1723. It's his Violin Concerto in E major, BWV 1042 -- and I believe this is the first time I've featured it. It's typical of the Baroque era -- and here's the incomparable Hillary Hahn doing the honours as soloist, accompanied by the Deutsche Kammerphilharmonie Bremen. Maestro Meir Wellber conducts -- and the link is here.
![]()
Friday was Day 2 of the bear raid/wash, rinse & spin cycle in the Big 6 commodities in the COMEX futures market by the collusive commercial traders of whatever stripe -- and once again, they didn't take any prisoners.
Although they beat the living snot out of gold, it remains the only one of the four precious metals still above its critical 50 and 200-day moving averages. In the case of the former, it's about 65 bucks -- and in the case of the latter, it's a bit over three hundred dollars.
Can 'da boyz' get gold lower? I don't know, but suspect not -- and I have more on this below the charts.
As for silver, it's now so far below any moving average that matters that it's a safe bet that there isn't a speculative long left in the Managed Money category -- and the other two categories have been puking up longs and going short by the boatload as well. The only question now is whether or not 'da boyz' can get these managed money traders et al. to go short big time like they have in the past.
On its RSI chart below, they managed to blow silver back into oversold territory on its RSI trace...as it's down 5 bucks since its high tick back on Friday, March 28. Based on that, one has to wonder just how much more blood there is this silver stone.
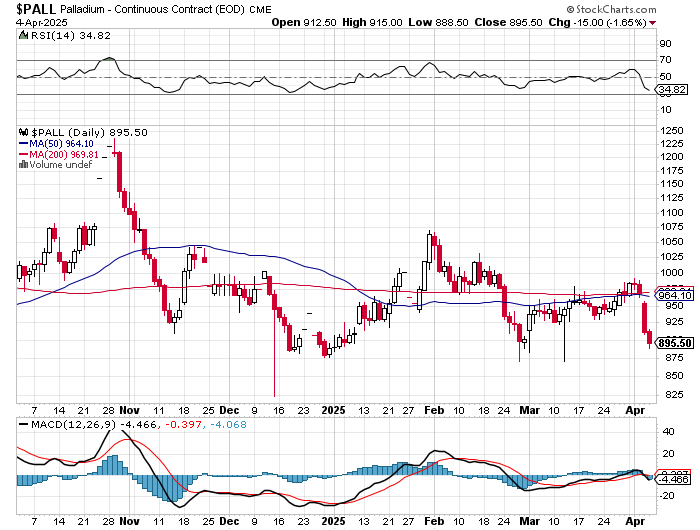
'Da boyz' have platinum down over $100 since its Monday high -- and miles below any moving average that matters...ditto for palladium. Both are rapidly approaching oversold on their respective RSI traces.
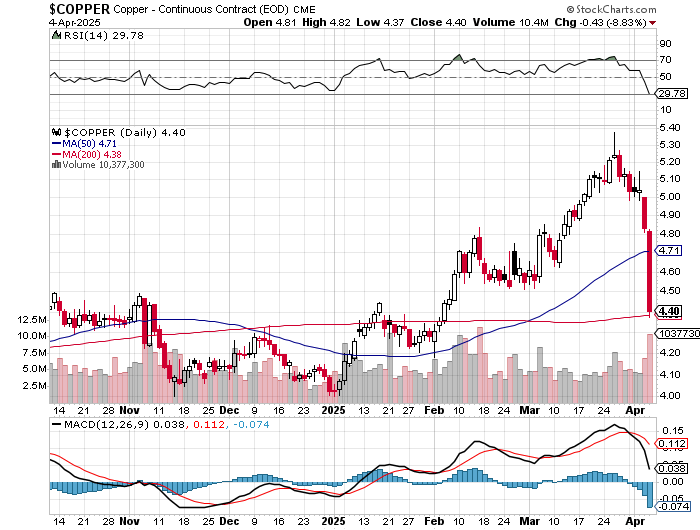
Then there's copper...wow! But as I've said on several occasions, starting about two weeks ago, that with it now being into overbought territory on its RSI trace, it was only a matter of time before the collusive commercial shorts began to harvest the Managed Money longs for fun and profit. They've been doing that with gusto all week long...with the grand finale coming on Thursday and yesterday. 'Da boyz' have copper down almost a dollar since the middle of last week -- and all of this price action is COMEX paper trading -- and has nothing to do with supply and demand. Copper is also in oversold territory by a hair.
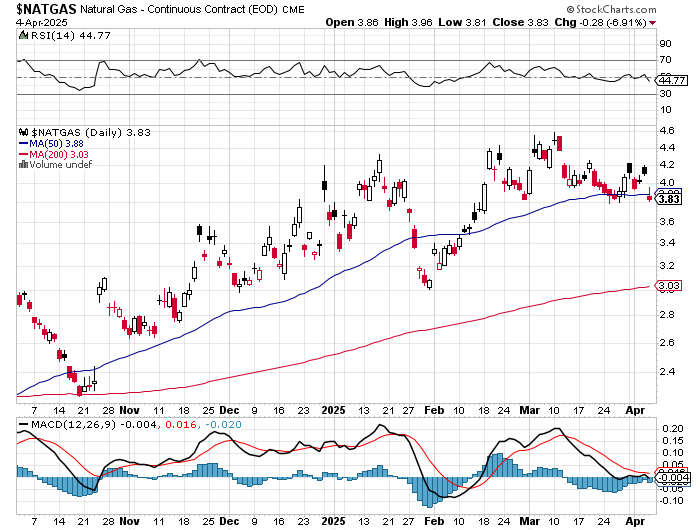
Natural gas, I suspect, got caught in the crossfire, as it was closed down 28 cents/6.91% at $3.83/1,000 cubic feet by the close of COMEX trading yesterday -- and is now back below its 50-day moving average by a bit.
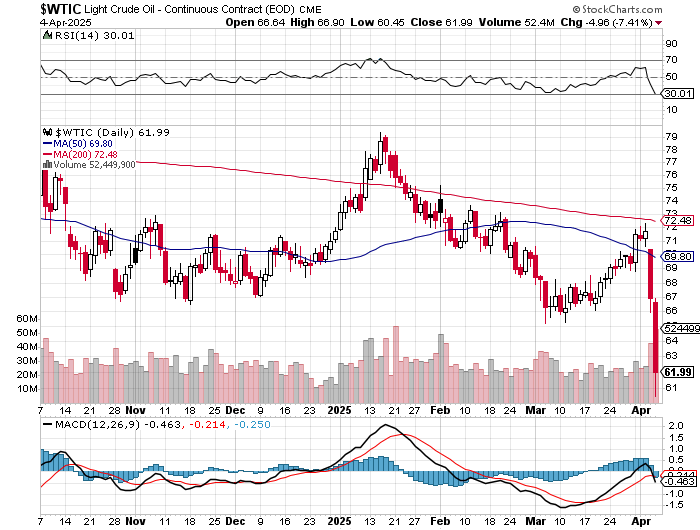
The collusive commercial traders of whatever stripe have oil down ten bucks a barrel in just two trading sessions -- and more than that intraday on Friday, as it touched $60.45 at it low tick. It closed at $61.99/barrel...down a whopping $4.96 per -- and 7.41% from Thursday's close.
So it was a bloodbath in everything. And as I stated earlier, 'da boyz' weren't taking any prisoners in anything...as their attempts to nip in the bud the rush from paper to hard assets continued for the second day in a row.
Here are the 6-month charts for the Big 6+1 commodities...courtesy of stockcharts.com as always and, if interested, their COMEX closing prices in their current front months on Friday should be noted.
And as mentioned in this space yesterday..."the 50 and 200-day moving averages are wrong for both gold and silver on these charts -- and I have to assume that they're wrong for the other five commodities as well. They're out by a lot for whatever reason." Click to enlarge.
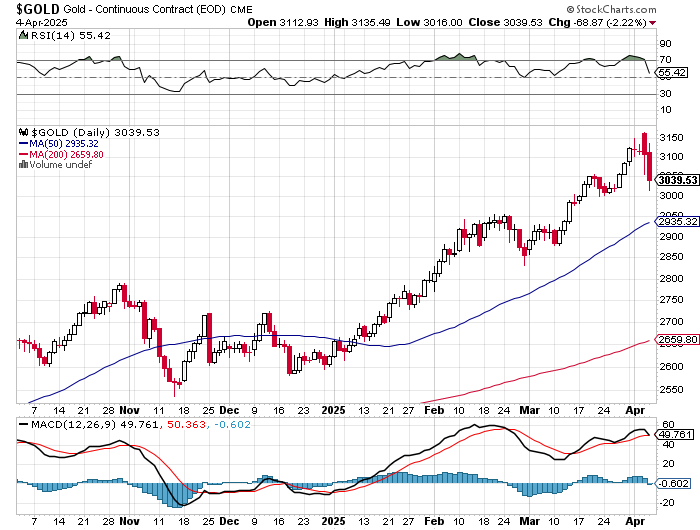
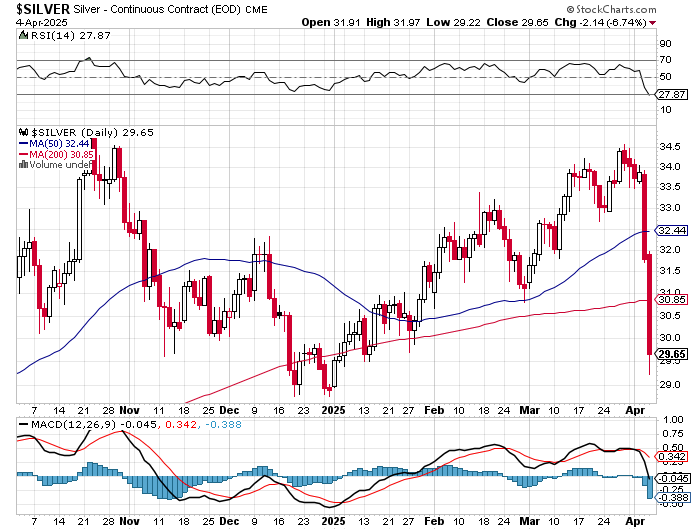
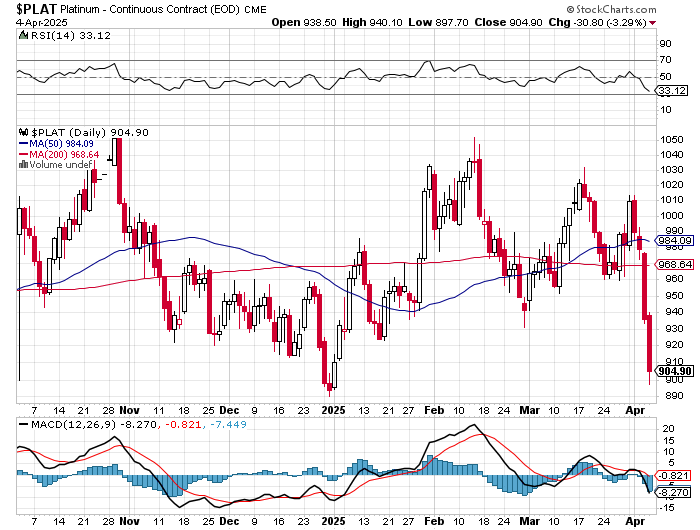
With major engineered price bottoms in five of the Big 6 commodities in...or nearly so, one has to start thinking ahead at what any recovery may look like.
As Ted Butler had been pointing out for years, this price management scheme would come to an end in either of two ways...either price would blow higher out of the blue...or 'da boyz' would arrange for another engineered price decline across the entire commodities complex -- and that it would be short, sharp and ugly.
Well, it was all of those -- and with the Managed Money traders et al. most cleaned out to the downside in five of the Big 6...the only fly in the ointment is gold...which remains far above any moving averages that matter.
However, as I've been mentioning for last month in my COT commentaries, the Big 4 shorts in gold have been quietly heading for the exists since January 21 -- and as of yesterday's COT Report, I said that the set-up for them in the COMEX futures market had turned bullish.
Of course that doesn't include the massive improvements in their short positions that have taken place since the Tuesday cut-off -- and because of that, I can confidentially state that despite the fact that neither the 50 or 200-day moving averages have been penetrated to the downside, the set-up for a big up move in gold from a Big 4/8 short perspective has turned very bullish.
But one has to suppose that it could get even more bullish if the collusive commercial traders continue the price pressure next week. They might keep this up until the last long contract is sold -- and the last short is placed. Once that happens, the silver and gold price can go no lower, because it's the very act of selling longs and going short by the Managed Money traders et al. that drives their prices lower.
So, with the set-up bullish across the board, the $64,000 question becomes whether or not the commercial traders will step in as short sellers of last resort once again as their respective ensuing rallies get underway. If yes...then it's the same old, same old. But if not...!
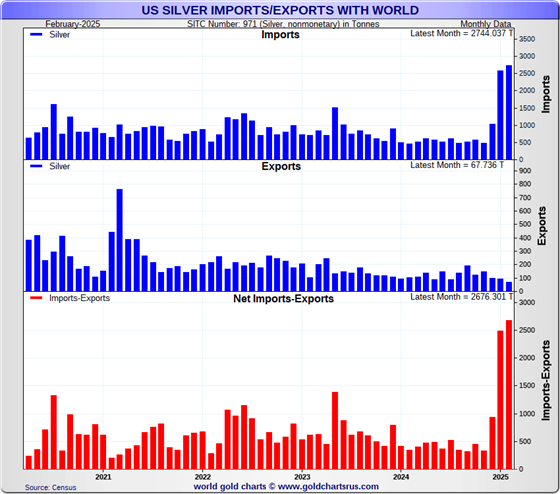
Turning to the awesome amount of silver imported into the U.S. this year, is the following chart that I received from Nick Laird the other day. It shows silver imports and exports into and out of the U.S. -- and updated with February's data.
During that month they reported importing 2,744.037 tonnes/88.224 million troy ounces. Of that amount 1,819.8 tonnes/58.509 million troy ounces ended up at the COMEX -- and one has to ask where that other 30 million troy ounces went. One has to suspect that it might have ended up in the possession of silver stackers with very deep pockets. Click to enlarge.
Like you, I was not at all happy to live through yet another brutal and collusive bear raid by the commercial traders of whatever stripe. However, it wasn't a complete surprise because of the ugly set-up in the COMEX futures market... which had hanging above us for months. But, with the worst most likely behind us, the decks are cleared [with one eye still on gold because of the moving averages] for the next rallies to begin -- and they will commence when allowed, or by events outside the control of the paper hangers in New York and London.
I'm still 'all in' -- and will remain so to whatever end.
See you here on Tuesday.
Ed


