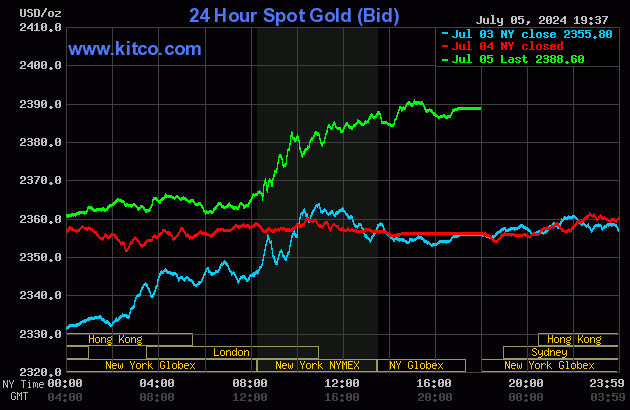
The gold price wandered/crept quietly, broadly and unevenly higher until minutes before 1 p.m. BST in Globex trading in London. Then a rally of some size erupted -- and from its quiet saw-tooth pattern thereafter, it was obvious that it was running into quiet opposition all the way up until its high tick of the day was set a couple of minutes after 3 p.m. in after-hours trading in New York. Very shortly after that it had a quiet and descending down/up move that ended about fifteen minutes before the 5:00 p.m. EDT close.
The low and high ticks in gold were reported by the CME Group as $2,356.00 and $2,401.50 in the August contract. The August/October price spread differential in gold at the close in New York yesterday was $23.40...October/
December was $23.90 -- and December/February was $23.20 an ounce.
Gold was closed on Friday afternoon in New York at $2,388.60 spot, up $32.60 from its close on Thursday. Net volume [which includes Thursday's] was on the heavier side at a bit under 234,500 contracts -- and there were just under 57,000 contracts worth of roll-over/switch volume on top of that...mostly into December, but with very noticeable amounts into October, plus February and April of next year.
I note that 72 gold, plus a whopping 451 silver contracts were traded in July yesterday, so we'll see what that translates into in this evening's Daily Delivery and Preliminary Reports.
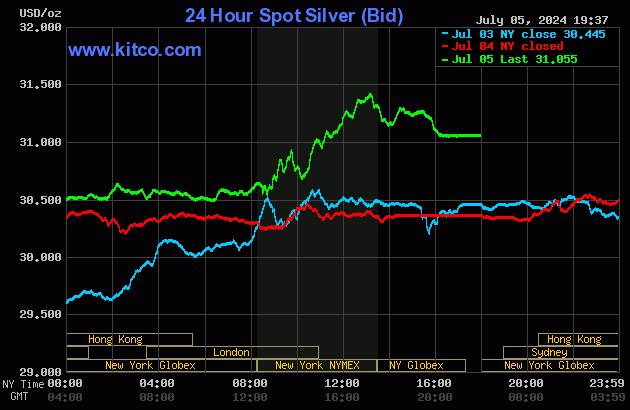
Silver's price path was mostly similar to gold's throughout most of the Globex trading session, except its rally didn't get underway until precisely 8:30 a.m. in COMEX trading in New York. That choppy rally ran into 'da boyz' a couple of minutes before 1:15 p.m. -- and they sold it unevenly lower until the market closed at 5:00 p.m. EDT.
The low and high ticks in silver were recorded as $31.79 and $30.45 in the September contract...an intraday move of $1.34 the ounce -- and that's because of an ugly but brief spike lower at exactly 8:30 a.m...something that reader Dave Draughon pointed out . The July/September price spread differential in silver at the close in New York yesterday was 30.1 cents... September/December was 45.7 cents -- and December/March was 46.2 cents an ounce.
Silver was closed in New York on Friday afternoon at $31.055 spot...up 69.5 cents from Thursday -- and a hefty 36.5 cents off its Kitco-recorded high tick. Net volume [which also includes Thursday's] was about 93,500 contracts -- and there were a tiny bit over 8,000 contracts worth of roll-over/switch volume out of September and into future months in this precious metal... almost all into December, but with a bit into March25 as well.
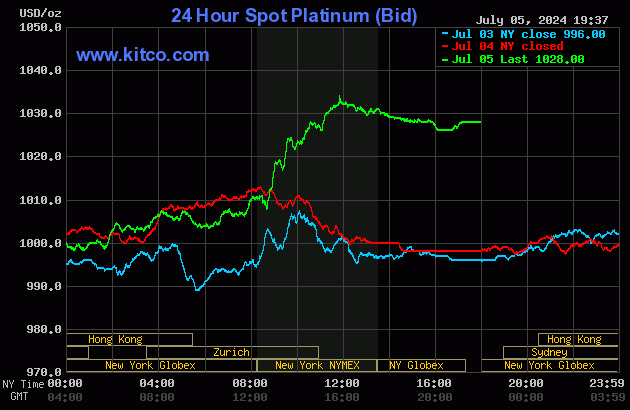
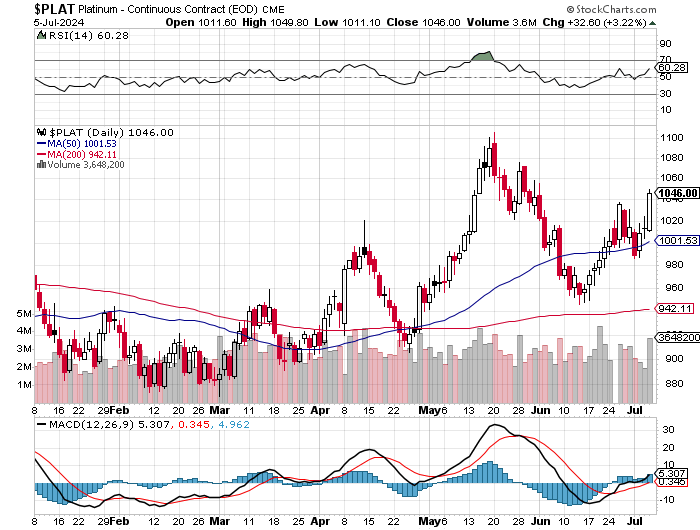
The platinum price didn't do much until around 1:40 p.m. China Standard Time in Globex trading on their Friday afternoon. At that juncture a quiet and bit uneven rally commenced that really took flight around 8:45 a.m. in COMEX trading. The not-for-profit commercial sellers capped its price at 11:50 a.m. EDT -- and from that point it crept very quietly lower until 4 p.m. in after-hours trading -- and then ticked a dollar or two higher going into the 5:00 p.m. EDT close. Platinum was closed at $1,028 spot...up 30 bucks from Thursday's close -- and 6 bucks off its Kitco-recorded high tick.
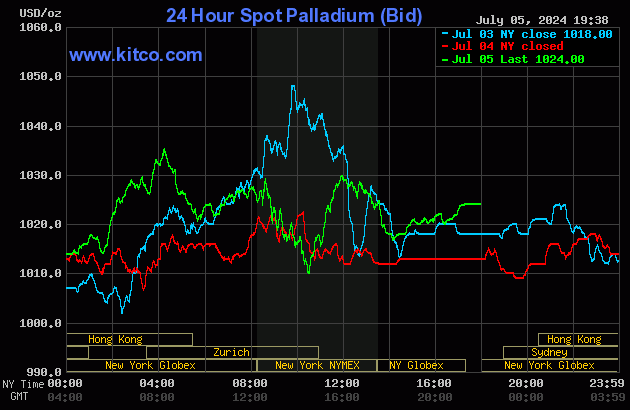
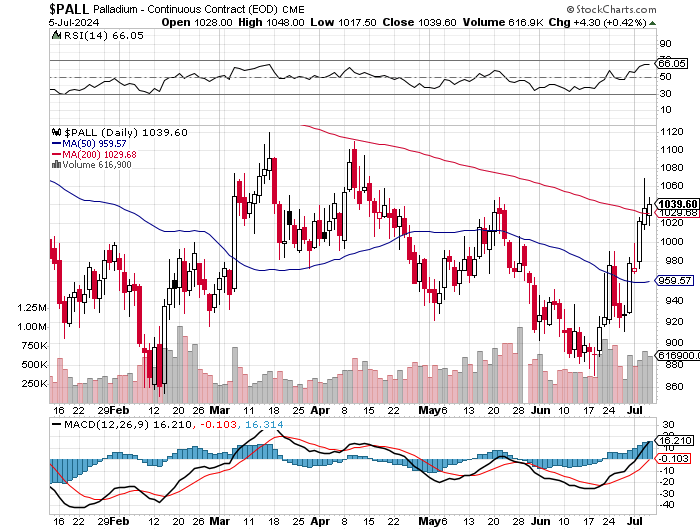
Palladium's three rally attempts in Globex and COMEX trading were all turned lower, but it still managed to close up 11 dollars on the day at $1,024 spot...but 13 bucks off its Kitco-recorded high tick.
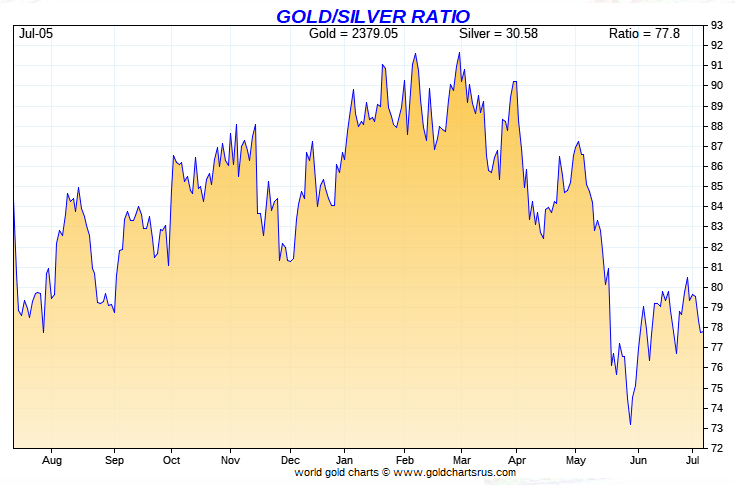
Based on the kitco.com spot closing prices in silver and gold posted above, the gold/silver ratio worked out to 76.9 to 1 on Friday...compared to 77.6 to 1 on Thursday.
Here's the 1-year Gold/Silver Ratio Chart...courtesy of Nick Laird and, for whatever reason, Friday's data point is not on it. Click to enlarge.
![]()
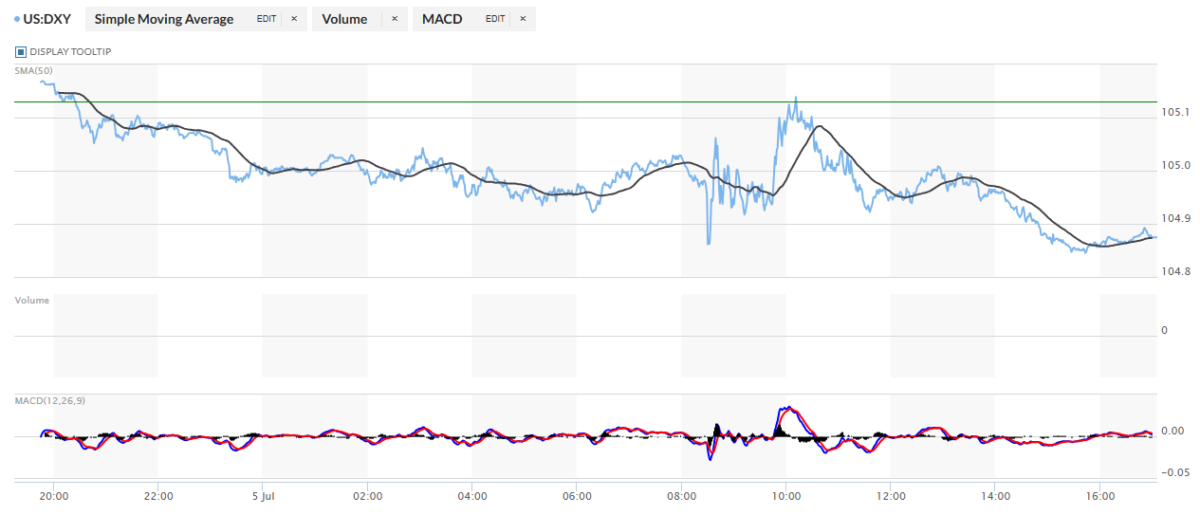
The dollar index closed very late on Thursday afternoon in New York at 105.13 -- and then opened higher by 4 basis points once trading commenced at 7:45 p.m. EDT on Thursday evening, which was 7:45 a.m. China Standard Time on their Friday morning. It then wandered/chopped broadly and unevenly lower...with the 'unevenly' part coming in early trading in New York...and that choppy decline ended at 3:45 p.m. EDT. It then crawled a few basis points higher until the market closed at 5:00 p.m.
The dollar index finished the Friday trading session in New York at 104.88...down 26 basis points from its close on Thursday.
Here's the DXY chart for Friday...thanks to marketwatch.com as usual. Click to enlarge.
And here's the 5-year U.S. dollar index chart that appears in this spot every Saturday, courtesy of stockcharts.com as always. The delta between its close...104.55.....and the close on the DXY chart above, was 33 basis points below its spot close. Click to enlarge.
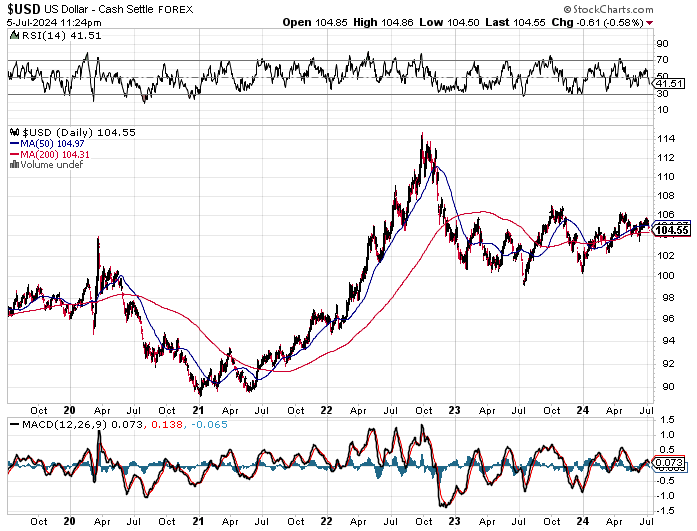
There was fairly decent correlation between precious metal prices and the dollar index during overseas trading on Friday...but that mostly went out the window in New York, especially when 'da boyz' appeared in each.
U.S. 10-year Treasury: 4.2720%...down 0.0830/(-1.9058%)...as of the 1:59 p.m. CDT close
Here's the 5-year 10-year U.S. Treasury chart from the yahoo.com Internet site -- which puts the yield curve into a somewhat longer-term perspective. Click to enlarge.
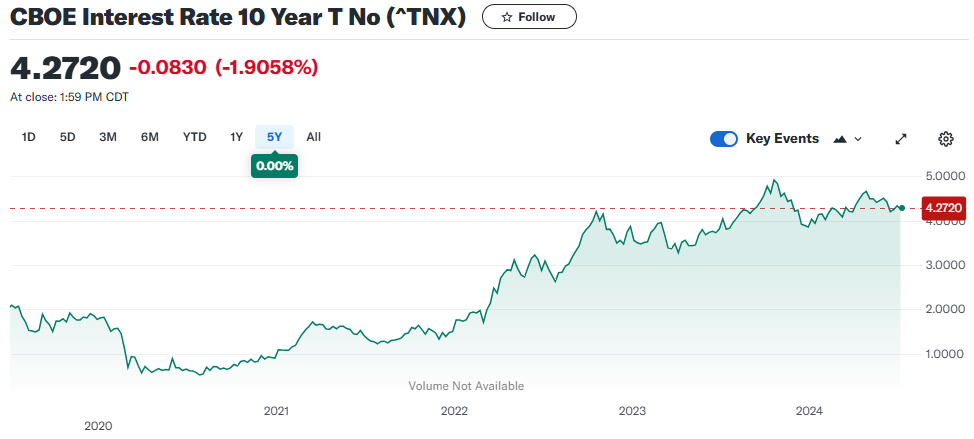
The ten-year was down about 10 basis points on the week, but down 20 from its high on July 1...so the Fed was aggressively buying treasuries with both hands as the week progressed. And as I keep pointing out, they've been actively managing the yield curve since mid October of last year.
![]()
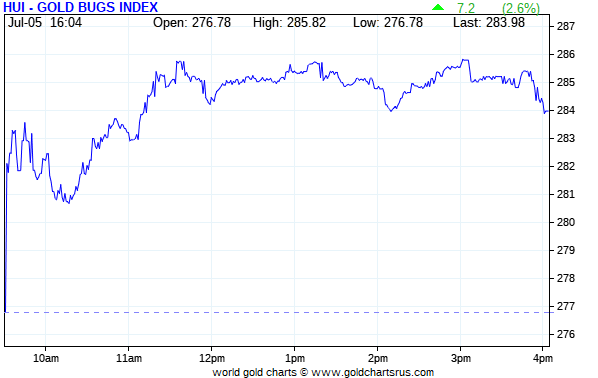
The gold stocks gapped up a bit at the 9:30 opens of the equity markets in New York on Friday morning -- and then rallied unevenly until around 11:35 a.m. EDT...traded pretty flat until 3:45 p.m. -- and then sagged a bit going into the 4:00 p.m. close. The HUI closed up 2.60 percent.
Here's Nick's 1-year Silver Sentiment Index chart, updated with Friday's candle. It closed higher by 2.57 percent. Click to enlarge.
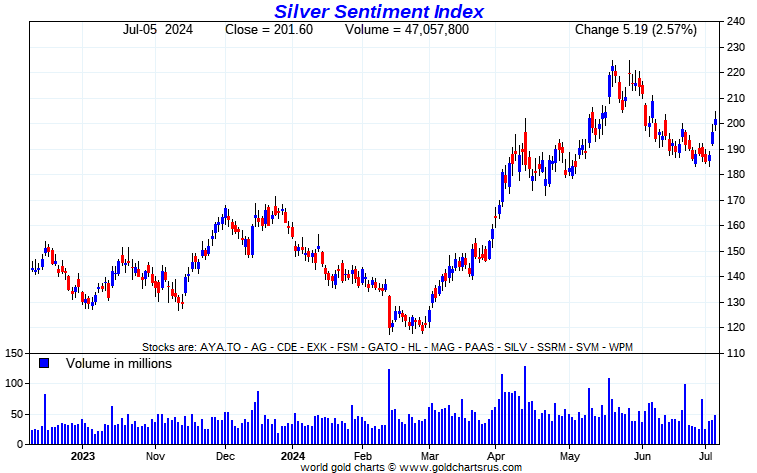
The star yesterday was Endeavour Silver, as it closed up 6.04 percent...with SilverCrest Metals and Coeur Mining hard on its heels, closing higher by 5.81 and 5.70 percent respectively. The two biggest underperformers by far were Fortuna Silver and SSR Mining, closing down on the day by 0.59 and 0.42 percent respectively.
There was this news from Silvercorp Metals yesterday.
The silver price premium in Shanghai over the U.S. price on Friday was 12.75 percent.
The reddit.com/Wallstreetsilver website, now under 'new' but not improved management, is linked here. The link to two other silver forums are here -- and here.
![]()
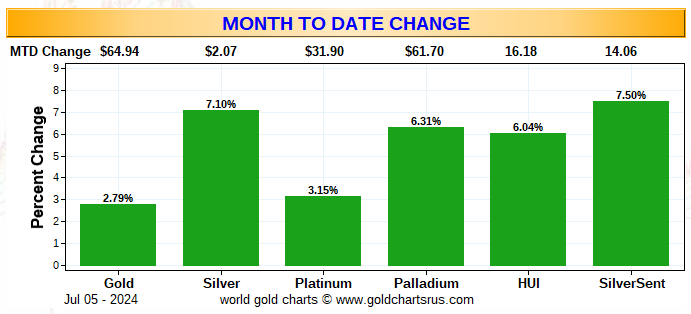
Here are two of the usual three charts that appear in every weekend missive. Because of the U.S. holiday mid-week, the weekly chart shows the last five business days...which in this case would include the previous Friday's data...28 June...rendering it meaningless.
They show the changes in gold, silver, platinum and palladium in both percent and dollar and cents terms, as of their Friday closes in New York — along with the changes in the HUI and the new Silver Sentiment Index.
Here's the month-to-date chart...which doubles as the week-to-date chart for this one week only -- and which appears to be accurate. It's a particularly nice shade of green across the board, with the gold shares outperforming the silver equities on a relative basis...but not on an absolute basis. Click to enlarge.
This one shows the year-to-date changes -- and only hapless palladium remains down year to date...thanks to 'da boyz'. The underperformance of the precious metals equities...especially the silver stocks...is painfully obvious. Click to enlarge.
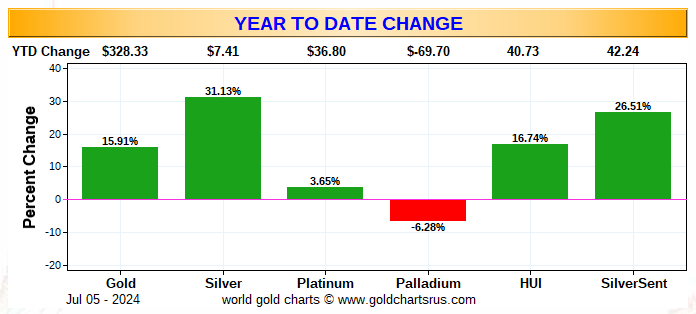
Of course -- and as I mention in this spot every Saturday -- and will continue to do so...is that if the silver price was sitting just below its all-time $50 high, like gold is currently just below its new all-time high of a month or so ago...it's a given that the silver equities would be outperforming their golden cousins by an absolute country mile.
![]()
The CME Daily Delivery Report for Day 6 of July deliveries showed that 463 gold -- and 123 silver contracts were posted for delivery within the COMEX-approved depositories on Tuesday.
In gold, the two short/issuers were Citigroup and JPMorgan, issuing 398 and 65 contracts respectively...the former from their house account. There were seven long/stoppers in total -- and the only three that really mattered were BofA Securities, Wells Fargo Securities and Australia's Macquarie Futures... picking up 172, 116 and 115 contracts...Macquarie Futures for their client account.
In silver, the two largest of the six short/issuers in total were Morgan Stanley and JPMorgan, issuing 62 and 46 contracts out of their respective client accounts. The biggest long/stopper was JPMorgan, picking up 75 contracts for clients -- and the next three down the list were Wells Fargo Securities, Advantage and the CME Group...stopping 28, 12 and 8 contracts...Advantage for their client account.
The CME Group immediately reissued theirs as 5x8=40 of those one-thousand ounce good delivery bar micro silver futures contracts -- and the two long/ stoppers for those were Advantage and Morgan Stanley, picking up 27 and 13 contracts for their respective client accounts.
The link to yesterday's Issuers and Stoppers Report is here.
Month-to-date there have been 2,689 gold contracts issued/reissued and stopped -- and that number in silver is 5,408 COMEX contracts. In platinum it's 501 -- and in palladium...26.
The CME Preliminary Report for the Friday trading session showed that gold open interest in July increased by 65 contracts, leaving 495 still around, minus the 463 contracts mentioned a bunch of paragraphs ago. Wednesday's Daily Delivery Report showed that only 1 gold contract was actually posted for delivery on Monday, so that means that 65+1=66 more gold contracts were just added to July deliveries.
Silver o.i. in July fell by 177 contracts, leaving 536 still open, minus the 123 contracts mentioned a bunch of paragraphs ago. Wednesday's Daily Delivery Report showed that 299 silver contracts were posted for delivery on Monday, so that means that 299-177=122 silver contracts were added to the July delivery month -- and is within 1 contract of the number of contracts out for delivery on Tuesday as per the above Daily Delivery Report. So it's safe to assume that those numbers are directly related.
Total gold open interest on Friday rose by a net and gargantuan 38,616 COMEX contracts. Gold open interest in August [its current front month] increased by a whopping 13,799 contracts -- and December o.i. rose by 20,296 contracts. Some of this will certainly be comprised of Ted's uneconomic and market-neutral spread trades being added -- and the numbers also include Thursday's trading activity...but still! Total silver o.i. increased by a net 6,044 contracts -- and includes Thursday's trading activity as well. Both these numbers are subject to some revisions by the time the CME gets around to posting the final figures on their Internet site later on Monday morning CDT.
![]()
There were no reported changes in GLD yesterday, but 9,912 troy ounces of gold were added to GLDM. And after a big deposit into SLV on Wednesday, an authorized participant removed or converted shares to physical...1,461,162 troy ounces of silver.
In other gold and silver ETFs and mutual funds on Planet Earth on Friday, net of any changes in COMEX, GLD, GLDM and SLV inventories, there were a net 12,728 troy ounces of gold added -- and a net 537,330 troy ounces of silver were added as well, almost all because of the 500,000 troy ounces deposited into Sprott's/PSLV.
The U.S. Mint had a small sales report yesterday. They sold 5,500 troy ounces of gold eagles...plus 8,000 one-ounce 24K gold buffaloes -- and those numbers are their month-to-date sales as well.
![]()
There was very decent activity in gold over at the COMEX-approved depositories on the U.S. east coast on Wednesday...all of it at Brink's, Inc. They reported receiving 133,426.650 troy ounces/4,150 kilobars -- and shipped out 19,725 troy ounces. There was no paper activity -- and the link to this is here.
The only activity in silver was the one truckload/598,270 troy ounces that arrived at CNT -- and the link to that is here.
There was very hefty activity over at the COMEX-approved gold kilobar depositories in Hong Kong on their Wednesday...all of it at Brink's Inc. as usual. They received 710 of them -- and shipped out 6,425 kilobars. The link to this, in troy ounces, is here.
The Shanghai Futures Exchange reported adding 328,486 troy ounces of silver to their inventories on Friday, which now stand at 33.954 million troy ounces.
The Shanghai Gold Exchange won't get around to reporting their silver inventory data for this past week until Monday.
![]()
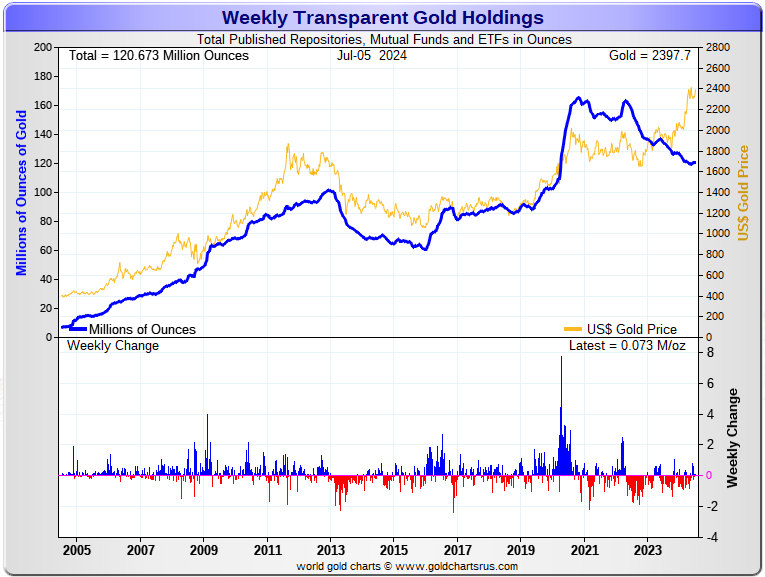
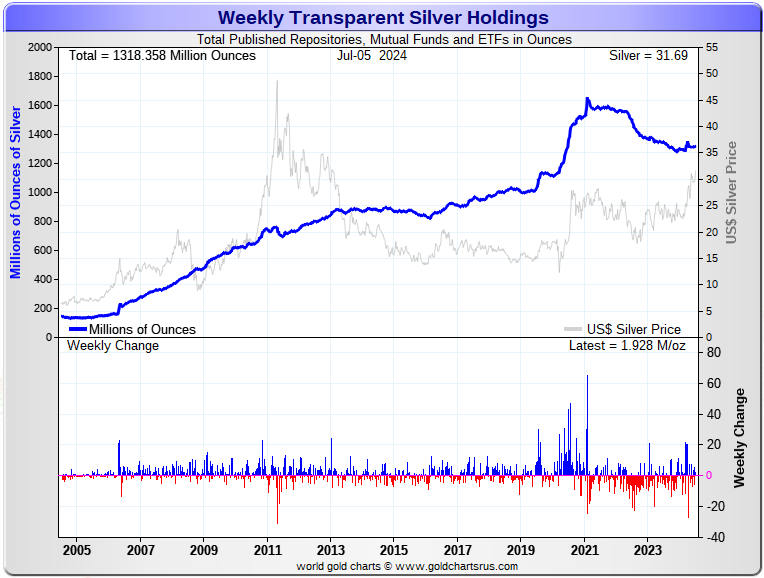
Here are the usual 20-year charts that show up in this space in every weekend column. They show the total amounts of physical gold and silver held in all know depositories, ETFs and mutual funds as of the close of business on Friday.
During the week just past, there were a net 73,000 troy ounces of gold added -- plus a net 1.928 million troy ounces of silver were added as well. Click to enlarge.
According to Nick Laird's data on his website, there were a net 149,000 troy ounces of gold removed -- but a net 3.867 million troy ounces of silver were added to all the world's known depositories, mutual funds and ETFs during the last four weeks.
Retail bullion sales are still very slow. Premiums vary. They're very high at Kitco...but somewhat to much lower in most other places. That will most certainly change as gold and silver continue their ascent -- and physical shortages return. But we're a very long way from that at this point.
Then there's the huge quantities of silver that will be required by all the silver ETFs and mutual funds once institutional buying finally kicks in....which it has yet to do. Adding to that demand will be the silver required to cover some or all of the short position in SLV. Since the end of May, a net 24.9 million troy ounce of silver have been added to SLV -- and a net 2.539 million has been added to the COMEX in the last four weeks.
And as Ted stated very recently, it would appear that JPMorgan has parted with well over 500 million troy ounces of the at least one billion troy ounces that they'd accumulated since 2011.
If they continue in this vein, they are going to have to cough up even more ounces to feed this year's deficit...another 215 million of them according to that latest report from The Silver Institute...which would include the approximately 120 million ounces that India has purchased so far this year that we know of.
The physical demand in silver at the wholesale level continues unabated -- and that was on full display yet again this week...as frantic deposits and withdrawals continued at the COMEX, SLV, WisdomTree and other ETFs and mutual funds. The amount of silver being physically moved, withdrawn, or changing ownership seems to be hitting new heights with each passing week -- and that trend continues unabated. This, as Ted had been pointing out for years, is a sure sign that 1,000 oz. good delivery bars are becoming ever harder to find.
New silver has to be brought in from other sources [JPMorgan] to meet the ongoing demand for physical metal. This will continue until available supplies are depleted...which will be the moment that JPMorgan & Friends stop providing silver to feed this deepening structural deficit, now in its fourth year.
The vast majority of precious metals being held in these depositories are by those who won't be selling until the silver price is many multiples of what it is today.
Sprott's PSLV is the third largest depository of silver on Planet Earth with 171.5 million troy ounces -- and some distance behind the COMEX, where there are 298 million troy ounces being held...minus the silver mentioned in the next paragraph.
It's now been proven beyond a shadow of a doubt that 103 million troy ounces of that amount in the COMEX is actually held in trust for SLV by JPMorgan according to a letter Ted received from the CFTC earlier this year. That brings JPMorgan's actual silver warehouse stocks down to around the 25 million troy ounce mark...quite a bit different than the 128.40 million they indicate they have, which is up a hair from what they showed last Friday.
But PSLV is still some distance behind SLV, as they are the largest silver depository, with 438.6 million troy ounces as of Friday's close.
The latest short report from June 26, showed that the short position in SLV fell by 16.23 percent...from 25.05 million shares sold short in the prior short report...down to 20.98 million shares sold short. BlackRock issued a warning several years ago to all those short SLV, that there might come a time when there wouldn't be enough metal for them to cover. That would only be true if JPMorgan decides not to supply it to whatever entity requires it...which is most certainly a U.S. bullion bank, or perhaps more than one.
The next short report will be posted on The Wall Street Journal's website early next Wednesday evening, July 10 -- and I'm expecting another decline...but this report is always a tough call.
Then there's that other little matter of the 1-billion ounce short position in silver held by Bank of America in the OTC market...with JPMorgan & Friends on the long side. Ted says it hasn't gone away -- and he's also come to the conclusion that they're short around 25 million ounces of gold with these same parties as well. The latest report for the end of Q1/2024 from the OCC came out about ten days or so ago -- and after carefully scrutiny, I noted that nothing much had changed since Q4/2023.
And as I've been mentioning all week, because of the U.S. Independence Day holiday on Thursday, the COT and companion Bank Participation Reports won't show up on the CME's website until Monday.
I only have a small handful of stories, articles and videos for you today.
![]()
CRITICAL READS
U.S. economy added 206,000 jobs in June, unemployment rate rises to 4.1%
The U.S. economy again added slightly more jobs than expected in June though the unemployment rate increased, the Labor Department reported Friday.
Non-farm payrolls increased by 206,000 for the month, better than the 200,000 Dow Jones forecast though less than the downwardly revised gain of 218,000 in May, which was cut sharply from the initial estimate of 272,000.
The unemployment rate unexpectedly climbed to 4.1%, tied for the highest level since October 2021 and providing a conflicting sign for Federal Reserve officials weighing their next move on monetary policy. The forecast had been for the jobless rate to hold steady at 4%.
“It’s a soft landing kind of report,” Jan Hatzius, chief economist at Goldman Sachs, said on CNBC’s “Squawk on the Street.” “This does support the idea that [the Fed] will cut relatively soon, and we continue to think September is the most likely.”
The increase in the unemployment rate came as the labor force participation rate, which indicates the level of working-age people who are employed or actively searching for a job, rose to 62.6%, up 0.1 percentage point. The so-called prime age rate, which focuses on those between ages 25 and 54, rose to 83.7%, its highest in more than 22 years.
Of course you just have to know that these numbers are massaged to perfection, dear reader. This story appeared on the CNBC website at 8:31 a.m. EDT on Friday morning -- and was updated about an hour later. I thank Swedish reader Patrik Ekdahl for sending it along. Another link to it is here. The Zero Hedge spin on this is headlined "Payrolls Rise 206K After Huge Downward Revisions as Unemployment Rate Jumps to Three Year High" -- and linked here.
![]()
Nothing Matters -- Doug Noland
Two-year Treasury yields dropped 14 bps this week, to the low (4.60%) since March 27th. Ten-year yields fell 12 bps to 4.28% (within a few bps of the low since March), while benchmark MBS yields sank 16 bps to 5.73% (also near lows back to March). The market ended the week pricing a 4.82% policy rate for the Fed’s December 18th meeting, implying 51 bps of rate reduction (two cuts). The rate was down six bps this week, to the lowest close since May 15th.
Bonds have turned notably receptive to indications of economic softening. With the Fed signaling the importance of labor market performance, markets this week reacted to weaker-than-expected June Non-Farm payroll (and household survey) and ADP data. While total non-farm payrolls increased a stronger-than-expected 206,000 (est. 190k), private payrolls rose a meaningfully weaker-than-expected 136,000 (est. 160k). Manufacturing jobs declined 8,000 versus a forecast of a gain of 5,000. Previous months payroll additions were revised lower. ADP job gains were reported at 150,000 versus the 165,000 median forecast.
The grossly imbalanced U.S. economy may be weaker - but not weak. It is certainly vulnerable. Yet I remain unconvinced that we are observing the start of a major downturn. Financial conditions remain exceptionally loose. Meanwhile, the bond market has developed a propensity for lower yields. Stronger data tend to be ignored, while yields quickly fall after weaker economic reports.
Especially with the interplay of highly speculative market dynamics, loose conditions, and robust system Credit expansion, I don’t want to dismiss the importance of lower market yields. Probabilities remain reasonably high that the market response (lower yields and looser conditions) to weaker data will underpin economic activity.
It’s reasonable for the Wall Street consensus to interpret recent bond market behavior as confirmation of a downturn about to trigger a Fed easing cycle. But I tend to view global bond yields as reacting to mounting risks, latent fragilities, and heightened vulnerability at the “periphery.” It’s more about fragile market structure than economic activity.
This rather brief [for Doug] weekly commentary appeared on his Internet site sometime before midnight on Friday PDT -- and another link to it is here. Gregory Mannarino's post market close rant for Friday is linked here. It runs for 23 minutes.
![]()
Tanzania buys gold in new move to bolster foreign reserves
The Bank of Tanzania (BoT) has started a large gold-buying initiative as part of a strategic drive to support the expansion of the mining industry and strengthen foreign exchange reserves.
The information was made public by Emmanuel Tutuba, the Governor of the Bank of Tanzania (BoT), during his visit to the Geita Gold Refinery and the Mwanza Precious Metals Refinery Co Ltd.
Under the initiative, BoT has already acquired and refined 418 kilograms of gold. “As highlighted in the budget by the Minister for Finance Dr. Mwigulu Nchemba, the government has allocated funds for the purchase of gold. This year, our target is to procure six tonnes of gold, both from small-scale, middle-scale, and large-scale miners,” he said.
He also said BoT purchases gold to diversify the country’s foreign exchange reserve and reduce reliance on a single currency.
Tanzania’s wealth against currency devaluation or economic stability caused by global shocks. “Now for the first time, we have both a gold and dollar reserve. Previously, we only had the U.S. dollar as a foreign exchange reserve,” he added.
During recent months, Tanzania just like other economies, has been adversely affected by a decision by America’s Federal Reserve to embark on aggressive rate hikes as a measure to fight domestic inflation in the U.S. economy.
This gold-related news item showed up on the msn.com Internet site on Friday -- and I found it embedded in a GATA dispatch. Another link to it is here.
![]()
QUOTE of the DAY

![]()
The WRAP
"Understand this. Things are now in motion that cannot be undone." -- Gandalf the White
![]()
Today's pop 'blast from the past' is a song written by John and Michelle Phillips in 1963 and first recorded by Barry McGuire. The best-known version is by the Mamas & the Papas, who sang backup on the original version and released it as a single in December 1965. The lyrics express the narrator's longing for the warmth of Los Angeles during a cold winter in New York City. It was recorded in the key of C-sharp minor...a strange key, to say the least. It became a signpost of the California sound, heralding the arrival of the nascent counterculture era.
Those were the days! -- and the link to it is here. There's a bass cover to this -- and there's far more to it than I imagined, as 'high fidelity' wasn't as good back in those days as it is now. The link is here.
Last week's classical 'blast from the past' was Max Bruch's violin concerto -- and at the time I mentioned that the only other two surviving works by this composer were his Scottish Fantasy, Op. 46 -- and Kol Nidrei, Op. 47. This week's 'blast' is the latter of those two compositions. Bruch completed the work in Liverpool, England, in 1880 -- and published it in Berlin in 1881.
This performance features world renowned cellist Mischa Maisky and the Frankfurt Radio Symphony Orchestra. Maestro Paavo Järvi conducts -- and the link is here.
![]()
I mentioned in this space in yesterday's missive that I wasn't "expecting much in the way of price action in the precious metals" on Friday -- and I was spectacularly wrong about that, as reader Fred Ehrman pointed out in an e-mail yesterday morning.
But it was yet another day where the collusive commercial traders of whatever stripe made their presence felt -- and, with the exception of palladium, it was most obvious during and after the COMEX trading session in New York.
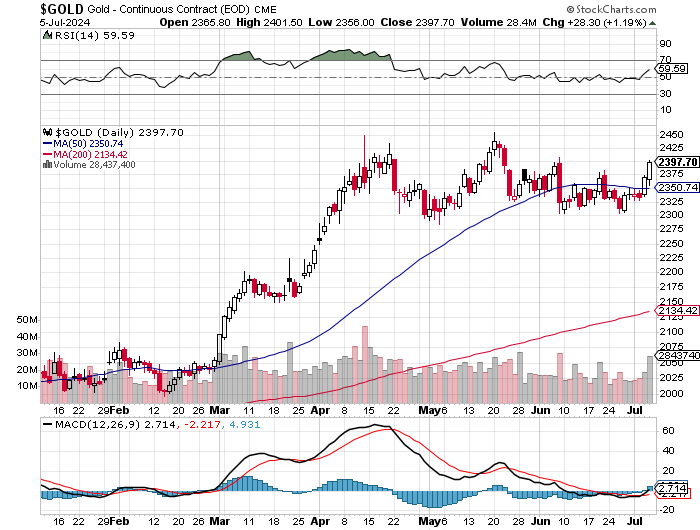
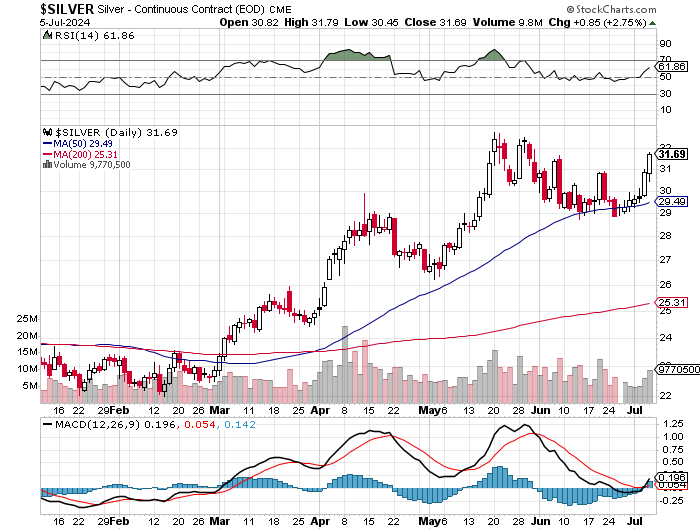
Gold made it above $2,400 in the August contract intraday, but was carefully closed below it in after-hours trading -- and of course silver was closed well off its high tick.
Although volumes appeared heavy yesterday, once Thursday's net volumes are subtracted out, the actual net volumes in both silver and gold were only a bit on the heavier side. But the real eye-opener in gold was the 38,000+ contract blow-out in total open interest, which was gargantuan -- and something I spoke of at length about in the Preliminary Report data.
Platinum had a big day, but like silver and gold, it would have closed materially higher, if allowed...which it obviously wasn't. Palladium was allowed to close above its 200-day moving average for the second day in a row...but 'da boyz' kept it on an awfully short leash on Friday, for whatever reason.
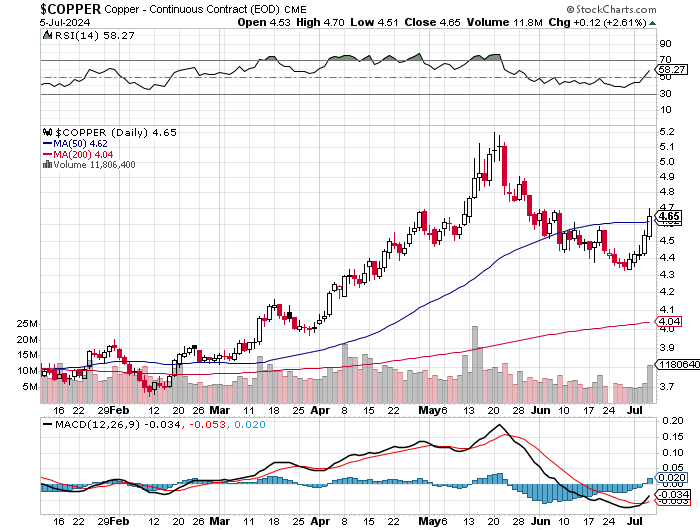
Copper closed higher by a hefty 12 cents at $4.65/pound...its second big 'up' day in a row -- and its fifth positive close in as many trading sessions. It's now back above its 50-day moving average for the first time in a month.
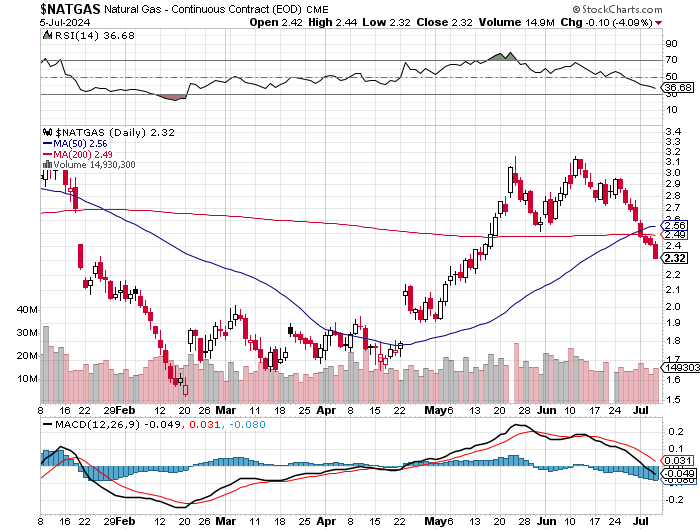
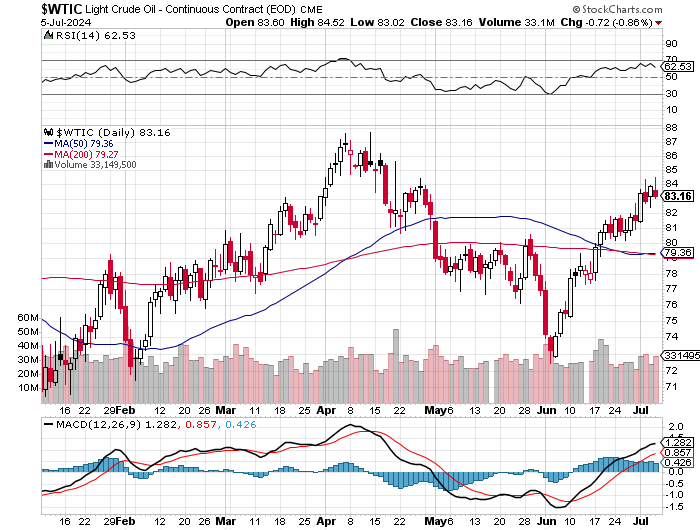
Natural gas [chart included] continues its descent into the nether regions, as it was closed down on the day by a further 10 cents/4.09%...finishing the Friday session at $2.32/1,000 cubic feet -- and now some distance below any moving average that matters.
WTIC continues its one-day-up -- and down-the-next pattern. It finished the Friday trading session at $83.16/barrel...down 72 cents from Wednesday.
Here are the 6-month charts for the Big 6+1 commodities...courtesy of stockcharts.com as always and, if interested, their COMEX closing prices in their current front months on Friday should be noted. I'll point out here that the Friday candles contain all of Thursday's price changes as well. Click to enlarge.
So, we've had two big 'up' days in a row in both silver and gold since the Tuesday cut-off for Monday's COT and Bank Participation Reports -- and as much as I'd like to think that the next leg up has started, I'll pass on saying so out loud...considering the current mega bearish set-ups in both in the COMEX futures market.
But, having said that -- and as I've pointed out regularly over the last month or so, I just can't shake the picture that Ted painted in his public commentary of last September, headlined..."The Bonfire of the Silver Shorts"...linked again here.
As he has pointed out countless times over the years, as have I...we either get another ugly but brief engineered price decline, or the price blows sky high straight away. The jury is still out on this, but the latter scenario appears to be creeping ever closer.
And in the money category, the unrealized margin call losses of the gold and silver shorts in the COMEX futures market is now back within spitting distance of $20 billion -- and the reason it's not considerably more than that, is that gold hasn't rallied nearly as much as silver since its end-of-April engineered price decline.
![]()
As was mentioned by ex-British diplomat Alastair Crooke in his interview with Judge Napolitano on Tuesday..."If you're going to be sanctioned, will you have the strength, with more than half the population and a greater proportion of GDP than the G7 has...why don't you sanction the west? Why does it always be the west sanctioning you? You should have the ability to sanction the west, particularly in raw materials -- and key strategic materials and energy. The west cannot survive, cannot produce it...cannot mount a military response to China. If those elements are switched off, I mean it would change the strategic balance in the entire globe.
And so I'm not saying that its on the agenda [BRICS+ meeting in Kazan, Russia in October -- Ed]...I'm just saying by the very logic of things, it's obvious [that] dedollarization...is very much on the agenda, but it seems to me..by some logic, then you look at the question of managing, because part of this process is to get control of commodities.
For too long commodity prices have been set in the United States and Europe by paper commodities -- and the paper commodities which are managed and manipulated by the hedge funds and the big banks in America for financial gain -- and not just political gain, but sometimes for political gain...
The Russians are saying...we can play this game too, by the way. Maybe a higher oil price, maybe rather than a lower oil price...maybe something that will make the Europeans and Americans understand and pull back from the very aggressive stance that they're taking...everywhere, both in Israel [and] in their approach to China/Russia -- and Iran."
The whole interview [which is a must watch in its entirety in my opinion] is linked again here...but the salient points mentioned above, plus the preamble leading up to it, starts at the 18:35 minute mark -- and runs through until 20:20.
Through the work of GATA, the Russians and Chinese have known about the price management scheme in the precious metals for at least 20 years...see these two GATA dispatches linked here and here -- and both must surely know about the deepening structural deficit in silver as well.
They could pull the pin on this decades long price management scheme at any time of their choosing by halting exports. China and Russia are the No. 2 and No. 5 producers of silver on Planet Earth -- and all that either one of them would have to do is hint at that possibility -- and Keith Neumeyer's triple-digit silver price would be a reality within 48 hours.
Of course the repercussions of that would blow up a whole raft of banks, commodity trading houses and hedge funds in the west, which would reprice the entire commodity sector in very short order...including WTIC that Alastair spoke of so eloquently.
Of course this event is very much a double-edged sword in other ways as well, in that all currencies would see their purchasing powers implode with respect to the prices of commodities -- and this currency debasement would drive world-wide inflation to the moon, which would affect all countries...friend and foe alike.
But, as they say, all is fair in love and war -- and the west has been provoking Mother Russia for decades now -- and up to this point Putin, to his eternal credit, has been very restrained in his reactions. But react he will at some point -- and it doesn't necessarily have to be on the battlefield.
This repricing of silver is inevitable at some point regardless of what or who triggers it -- and the damage to the British, European and the U.S. financial systems would border on catastrophic...without a shot being fired.
The thought of using silver as a 'weapon of mass financial destruction' against the west, certainly has to be something being considered with the walls of the Kremlin -- and perhaps elsewhere.
But regardless of 'all of the above'...the ongoing and deepening structural deficit in silver will produce this result in any event at some point in the future ...with the only question being whether it arrives by the forces of natural supply & demand, or by other means.
So all we can do is sit back and see how this unfolds...either by circumstance, or design.
As always...I'm still "all in" -- and will remain so to whatever end.
I'm done for the day -- and the week -- and I'll see you here on Tuesday with the COT and Bank Participation Reports...but I may be a little later than my usual 3:00 a.m. EDT posting time.
Ed
About the author

SUBSCRIBE: https://edsteergoldsilver.com/

Ed Steer’s Daily Analysis of the Gold and Silver Markets
After eight years of writing about the precious metals for Casey Research, the folks at Stansberry & Associates—who just recently purchased controlling interest in the company—decided that my ‘niche market’ column didn’t fit into their plans.
Since the time that Casey Research was kind enough to offer me a stand-alone column, it became their most highly-rated blog almost from the outset—and has remained that way up to this date...